\📊 NIFTY 50 TRADING PLAN – 30-Jun-2025\
📍 \Previous Close:\ 25,632
📏 \Gap Opening Consideration:\ ±100 points
📈 \Chart Timeframe:\ 15-min
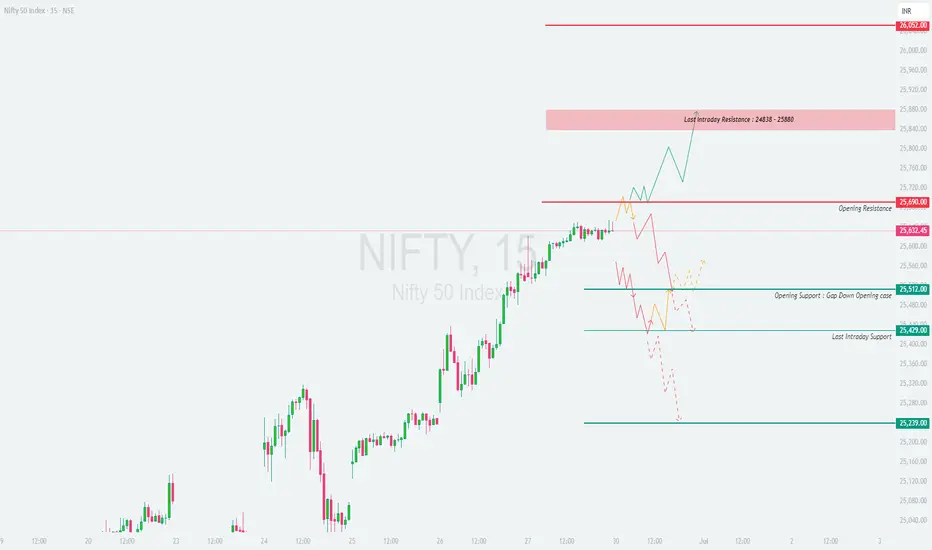
🧩 \Key Zones:\ Resistance – 25,690 / Support – 25,429 / Last Resistance – 25,838–25,880
---
\
\[\*]\🚀 GAP-UP OPENING (Above 25,730):\
If NIFTY opens above \25,730\, it will quickly enter the \Last Intraday Resistance Zone (25,838 – 25,880)\. This area is likely to act as a supply zone where profit booking may kick in. Traders should avoid aggressive longs near resistance unless a breakout is confirmed with strong momentum.
✅ \Plan of Action:\
• Wait for price action to stabilize near 25,838
• Go long only if there's a breakout above 25,880 with strong volume
• Watch for bearish patterns like shooting stars or bearish engulfing near this zone
🎯 \Trade Setup:\
– \Buy above:\ 25,880
– \Target:\ 26,000+
– \SL:\ Below 25,730 or initial range low
📘 \Tip:\ Avoid FOMO entries in first 15 minutes. Let the candle confirm breakout strength.
\[\*]\⚖️ FLAT OPENING (Near 25,630 – 25,690):\
A flat opening near \25,632\ brings the market directly around the \Opening Resistance of 25,690\. This area could lead to sideways choppiness if there’s no directional conviction. Best strategy is to wait for a breakout or breakdown from this zone.
✅ \Plan of Action:\
• Observe price behavior between 25,690 (resistance) and 25,512 (support)
• Go long if price breaks and sustains above 25,690 with strength
• Go short if breakdown below 25,512 is seen
🎯 \Trade Setup Options:\
– \Buy above:\ 25,690
– \Sell below:\ 25,512
– \Target:\ 25,838 or 25,429 depending on breakout/breakdown
– \SL:\ Opposite zone or prior swing candle
📘 \Tip:\ Wait for at least a 15-min candle close outside the range for confirmation.
\[\*]\📉 GAP-DOWN OPENING (Below 25,512):\
If NIFTY opens below \25,512\, it enters the \Opening Support Zone for Gap-Down Cases\. Immediate support lies at \25,429\, which could act as a reversal point. However, if that breaks, NIFTY may fall towards \25,239\.
✅ \Plan of Action:\
• Watch for a bounce at 25,429 for possible reversal trades
• If price breaks below 25,429 and sustains, initiate short trades
• Look for bullish candles like hammers for reversal signals
🎯 \Trade Setup:\
– \Sell below:\ 25,429
– \Target:\ 25,239
– \SL:\ Above 25,512
📘 \Tip:\ Avoid aggressive buying in early dip unless price holds and consolidates above support levels.
---
\🧭 KEY LEVELS TO WATCH:\
🔴 \Opening Resistance:\ 25,690
🟥 \Last Intraday Resistance:\ 25,838 – 25,880
🟩 \Opening Support (Gap Down):\ 25,512
🟦 \Last Intraday Support:\ 25,429
🟫 \Major Support:\ 25,239
---
\💡 OPTIONS TRADING – RISK MANAGEMENT TIPS:\
✅ Trade near ATM options for quick deltas
✅ Don’t hold naked options if VIX is falling
✅ Always set stop-loss for option premiums
✅ Avoid averaging into losing trades
✅ For gap-ups, consider Bear Call Spreads
✅ For gap-downs, look into Bull Put Spreads
🛑 Never trade based on emotion; follow structure and levels only.
---
\📌 SUMMARY – ACTIONABLE ZONES:\
• ✅ \Bullish above:\ 25,690 → Upside potential till 25,880+
• ⚠️ \Choppy zone:\ 25,512 – 25,690 → Avoid forced trades
• ❌ \Bearish below:\ 25,429 → Downside open till 25,239
🎯 \Best Trades:\ Buy above 25,880 (momentum breakout), Sell below 25,429 (breakdown confirmation)
---
\⚠️ DISCLAIMER:\
I am not a SEBI-registered analyst. This analysis is shared for educational purposes only. Please do your own research or consult a registered financial advisor before taking trades. Always use strict stop-loss and risk management protocols.
Disclaimer
The information and publications are not meant to be, and do not constitute, financial, investment, trading, or other types of advice or recommendations supplied or endorsed by TradingView. Read more in the Terms of Use.
Disclaimer
The information and publications are not meant to be, and do not constitute, financial, investment, trading, or other types of advice or recommendations supplied or endorsed by TradingView. Read more in the Terms of Use.