NIFTY TRADING PLAN – 05-Sep-2025
📌 Key Levels to Watch:
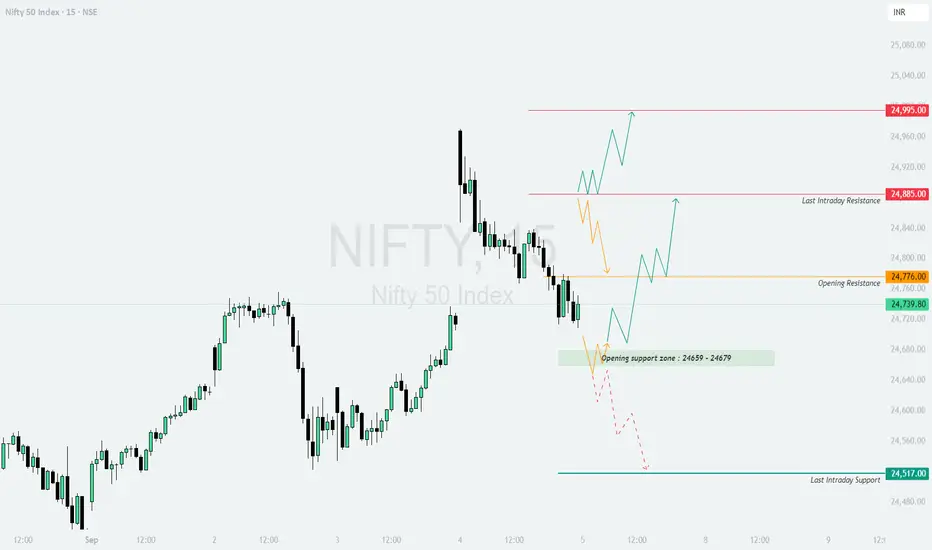
Opening Resistance: 24,776
Last Intraday Resistance: 24,885
Major Resistance: 24,995
Opening Support Zone: 24,659 – 24,679
Last Intraday Support: 24,517
The price action shows that Nifty is consolidating between strong support and resistance zones. The reaction around these levels will determine the day’s trend.
🔼 1. Gap-Up Opening (100+ points above 24,840)
If Nifty opens with a strong gap-up above 24,840, it will directly challenge the resistance zones.
📌 Plan of Action:
👉 Educational Note: Gap-ups near resistance require patience. Wait for confirmation candles before entering, as false breakouts are common at these levels.
➖ 2. Flat Opening (Around 24,720 – 24,780)
A flat start near the opening resistance indicates indecision and may lead to range-bound action initially.
📌 Plan of Action:
👉 Educational Note: Flat openings often provide the best opportunities as they allow traders to position based on the first 30 minutes of price action clarity.
🔽 3. Gap-Down Opening (100+ points below 24,620)
If Nifty opens below the support zone, sellers gain the upper hand.
📌 Plan of Action:
👉 Educational Note: Gap-downs usually trigger fear-driven moves. Avoid chasing the fall; instead, look for a retest of levels to confirm direction.
🛡️ Risk Management Tips for Options Traders
📌 Summary & Conclusion
🟢 Above 24,885 → Bullish bias towards 24,995 and beyond.
🟧 Flat Opening (24,720 – 24,780) → Wait for a breakout above 24,776 for directional clarity.
🔴 Below 24,620 → Weakness towards 24,517 with risk of further downside.
⚠️ Critical Zone: 24,659 – 24,679 (Opening Support). Watch this level closely for intraday cues.
⚠️ Disclaimer: I am not a SEBI-registered analyst. This analysis is purely educational and should not be considered financial advice. Please consult your financial advisor before making any trading decisions.
📌 Key Levels to Watch:
Opening Resistance: 24,776
Last Intraday Resistance: 24,885
Major Resistance: 24,995
Opening Support Zone: 24,659 – 24,679
Last Intraday Support: 24,517
The price action shows that Nifty is consolidating between strong support and resistance zones. The reaction around these levels will determine the day’s trend.
🔼 1. Gap-Up Opening (100+ points above 24,840)
If Nifty opens with a strong gap-up above 24,840, it will directly challenge the resistance zones.
📌 Plan of Action:
- [] Sustaining above 24,885 (last intraday resistance) will indicate strength.
[] First upside target is 24,995, where profit booking could emerge. - If momentum sustains beyond 24,995, expect a breakout rally with strong bullish sentiment.
👉 Educational Note: Gap-ups near resistance require patience. Wait for confirmation candles before entering, as false breakouts are common at these levels.
➖ 2. Flat Opening (Around 24,720 – 24,780)
A flat start near the opening resistance indicates indecision and may lead to range-bound action initially.
📌 Plan of Action:
- [] If Nifty sustains above 24,776, it can attempt to test 24,885.
[] A breakout above 24,885 strengthens the bullish trend towards 24,995. - Failure to hold above 24,720 can pull the index back into the support zone (24,659–24,679).
👉 Educational Note: Flat openings often provide the best opportunities as they allow traders to position based on the first 30 minutes of price action clarity.
🔽 3. Gap-Down Opening (100+ points below 24,620)
If Nifty opens below the support zone, sellers gain the upper hand.
📌 Plan of Action:
- [] A gap-down below 24,620 will likely drag Nifty to retest 24,517 (last intraday support).
[] Sustaining below 24,517 may invite further downside pressure with intraday weakness. - Quick rebounds can occur, but unless Nifty reclaims 24,659, the trend remains bearish.
👉 Educational Note: Gap-downs usually trigger fear-driven moves. Avoid chasing the fall; instead, look for a retest of levels to confirm direction.
🛡️ Risk Management Tips for Options Traders
- [] Always use stop losses on an hourly close basis to avoid false moves.
[] Limit exposure to 1–2% of capital per trade.
[] For uncertain days, consider deploying neutral strategies like straddles or strangles.
[] Scale out profits gradually instead of waiting for final targets. - Avoid over-leveraging; keep cash ready for adjustments.
📌 Summary & Conclusion
🟢 Above 24,885 → Bullish bias towards 24,995 and beyond.
🟧 Flat Opening (24,720 – 24,780) → Wait for a breakout above 24,776 for directional clarity.
🔴 Below 24,620 → Weakness towards 24,517 with risk of further downside.
⚠️ Critical Zone: 24,659 – 24,679 (Opening Support). Watch this level closely for intraday cues.
⚠️ Disclaimer: I am not a SEBI-registered analyst. This analysis is purely educational and should not be considered financial advice. Please consult your financial advisor before making any trading decisions.
Disclaimer
The information and publications are not meant to be, and do not constitute, financial, investment, trading, or other types of advice or recommendations supplied or endorsed by TradingView. Read more in the Terms of Use.
Disclaimer
The information and publications are not meant to be, and do not constitute, financial, investment, trading, or other types of advice or recommendations supplied or endorsed by TradingView. Read more in the Terms of Use.