📘 NIFTY 50 – TRADING PLAN for 03-Jun-2025
🕒 Timeframe: 15-minute Chart Structure
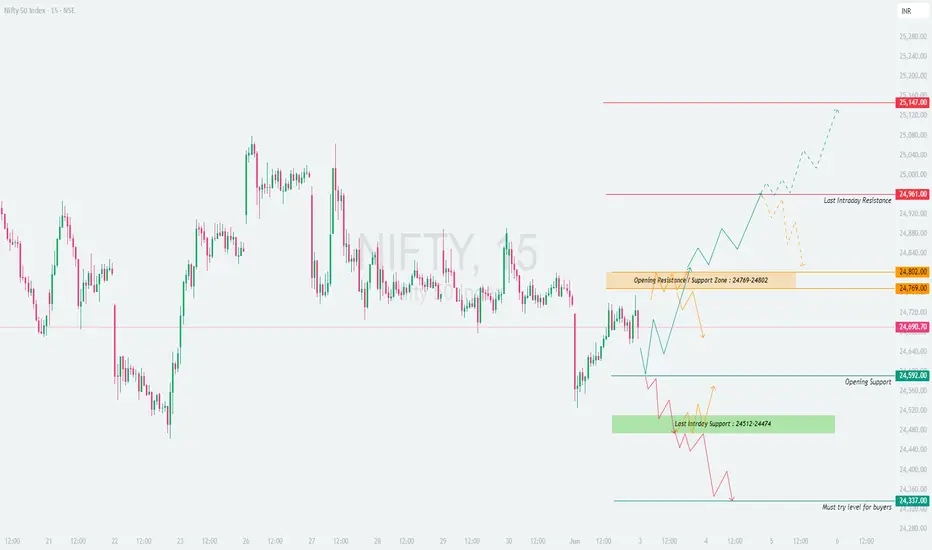
📍 Gap Opening Threshold: 100+ points from the previous close of 24,690.70
🕒 Timeframe: 15-minute Chart Structure
📍 Gap Opening Threshold: 100+ points from the previous close of 24,690.70
- 🔼 GAP-UP OPENING (Above 24,802):
A gap-up above the Opening Resistance / Support Zone (24,769 – 24,802) signals early bullish sentiment. However, Nifty will face immediate resistance at 24,961, which is the Last Intraday Resistance. If that is crossed, the path opens toward 25,147, the next major resistance level.
✅ Plan of Action:
• Let the first 15–30 minutes unfold. If price sustains above 24,802, and forms a bullish 15-min structure (e.g., a higher high candle or retest + bounce), then consider going long above 24,820–24,840 zone.
• Targets:
→ First: 24,961
→ Extended: 25,147
• Stop-loss: Below the retest candle or under 24,769, depending on entry zone.
• Avoid chasing trades directly near 24,961. Let the level either break cleanly or give a pullback opportunity.
🧠 Educational Insight: Gap-ups tend to get tested. Don’t trade breakout levels blindly — instead, wait for a strong base formation or retest bounce before entering.
- ⚖️ FLAT OPENING (Between 24,690 – 24,769):
This zone lies within the broader consolidation area and right below the Opening Resistance Zone. It’s a sensitive area where the market may attempt either a base-building process or fake breakouts.
✅ Plan of Action:
• Avoid trading immediately at open. Let price test either side of the 24,769 – 24,802 resistance band.
• Long Setup: A clear 15-min candle close above 24,802 with volume support allows a long trade targeting 24,961 and possibly 25,147, with SL below 24,769.
• Short Setup: If price rejects 24,769 – 24,802 with a strong bearish pattern (e.g., evening star or shooting star), consider a short toward 24,592, with SL above 24,802.
• Treat this area as “No Trade Zone” unless a clear breakout or breakdown occurs.
🧠 Educational Insight: Most false breakouts happen in sideways zones like this. Let structure unfold with confirmation before you commit to a direction.
- 🔽 GAP-DOWN OPENING (Below 24,592):
A gap-down below 24,592 indicates early weakness, and price may head towards the Last Intraday Support Zone (24,512 – 24,474). The final buyer defense level rests at 24,337, tagged as the Must Try Level for Buyers.
✅ Plan of Action:
• Allow 15–30 minutes to observe market reaction.
• If price holds above 24,512 – 24,474 zone and gives bullish reversal candles (hammer, bullish engulfing), it could offer a long trade toward 24,592 / 24,690.
• Aggressive Shorts: If price breaks and sustains below 24,474, look for quick scalps toward 24,337, with tight SL above 24,474.
• Reversal Longs: At 24,337, only buy if a clear bullish pattern confirms reversal; otherwise, avoid catching a falling knife.
🧠 Educational Insight: Don’t assume every support will bounce. Wait for bullish confirmation or trend shift signals. Panic selling is common on gap-downs, but reward comes only with patience.
🛡 RISK MANAGEMENT TIPS FOR OPTIONS TRADERS:
✅ 1. Avoid trading the first 5–15 minutes post-gap opening — especially with naked options. Let price stabilize.
✅ 2. Use spreads (Bull Call / Bear Put) to reduce risk and theta decay in directional bias.
✅ 3. Don’t overleverage just because premiums look cheap — IV crush can wipe you out fast.
✅ 4. Keep a time-based stop-loss for option buys — if price doesn’t move in your direction within 15–20 mins after entry, reassess.
✅ 5. Always follow the chart, not your emotions. Don’t hold losing trades hoping for a reversal.
📊 SUMMARY & CONCLUSION:
• 🟢 Bullish Above: 24,802, Targets: 24,961 / 25,147
• 🔴 Bearish Below: 24,592, Targets: 24,474 / 24,337
• 🟧 No Trade Zone: 24,690 – 24,769 → Wait for breakout/rejection structure
• 🟩 Support Zones: 24,592 / 24,474 / 24,337
• 🟥 Resistance Zones: 24,802 / 24,961 / 25,147
• ⏱ Time-based Rules: Let 15–30 mins develop to avoid false breakouts and overtrading
✨ Final Thought: Respect the plan. Let the chart tell you what to do — not your bias. The best trades are usually the most boring, disciplined ones.
📢 DISCLAIMER: I am not a SEBI-registered analyst. This trading plan is for educational and informational purposes only. Please consult a SEBI-registered financial advisor before taking any investment or trading decision.
Disclaimer
The information and publications are not meant to be, and do not constitute, financial, investment, trading, or other types of advice or recommendations supplied or endorsed by TradingView. Read more in the Terms of Use.
Disclaimer
The information and publications are not meant to be, and do not constitute, financial, investment, trading, or other types of advice or recommendations supplied or endorsed by TradingView. Read more in the Terms of Use.