📊 NIFTY TRADING PLAN – 08-Apr-2025
Chart Timeframe: 15-Minute
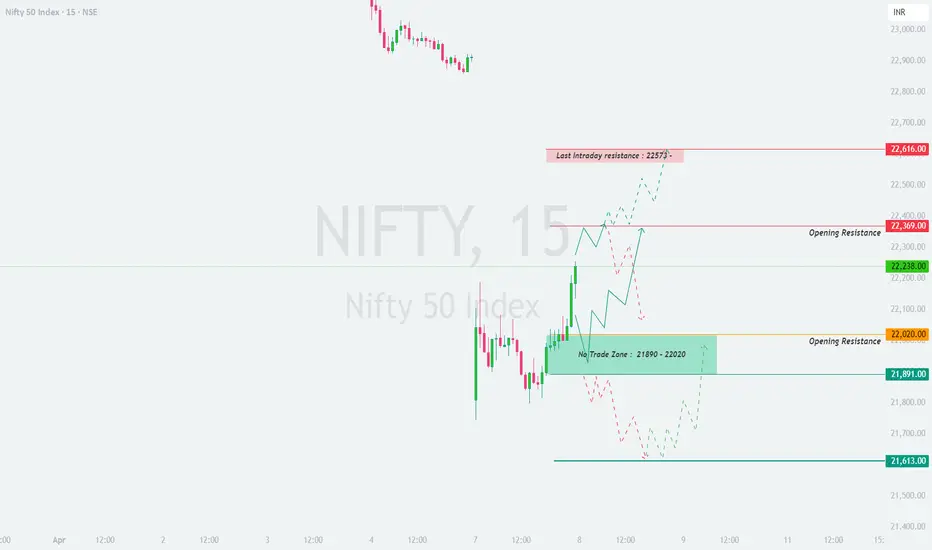
Previous Close: 22,238.00
🔍 Key Zones to Watch:
🔴 Last Intraday Resistance: 22,573 – 22,616
🟠 Opening Resistance Zone: 22,369
🟧 Lower Opening Resistance: 22,020
🟩 No Trade Zone: 21,890 – 22,020
🟢 Opening Support Zone: 21,891
🟢 Last Support Zone: 21,613
🔼 Scenario 1: Gap-Up Opening (Above 100+ points, i.e., opens above 22,339)
If Nifty opens above 22,339, we are above the immediate Opening Resistance and nearing the Intraday Resistance Zone of 22,573 – 22,616.
📌 Plan of Action:
💡 Educational Tip: A gap-up near resistance often faces selling pressure. Trade only on confirmation, not assumptions.
⚖️ Scenario 2: Flat Opening (Within 22,138 – 22,339)
A flat open around the previous close 22,238 brings price inside a reaction zone between 22,020 – 22,369.
📌 Plan of Action:
💡 Educational Tip: Sideways zones are often used by big players to trap retail traders. Focus on breakout trades with confirmation.
🔽 Scenario 3: Gap-Down Opening (Below 100+ points, i.e., opens below 22,138)
If Nifty opens below 22,138, it will likely test the lower boundary of the No Trade Zone or even the Opening Support Zone at 21,891.
📌 Plan of Action:
💡 Educational Tip: Strong support zones are best used for reversal setups, but only with confirmation and tight stop-loss.
🛡️ Options Trading Risk Management Tips
✅ Avoid Buying Far OTM Options blindly: Theta decay will eat premium fast if price consolidates.
✅ Use Spreads like Bull Call/Bear Put for safer entries: Lower cost and defined risk.
✅ Stick to Defined SL (15-min candle based): Helps avoid whipsaw exits and emotional decisions.
✅ Don’t Overtrade Inside the No Trade Zone: Wait for breakout or breakdown before initiating trades.
✅ Position Sizing is Key: Never risk more than 2% of capital on a single trade.
✅ Watch Option IV Before Entry: High IV → premiums inflated. Sell strategies work better in those conditions.
📌 Summary & Conclusion
Bullish Above: 22,369 → 22,500 → 22,573 → 22,616
Bearish Below: 22,020 → 21,891 → 21,613
No Trade Zone: 21,890 – 22,020
🧠 Best Setups: Reversal near strong support/resistance or breakout retest entries.
⏱️ First 15–30 mins are for observation: Let the market show its hand.
🧘 Discipline > Direction: Stick to process and your setup. Not every candle needs a trade.
⚠️ Disclaimer
I am not a SEBI-registered analyst. The above analysis is shared purely for educational and informational purposes. Please do your own research or consult a financial advisor before trading or investing. Trade responsibly with proper risk management.
Chart Timeframe: 15-Minute
Previous Close: 22,238.00
🔍 Key Zones to Watch:
🔴 Last Intraday Resistance: 22,573 – 22,616
🟠 Opening Resistance Zone: 22,369
🟧 Lower Opening Resistance: 22,020
🟩 No Trade Zone: 21,890 – 22,020
🟢 Opening Support Zone: 21,891
🟢 Last Support Zone: 21,613
🔼 Scenario 1: Gap-Up Opening (Above 100+ points, i.e., opens above 22,339)
If Nifty opens above 22,339, we are above the immediate Opening Resistance and nearing the Intraday Resistance Zone of 22,573 – 22,616.
📌 Plan of Action:
- [] Wait for the first 15–30 minutes. If the index retests 22,369 and forms a bullish reversal (hammer, bullish engulfing), one can consider going long for targets 22,500 → 22,573 → 22,616.
[] If price directly opens around 22,550+, avoid chasing highs. It may trap long positions. Look for signs of exhaustion near 22,573 – 22,616.
[] A breakdown below 22,369 with a 15-min candle close can shift bias to negative — expect a move down to 22,200 → 22,020.
[] Do not enter trades immediately at open. Let price develop structure, preferably a retest of breakout level.
💡 Educational Tip: A gap-up near resistance often faces selling pressure. Trade only on confirmation, not assumptions.
⚖️ Scenario 2: Flat Opening (Within 22,138 – 22,339)
A flat open around the previous close 22,238 brings price inside a reaction zone between 22,020 – 22,369.
📌 Plan of Action:
- [] If Nifty sustains above 22,369 with strong price action, go long for 22,500 – 22,573 – 22,616.
[] If price faces resistance at 22,369 and reverses, short opportunities open with targets at 22,138 → 22,020 → 21,891.
[] Avoid initiating trades inside the No Trade Zone: 21,890 – 22,020, as it could lead to choppy price action and stop hunts.
[] Best strategy is to wait for breakout/breakdown of range and follow the move with a tight SL.
💡 Educational Tip: Sideways zones are often used by big players to trap retail traders. Focus on breakout trades with confirmation.
🔽 Scenario 3: Gap-Down Opening (Below 100+ points, i.e., opens below 22,138)
If Nifty opens below 22,138, it will likely test the lower boundary of the No Trade Zone or even the Opening Support Zone at 21,891.
📌 Plan of Action:
- [] Look for buying opportunities only if price finds support around 21,891 – 21,613 with bullish reversal candles (e.g., morning star, double bottom).
[] If price breaks below 21,891 and sustains, it could fall toward 21,613 — go short on retests or lower high formations.
[] If reversal is confirmed from support zone, expect a bounce toward 22,020 – 22,138.
[] Avoid trading the first candle unless setup is clear. Let price form a base before going long.
💡 Educational Tip: Strong support zones are best used for reversal setups, but only with confirmation and tight stop-loss.
🛡️ Options Trading Risk Management Tips
✅ Avoid Buying Far OTM Options blindly: Theta decay will eat premium fast if price consolidates.
✅ Use Spreads like Bull Call/Bear Put for safer entries: Lower cost and defined risk.
✅ Stick to Defined SL (15-min candle based): Helps avoid whipsaw exits and emotional decisions.
✅ Don’t Overtrade Inside the No Trade Zone: Wait for breakout or breakdown before initiating trades.
✅ Position Sizing is Key: Never risk more than 2% of capital on a single trade.
✅ Watch Option IV Before Entry: High IV → premiums inflated. Sell strategies work better in those conditions.
📌 Summary & Conclusion
Bullish Above: 22,369 → 22,500 → 22,573 → 22,616
Bearish Below: 22,020 → 21,891 → 21,613
No Trade Zone: 21,890 – 22,020
🧠 Best Setups: Reversal near strong support/resistance or breakout retest entries.
⏱️ First 15–30 mins are for observation: Let the market show its hand.
🧘 Discipline > Direction: Stick to process and your setup. Not every candle needs a trade.
⚠️ Disclaimer
I am not a SEBI-registered analyst. The above analysis is shared purely for educational and informational purposes. Please do your own research or consult a financial advisor before trading or investing. Trade responsibly with proper risk management.
Disclaimer
The information and publications are not meant to be, and do not constitute, financial, investment, trading, or other types of advice or recommendations supplied or endorsed by TradingView. Read more in the Terms of Use.
Disclaimer
The information and publications are not meant to be, and do not constitute, financial, investment, trading, or other types of advice or recommendations supplied or endorsed by TradingView. Read more in the Terms of Use.