📘 NIFTY TRADING PLAN – 21-Apr-2025
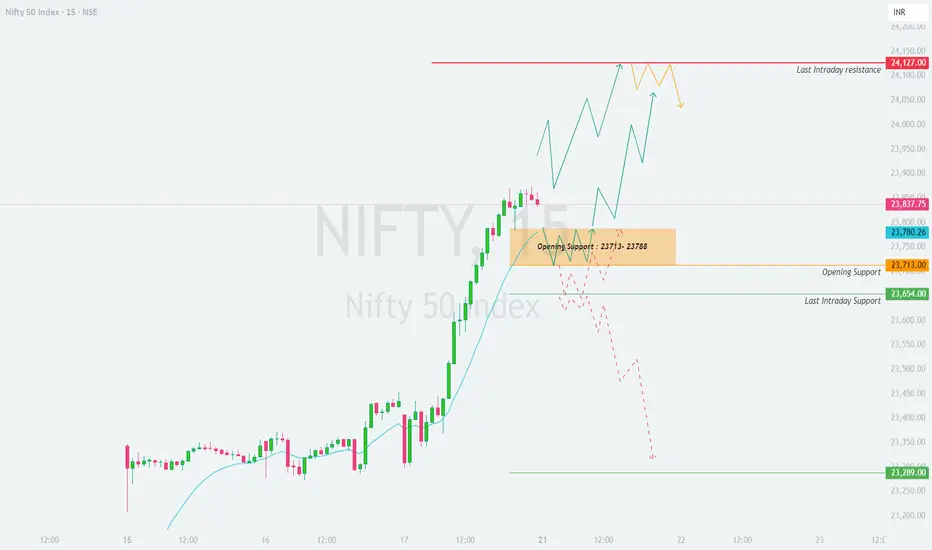
📊 Index Spot Close: 23,837.75 | ⏱ Timeframe: 15-Min | 🚪 Gap Opening Threshold: 100+ Points
🔼 Scenario 1: Gap-Up Opening (Above 23,938+)
If Nifty opens 100+ points higher above 23,938, it will be trading close to the last intraday resistance marked at 24,127. The recent rally has been steep, so profit booking or resistance can emerge at higher levels. Momentum continuation can only be expected if there is consolidation or retest above breakout levels.
📌 Plan of Action:
💡 Educational Insight:
A gap-up near resistance should not be chased blindly. Market may trap bulls before turning. Look for higher-low formations or a bullish flag near 24,000+ to confirm strength.
⚖️ Scenario 2: Flat Opening (Between 23,738 – 23,938)
This is a balanced opening where price opens within or slightly above the critical support zone of 23,713–23,788. This range serves as the launchpad or failure point based on early moves.
📌 Plan of Action:
💡 Educational Insight:
Flat opens near crucial supports often lead to decisive moves after initial range expansion. React, don’t predict. The first breakout (up/down) often defines the tone of the day.
🔽 Scenario 3: Gap-Down Opening (Below 23,713)
A gap-down below the orange zone (23,713–23,788) is significant and could trigger a pullback towards the green support levels 23,654 and potentially 23,289.
📌 Plan of Action:
💡 Educational Insight:
Support breaks on gap-downs can be strong, but bear in mind — market makers often trap panic sellers. Be alert for false breakdowns and quick reversals.
🛡️ Risk Management Tips for Options Traders 💼🔐
✅ Avoid trading in first 15–30 mins — volatility traps are common.
✅ Use ATM or slightly ITM options to avoid excessive time decay.
✅ Set SL based on structure, not emotions — eg. previous candle low/high.
✅ Avoid over-leveraging — 1-2% risk per trade is optimal.
✅ Keep a max 2-trade rule per direction — don’t overtrade.
✅ Track IV (Implied Volatility) — spreads work better in high IV setups.
✅ Record your trades — wins teach less, losses teach more.
✅ Avoid revenge trading — take a break after a loss, regain calm.
🧾 Summary & Conclusion 🧠📊
📍 Gap-Up (Above 23,938): Watch for resistance at 24,127, avoid chasing highs without retest.
📍 Flat Open (23,738–23,938): Watch for structure near 23,788; breakout above = bullish, rejection = bearish.
📍 Gap-Down (Below 23,713): Possible downside toward 23,654 → 23,289. Reclaim of 23,713 invalidates shorts.
📍 Zone to Watch Closely: 23,713–23,788 (critical intraday pivot for both bulls & bears).
🧘♂️ Final Note: Trade less, trade well. Market gives opportunities daily — protect your capital so you’re around to take them.
⚠️ Disclaimer:
I am not a SEBI-registered analyst. This trading plan is meant for educational purposes only. Please consult a financial advisor or conduct your own research before making any trades. Trading involves risk — always use proper risk management.
📊 Index Spot Close: 23,837.75 | ⏱ Timeframe: 15-Min | 🚪 Gap Opening Threshold: 100+ Points
🔼 Scenario 1: Gap-Up Opening (Above 23,938+)
If Nifty opens 100+ points higher above 23,938, it will be trading close to the last intraday resistance marked at 24,127. The recent rally has been steep, so profit booking or resistance can emerge at higher levels. Momentum continuation can only be expected if there is consolidation or retest above breakout levels.
📌 Plan of Action:
- [] Allow the index to settle for the first 15–30 minutes to avoid opening volatility.
[] If price sustains above 24,000 and breaks above 24,127, aggressive buying can be considered for upside momentum. However, trail SL tightly as price enters uncharted territory.
[] Be cautious if price opens directly near or inside the 24,127 zone – wait for a rejection or reversal sign before considering any short.
[] Any gap-up followed by selling pressure that brings price below 23,938 could be a gap-fill trap – consider shorting if structure confirms breakdown. - Upside targets after 24,127 breach could be 24,200+ intraday; however, don't chase trades blindly above resistance.
💡 Educational Insight:
A gap-up near resistance should not be chased blindly. Market may trap bulls before turning. Look for higher-low formations or a bullish flag near 24,000+ to confirm strength.
⚖️ Scenario 2: Flat Opening (Between 23,738 – 23,938)
This is a balanced opening where price opens within or slightly above the critical support zone of 23,713–23,788. This range serves as the launchpad or failure point based on early moves.
📌 Plan of Action:
- [] Let the 15-min candle close; avoid trades in the first few bars unless a clean structure forms.
[] If price sustains above 23,788 and starts forming higher highs, then the market may attempt a breakout toward 23,938 → 24,127. Longs can be taken above 23,850 with tight SL below 23,788.
[] On the downside, if price starts slipping below 23,713, this zone becomes resistance. Shorts can be planned with targets: 23,654 → 23,500.
[] Price trapped within 23,738–23,850 might trigger sideways action. Avoid trading inside this range unless breakout or breakdown occurs. - Look for volume confirmation and a clear directional bias before taking positions.
💡 Educational Insight:
Flat opens near crucial supports often lead to decisive moves after initial range expansion. React, don’t predict. The first breakout (up/down) often defines the tone of the day.
🔽 Scenario 3: Gap-Down Opening (Below 23,713)
A gap-down below the orange zone (23,713–23,788) is significant and could trigger a pullback towards the green support levels 23,654 and potentially 23,289.
📌 Plan of Action:
- [] Let the market absorb the gap-down in the first 15–30 minutes — don’t enter impulsively.
[] If price bounces and reclaims 23,713, stay away from shorts. Look for reversal patterns (e.g. double bottom or engulfing) for long trades with SL below day’s low.
[] If price stays below 23,713 and breaks below 23,654, initiate shorts with targets at 23,500 → 23,289.
[] Watch for bullish traps — don't short blindly at supports. Wait for confirmation candles and volume on breakdowns. - In case of deep gap-down directly near 23,289, wait for reversal signs to attempt any long, else avoid bottom-fishing.
💡 Educational Insight:
Support breaks on gap-downs can be strong, but bear in mind — market makers often trap panic sellers. Be alert for false breakdowns and quick reversals.
🛡️ Risk Management Tips for Options Traders 💼🔐
✅ Avoid trading in first 15–30 mins — volatility traps are common.
✅ Use ATM or slightly ITM options to avoid excessive time decay.
✅ Set SL based on structure, not emotions — eg. previous candle low/high.
✅ Avoid over-leveraging — 1-2% risk per trade is optimal.
✅ Keep a max 2-trade rule per direction — don’t overtrade.
✅ Track IV (Implied Volatility) — spreads work better in high IV setups.
✅ Record your trades — wins teach less, losses teach more.
✅ Avoid revenge trading — take a break after a loss, regain calm.
🧾 Summary & Conclusion 🧠📊
📍 Gap-Up (Above 23,938): Watch for resistance at 24,127, avoid chasing highs without retest.
📍 Flat Open (23,738–23,938): Watch for structure near 23,788; breakout above = bullish, rejection = bearish.
📍 Gap-Down (Below 23,713): Possible downside toward 23,654 → 23,289. Reclaim of 23,713 invalidates shorts.
📍 Zone to Watch Closely: 23,713–23,788 (critical intraday pivot for both bulls & bears).
🧘♂️ Final Note: Trade less, trade well. Market gives opportunities daily — protect your capital so you’re around to take them.
⚠️ Disclaimer:
I am not a SEBI-registered analyst. This trading plan is meant for educational purposes only. Please consult a financial advisor or conduct your own research before making any trades. Trading involves risk — always use proper risk management.
Disclaimer
The information and publications are not meant to be, and do not constitute, financial, investment, trading, or other types of advice or recommendations supplied or endorsed by TradingView. Read more in the Terms of Use.
Disclaimer
The information and publications are not meant to be, and do not constitute, financial, investment, trading, or other types of advice or recommendations supplied or endorsed by TradingView. Read more in the Terms of Use.