💼 NIFTY TRADING PLAN – 09-Oct-2025
📊 Chart Reference: 15-min Timeframe
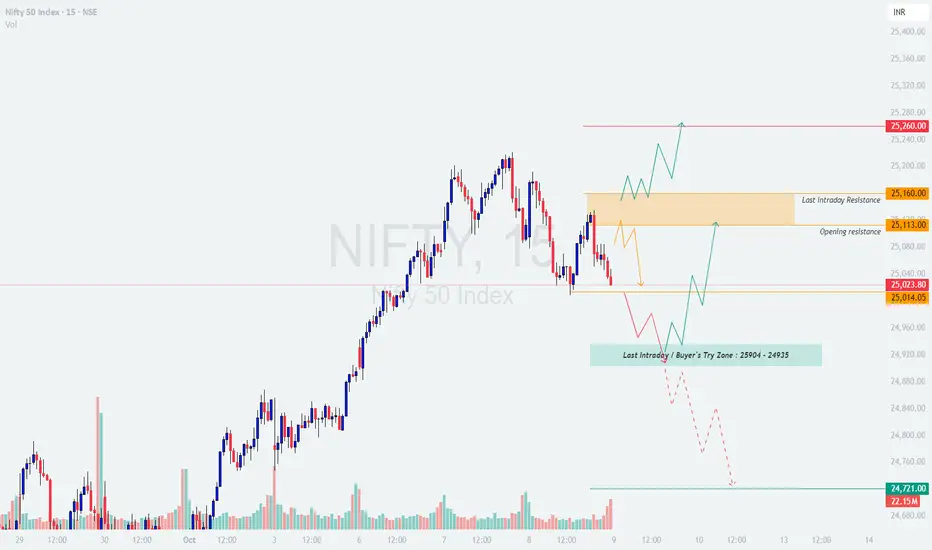
📍 Last Close: 25,023.80 | 🔻 Change: -12.60 pts (-0.05%)
📅 Analysis Based on Psychological and Technical Levels
🔍 Key Technical Zones
🟧 Opening Resistance: 25,113
🟧 Last Intraday Resistance: 25,160
🟥 Major Resistance: 25,260
🟩 Buyer’s Try Zone: 25,094 – 24,935
🟢 Next Support: 24,721
📈 Scenario 1 – Gap Up Opening (100+ pts above 25,123)
If Nifty opens around or above the 25,150–25,180 zone, it will enter near the last intraday resistance area.
🧠 Educational Note:
A gap-up opening near resistance zones often triggers early profit booking. Let the market reveal its true direction before acting. Avoid emotional entries in the first 15 minutes.
⚖️ Scenario 2 – Flat Opening (Around 25,000 ± 50 pts)
A flat start indicates indecision and offers balanced opportunities.
💡 Educational Note:
Flat openings work best when traders plan both sides. Use 15-min candle confirmations and align with broader trend direction from hourly charts.
📉 Scenario 3 – Gap Down Opening (100+ pts below 24,930)
A gap down would place Nifty straight into or below the Buyer’s Try Zone.
🧠 Educational Note:
Gap-down opens often induce panic. The key is not to chase moves. Let the market test support and confirm reversal before committing capital.
🛡️ Risk Management Tips for Options Traders
📊 Summary & Conclusion
🎯 Focus Zone for 09-Oct-2025:
🟩 25,014 → 24,935 (Buyer’s Control)
🟥 25,160 → 25,260 (Seller’s Control)
📢 Disclaimer:
I am not a SEBI-registered analyst. The above analysis is for educational and informational purposes only. Traders should conduct their own research or consult a financial advisor before making any investment decisions.
📊 Chart Reference: 15-min Timeframe
📍 Last Close: 25,023.80 | 🔻 Change: -12.60 pts (-0.05%)
📅 Analysis Based on Psychological and Technical Levels
🔍 Key Technical Zones
🟧 Opening Resistance: 25,113
🟧 Last Intraday Resistance: 25,160
🟥 Major Resistance: 25,260
🟩 Buyer’s Try Zone: 25,094 – 24,935
🟢 Next Support: 24,721
📈 Scenario 1 – Gap Up Opening (100+ pts above 25,123)
If Nifty opens around or above the 25,150–25,180 zone, it will enter near the last intraday resistance area.
- []Initial candles should be observed for supply reaction. If prices sustain above 25,160 for 15–30 minutes, momentum traders may expect a rally toward 25,260 — the next psychological resistance.
[]However, if price shows rejection at 25,160 and fails to close above it on a 15-min basis, expect a pullback toward 25,050–25,014.
[]Fresh buying should only be considered after a breakout and retest above 25,160, confirming strength.
[]Aggressive short traders can consider small risk entries near 25,250–25,260 only if reversal candles appear.
🧠 Educational Note:
A gap-up opening near resistance zones often triggers early profit booking. Let the market reveal its true direction before acting. Avoid emotional entries in the first 15 minutes.
⚖️ Scenario 2 – Flat Opening (Around 25,000 ± 50 pts)
A flat start indicates indecision and offers balanced opportunities.
- []If Nifty holds 25,014–25,040 and rebounds, a short-term long trade can be considered with targets near 25,113 → 25,160.
[]A sustained move above 25,160 could extend gains to 25,260, but watch volume confirmation.
[]If the index slips below 25,014, sellers might test the Buyer’s Try Zone (25,094–24,935) where a strong reversal can occur.
[]Any hourly candle close below 24,935 may open the gate for deeper correction toward 24,721.
💡 Educational Note:
Flat openings work best when traders plan both sides. Use 15-min candle confirmations and align with broader trend direction from hourly charts.
📉 Scenario 3 – Gap Down Opening (100+ pts below 24,930)
A gap down would place Nifty straight into or below the Buyer’s Try Zone.
- []Observe price behavior near 24,935–24,900. If buyers defend this zone with strong green candles, expect a sharp intraday pullback toward 25,014 → 25,113.
[]Failure to sustain above 24,900 may accelerate decline toward 24,721, a crucial swing support.
[]Avoid shorting aggressively at open — wait for a 15-min candle close below 24,900 for confirmation.
[]Reversal traders can build long exposure gradually with tight stops below 24,720 if support holds.
🧠 Educational Note:
Gap-down opens often induce panic. The key is not to chase moves. Let the market test support and confirm reversal before committing capital.
🛡️ Risk Management Tips for Options Traders
- []Keep position size within 2–3% of total capital for each trade.
[]Always define a stop loss based on candle close, not just intraday wicks.
[]Avoid trading OTM options during volatile sessions; use near ATM strikes for better delta control.
[]If volatility spikes, consider switching to spreads (bull call / bear put) to limit theta decay.
[]Respect time decay — avoid holding positions beyond 2:30 PM unless trend is very clear.
[]Never revenge trade after a stop-loss hit; remember, risk control = long-term survival. 🔒
📊 Summary & Conclusion
- []Nifty remains in a short-term corrective phase, with 25,160 acting as a crucial breakout level.
[]A move above 25,160 could lift prices toward 25,260, while rejection may invite selling pressure.
[]Support sits near 25,014 and deeper at 24,935–24,721.
[]Traders should focus on confirmation rather than prediction — patience and discipline will decide profitability.
🎯 Focus Zone for 09-Oct-2025:
🟩 25,014 → 24,935 (Buyer’s Control)
🟥 25,160 → 25,260 (Seller’s Control)
📢 Disclaimer:
I am not a SEBI-registered analyst. The above analysis is for educational and informational purposes only. Traders should conduct their own research or consult a financial advisor before making any investment decisions.
Disclaimer
The information and publications are not meant to be, and do not constitute, financial, investment, trading, or other types of advice or recommendations supplied or endorsed by TradingView. Read more in the Terms of Use.
Disclaimer
The information and publications are not meant to be, and do not constitute, financial, investment, trading, or other types of advice or recommendations supplied or endorsed by TradingView. Read more in the Terms of Use.