📈 NIFTY Trading Plan – 07-Apr-2025
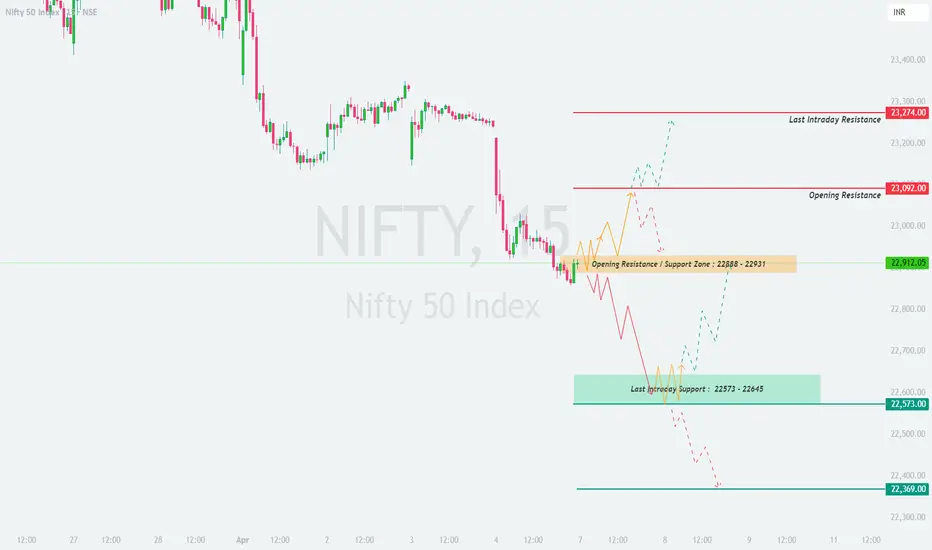
Chart Reference: 15-Minute Timeframe
Previous Close: 22,912.05
Key Zones to Watch:
🟥 Opening Resistance Zone: 23,092
🟥 Last Intraday Resistance: 23,274
🟧 Opening Resistance/Support Zone: 22,888 – 22,931
🟩 Last Intraday Support Zone: 22,573 – 22,645
🟢 Support Below: 22,369
Let’s dive into each opening possibility with educational insights and actionable steps:
🔼 Scenario 1: Gap-Up Opening (100+ Points Above 23,092)
A gap-up above the Opening Resistance of 23,092 indicates bullish enthusiasm. However, the region around 23,274 marks a crucial Last Intraday Resistance, where supply could emerge.
📌 Plan of Action:
💡 Educational Insight:
Gap-ups often get sold into if not backed by strong follow-through buying. The region between 23,092 and 23,274 will act as a liquidity zone.
⚖️ Scenario 2: Flat Opening (Between 22,888 – 22,931 Zone)
A flat opening near the Opening Resistance/Support Zone (22,888 – 22,931) suggests indecision. This is a balance area, and price action will dictate the intraday trend.
📌 Plan of Action:
💡 Educational Insight:
When Nifty opens in a balance zone, the best trade usually forms after a breakout/rejection from that zone. Let the market show its hand first.
🔽 Scenario 3: Gap-Down Opening (100+ Points Below 22,888)
A gap-down opening below the support zone (22,888) reflects negative sentiment. The Last Intraday Support Zone (22,573 – 22,645) will be the key battlefield.
📌 Plan of Action:
💡 Educational Insight:
Gap-downs near strong support zones often result in short-covering rallies. Watch for reversal patterns like hammer or bullish engulfing candles on 15-min chart.
🛡️ Options Trading Risk Management Tips
📍 1. Avoid Overnight Positions in Weekly Expiry Zone: Theta decay and volatility can hurt your premium positions.
📍 2. Prefer Spread Strategies: Like bull call or bear put spreads to control risk.
📍 3. Use Defined Stop-Loss: Always keep SL based on candle close (15-min or hourly).
📍 4. Limit Position Sizing: Never risk more than 1-2% of your capital in a single trade.
📍 5. Avoid Trading Inside Range: When market is choppy between 22,888 – 23,092, stay light. Wait for confirmation.
🧾 Summary & Conclusion
📌 Key Resistance Levels:
🟥 23,092 → 23,274 → 23,370+
📌 Support Levels:
🟧 22,888 – 22,931
🟩 22,573 – 22,645
🟢 22,369
📌 Bias Based on Opening:
✅ Bullish Bias: Above 23,092, momentum toward 23,274 likely.
❌ Bearish Bias: Below 22,888, risk of fall toward 22,573 → 22,369.
⏸️ Neutral Zone: Inside 22,888 – 22,931, let market decide.
🎯 Stick to the plan, manage risk like a pro, and remember – patience is the best indicator!
⚠️ Disclaimer
I am not a SEBI-registered analyst. This analysis is purely for educational purposes only. Please do your own research or consult your financial advisor before taking any trade decisions.
Chart Reference: 15-Minute Timeframe
Previous Close: 22,912.05
Key Zones to Watch:
🟥 Opening Resistance Zone: 23,092
🟥 Last Intraday Resistance: 23,274
🟧 Opening Resistance/Support Zone: 22,888 – 22,931
🟩 Last Intraday Support Zone: 22,573 – 22,645
🟢 Support Below: 22,369
Let’s dive into each opening possibility with educational insights and actionable steps:
🔼 Scenario 1: Gap-Up Opening (100+ Points Above 23,092)
A gap-up above the Opening Resistance of 23,092 indicates bullish enthusiasm. However, the region around 23,274 marks a crucial Last Intraday Resistance, where supply could emerge.
📌 Plan of Action:
- [] Wait for price to sustain above 23,092 for 15–30 minutes with strong bullish candles and volume.
[] If sustained, consider long positions targeting 23,274. Book partial profits here.
[] A breakout above 23,274 may trigger a further upmove, but only if supported by volume. Targets could be 23,370+.
[] If Nifty opens above 23,092 but quickly drops below, it may trap longs. Wait for a retest before re-entering.
💡 Educational Insight:
Gap-ups often get sold into if not backed by strong follow-through buying. The region between 23,092 and 23,274 will act as a liquidity zone.
⚖️ Scenario 2: Flat Opening (Between 22,888 – 22,931 Zone)
A flat opening near the Opening Resistance/Support Zone (22,888 – 22,931) suggests indecision. This is a balance area, and price action will dictate the intraday trend.
📌 Plan of Action:
- [] Wait and watch the first 15-minute candle for clarity.
[] If Nifty breaks above 23,092 with strength, ride it toward 23,274.
[] If it slips below 22,888, the downside opens toward 22,645 → 22,573.
[] This zone is a No Trade Zone until a clear breakout or breakdown. Avoid early trades.
💡 Educational Insight:
When Nifty opens in a balance zone, the best trade usually forms after a breakout/rejection from that zone. Let the market show its hand first.
🔽 Scenario 3: Gap-Down Opening (100+ Points Below 22,888)
A gap-down opening below the support zone (22,888) reflects negative sentiment. The Last Intraday Support Zone (22,573 – 22,645) will be the key battlefield.
📌 Plan of Action:
- [] Observe if Nifty holds within the 22,573 – 22,645 area. If supported, expect a bounce back toward 22,888 – 22,931.
[] A breakdown below 22,573 opens the way toward 22,369.
[] Don’t chase shorts at open. Wait for a pullback toward 22,645 – 22,700 to initiate fresh positions with better risk-reward.
[] If price stabilizes around 22,573, scalping opportunities on both sides may appear.
💡 Educational Insight:
Gap-downs near strong support zones often result in short-covering rallies. Watch for reversal patterns like hammer or bullish engulfing candles on 15-min chart.
🛡️ Options Trading Risk Management Tips
📍 1. Avoid Overnight Positions in Weekly Expiry Zone: Theta decay and volatility can hurt your premium positions.
📍 2. Prefer Spread Strategies: Like bull call or bear put spreads to control risk.
📍 3. Use Defined Stop-Loss: Always keep SL based on candle close (15-min or hourly).
📍 4. Limit Position Sizing: Never risk more than 1-2% of your capital in a single trade.
📍 5. Avoid Trading Inside Range: When market is choppy between 22,888 – 23,092, stay light. Wait for confirmation.
🧾 Summary & Conclusion
📌 Key Resistance Levels:
🟥 23,092 → 23,274 → 23,370+
📌 Support Levels:
🟧 22,888 – 22,931
🟩 22,573 – 22,645
🟢 22,369
📌 Bias Based on Opening:
✅ Bullish Bias: Above 23,092, momentum toward 23,274 likely.
❌ Bearish Bias: Below 22,888, risk of fall toward 22,573 → 22,369.
⏸️ Neutral Zone: Inside 22,888 – 22,931, let market decide.
🎯 Stick to the plan, manage risk like a pro, and remember – patience is the best indicator!
⚠️ Disclaimer
I am not a SEBI-registered analyst. This analysis is purely for educational purposes only. Please do your own research or consult your financial advisor before taking any trade decisions.
Disclaimer
The information and publications are not meant to be, and do not constitute, financial, investment, trading, or other types of advice or recommendations supplied or endorsed by TradingView. Read more in the Terms of Use.
Disclaimer
The information and publications are not meant to be, and do not constitute, financial, investment, trading, or other types of advice or recommendations supplied or endorsed by TradingView. Read more in the Terms of Use.