Current Context: Nifty50 trading near 25,400, a tested support zone. Market structure suggests two potential scenarios based on price reaction at this level.
🔍 Key Levels to Monitor
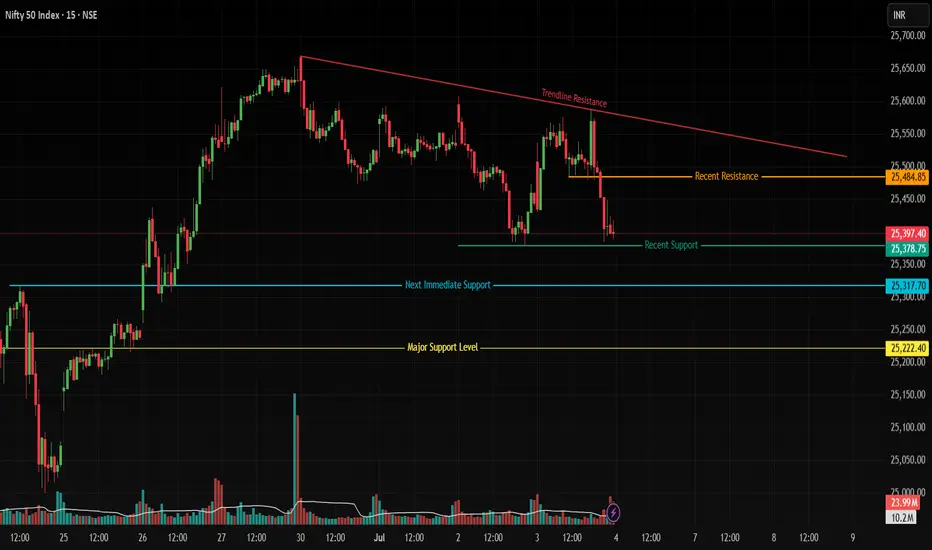
Immediate Support: 25,400 (recent price anchor)
Next Supports: 25,300 (minor swing low) → 25,220 (major historical base)
Near-Term Resistance: 25,480 (recent swing high)
Trendline Resistance: 25,575 (drawn from June 30 highs)
📈 Bullish Scenario Framework
Observation Criteria: A robust green candle closing above 25,400.
Potential Structure:
Break above 25,480, Recent Resistance (Orange line) may signal momentum toward 25,575 trendline resistance.
Note: Volume confirmation could strengthen validity.
📉 Bearish Scenario Framework
Observation Criteria: Strong red candle closing below 25,400.
Potential Structure:
Sustained move below 25,400 opens 25,300 zone (Blue Line) as next interest area.
25,220 becomes focal point if 25,300 fails to hold.
🔎 Why This Matters
25,400 Significance: Acts as a hinge between recent consolidation (bullish) and distribution (bearish).
Volume & Candles: Strength/weakness in breakouts may be validated by volume spikes.
Trendline Context: 25,575 aligns with a 4-session descending trendline (tested twice).
⚠️ Disclaimer
This idea highlights observed market structure levels and is not trading advice. It does not constitute a recommendation to buy/sell securities or any financial instrument. Market conditions change rapidly; always conduct independent analysis and consider your risk tolerance before trading. Past performance is not indicative of future results.
🔍 Key Levels to Monitor
Immediate Support: 25,400 (recent price anchor)
Next Supports: 25,300 (minor swing low) → 25,220 (major historical base)
Near-Term Resistance: 25,480 (recent swing high)
Trendline Resistance: 25,575 (drawn from June 30 highs)
📈 Bullish Scenario Framework
Observation Criteria: A robust green candle closing above 25,400.
Potential Structure:
Break above 25,480, Recent Resistance (Orange line) may signal momentum toward 25,575 trendline resistance.
Note: Volume confirmation could strengthen validity.
📉 Bearish Scenario Framework
Observation Criteria: Strong red candle closing below 25,400.
Potential Structure:
Sustained move below 25,400 opens 25,300 zone (Blue Line) as next interest area.
25,220 becomes focal point if 25,300 fails to hold.
🔎 Why This Matters
25,400 Significance: Acts as a hinge between recent consolidation (bullish) and distribution (bearish).
Volume & Candles: Strength/weakness in breakouts may be validated by volume spikes.
Trendline Context: 25,575 aligns with a 4-session descending trendline (tested twice).
⚠️ Disclaimer
This idea highlights observed market structure levels and is not trading advice. It does not constitute a recommendation to buy/sell securities or any financial instrument. Market conditions change rapidly; always conduct independent analysis and consider your risk tolerance before trading. Past performance is not indicative of future results.
Disclaimer
The information and publications are not meant to be, and do not constitute, financial, investment, trading, or other types of advice or recommendations supplied or endorsed by TradingView. Read more in the Terms of Use.
Disclaimer
The information and publications are not meant to be, and do not constitute, financial, investment, trading, or other types of advice or recommendations supplied or endorsed by TradingView. Read more in the Terms of Use.