\📊 NIFTY TRADING PLAN – 1-Jul-2025\
📍 \Previous Close:\ 25,507
📏 \Gap Opening Consideration:\ ±100 points
🧭 \Key Zones to Monitor:\
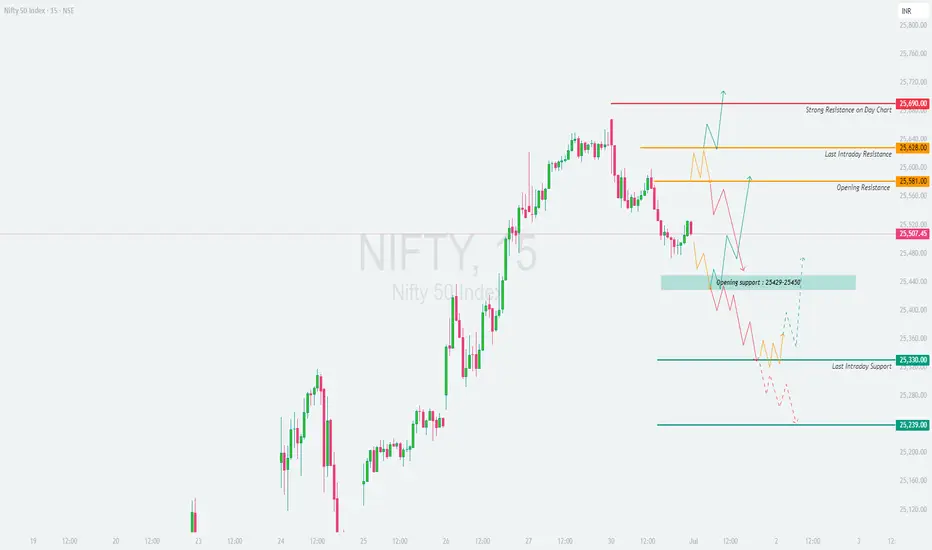
🔴 Strong Resistance on Day Chart: \25,690\
🟧 Last Intraday Resistance: \25,628 – 25,640\
🟨 Opening Resistance: \25,581\
🟦 Opening Support: \25,429 – 25,450\
🟩 Last Intraday Support: \25,330\
🟫 Final Support: \25,239\
---
\
\[\*]\🚀 GAP-UP OPENING (Above 25,640):\
A gap-up above \25,640\ pushes Nifty into the \Strong Resistance zone\ visible on the daily chart. This area may trigger profit booking unless broken with strong volume and momentum.
✅ \Plan of Action:\
• Wait for a 15-min candle close above 25,690 for confirmation of breakout
• If price stalls or forms reversal patterns, initiate short trade setups
• Only aggressive buyers may consider long trades above 25,690 if follow-up candles are strong
🎯 \Trade Setup:\
– \Buy above:\ 25,690, SL: 25,628, Target: Trailing towards 25,750+
– \Sell near resistance:\ 25,675–25,690 zone if reversal confirmed, SL: 25,705, Target: 25,581
📘 \Tip:\ Avoid buying directly into resistance. Wait for a breakout + retest for cleaner entries.
\[\*]\⚖️ FLAT OPENING (Near 25,500 – 25,540):\
Flat openings near the \Opening Resistance (25,581)\ can create indecisive sideways moves in early sessions.
✅ \Plan of Action:\
• If price breaks above 25,581 with strength, look for long trades
• If price faces rejection near 25,581 or 25,628, wait for breakdown below 25,507 to confirm weakness
• Below 25,507, next support lies at the 25,429–25,450 zone
🎯 \Trade Setup:\
– \Buy above breakout of 25,581, SL: 25,500, Target: 25,628–25,690
– \Sell below 25,507, SL: 25,581, Target: 25,450 or lower
📘 \Tip:\ Flat opens are best traded on confirmation candles, not assumptions. Avoid overtrading.
\[\*]\📉 GAP-DOWN OPENING (Below 25,400):\
A gap-down below 25,400 opens the day near the \Opening Support zone of 25,429–25,450\. This area is critical — a bounce or breakdown will define the day.
✅ \Plan of Action:\
• If price shows bullish reversal signs near 25,429, consider a pullback trade
• Breakdown of 25,429 with volume may extend downside toward 25,330 and even 25,239
• Avoid chasing long trades unless price stabilizes above 25,450
🎯 \Trade Setup:\
– \Buy near support:\ 25,429 with SL below 25,390, Target: 25,507
– \Sell on breakdown below 25,429, SL: 25,450, Target: 25,330 – 25,239
📘 \Tip:\ Gap-down opens attract trap setups. Let the market settle before committing.
---
\🧭 KEY LEVELS – QUICK REFERENCE:\
🔺 \Strong Resistance:\ 25,690
🟧 \Last Resistance:\ 25,628 – 25,640
🟨 \Opening Resistance:\ 25,581
🟦 \Opening Support:\ 25,429 – 25,450
🟩 \Intraday Support:\ 25,330
🟥 \Final Support:\ 25,239
---
\💡 OPTIONS TRADING – RISK MANAGEMENT TIPS:\
✅ Stick to \defined range breakouts\ before entering directional trades
✅ Don’t overleverage into gap-ups/downs; let premiums cool
✅ \Avoid selling naked options\ without clear structure
✅ Protect capital with \hedged strategies\ like debit spreads
✅ \Exit when your reason is invalidated\, not when SL hits randomly
🛡️ \Always use stop-losses\, especially in high-IV environments.
---
\📌 SUMMARY:\
• 📈 \Bullish above:\ 25,581 → 25,640 → 25,690
• 📉 \Bearish below:\ 25,507 → 25,429 → 25,330
• 🚫 \No trade zone:\ 25,507–25,581 (if inside, wait for clarity)
🎯 \Focus Zones:\
– Long breakout above 25,581
– Short breakdown below 25,429
– Reversal plays at 25,429 or 25,239 if structure supports
---
\⚠️ DISCLAIMER:\
I am not a SEBI-registered analyst. This content is shared only for educational purposes. Please do your own analysis or consult a professional financial advisor before taking trades. Risk management is essential—never trade without a stop-loss and always protect your capital.
Disclaimer
The information and publications are not meant to be, and do not constitute, financial, investment, trading, or other types of advice or recommendations supplied or endorsed by TradingView. Read more in the Terms of Use.
Disclaimer
The information and publications are not meant to be, and do not constitute, financial, investment, trading, or other types of advice or recommendations supplied or endorsed by TradingView. Read more in the Terms of Use.