📊 Technical Analysis: OFSS – Weekly Chart
🌀 Elliott Wave Count
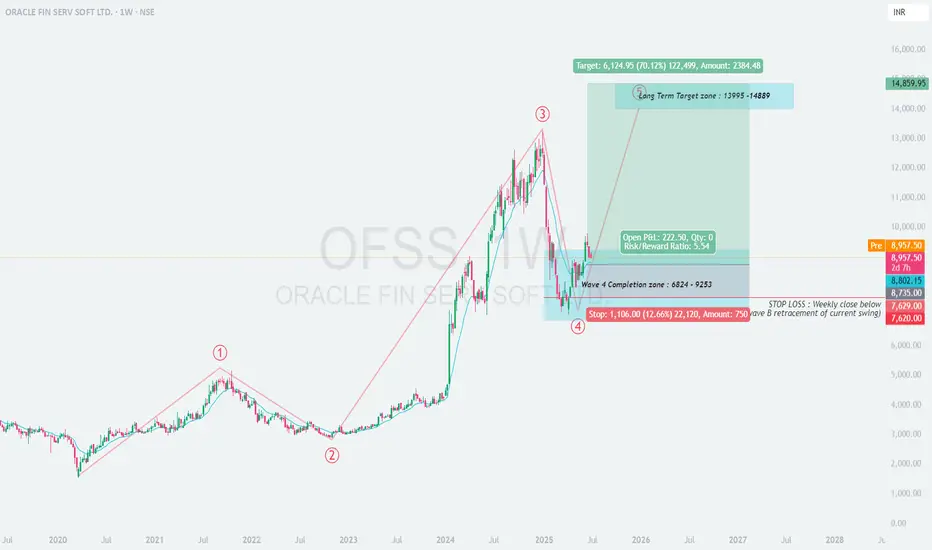
The chart shows a classic impulsive 5-wave Elliott structure.
Currently, Wave 4 seems to have completed in the zone of ₹6824–₹9253.
The current price action indicates the beginning of Wave 5, targeting significant upside.
🟦 Wave 4 Completion Zone: ₹6824–₹9253
Strong buying interest observed in this zone.
Multiple bullish candles from the support band indicate trend resumption.
Wave structure suggests upside momentum may now pick up.
🟩 Long-Term Target Zone: ₹13,995 – ₹14,889
Based on the projected Wave 5 extension, the upside potential is nearly +70% from current levels.
Ideal for long-term investors and positional traders.
📝 Trade Setup
✅ Entry:
Current Market Price (CMP) ~ ₹8,957
🎯 Targets:
T1: ₹13,995
T2: ₹14,889
❌ Stop Loss:
Weekly close below ₹7,629 (Wave B retracement & structure invalidation)
📈 Risk-Reward Ratio: ~5.54
🔒 Risk per share: ₹1,106
🚀 Potential Gain per share: ₹6,124
🧠 Trade Logic
Strong Elliott wave structure favors Wave 5 continuation.
Risk is well-defined and acceptable for the expected return.
Ideal case of “buying into the start of an impulsive wave”.
📌 Summary:
OFSS has completed its Wave 4 corrective phase and is now positioned for a strong Wave 5 rally. Long-term investors may consider accumulating near current levels for a target of ₹14,800+, maintaining a strict SL below ₹7,620 on a weekly close basis.
🌀 Elliott Wave Count
The chart shows a classic impulsive 5-wave Elliott structure.
Currently, Wave 4 seems to have completed in the zone of ₹6824–₹9253.
The current price action indicates the beginning of Wave 5, targeting significant upside.
🟦 Wave 4 Completion Zone: ₹6824–₹9253
Strong buying interest observed in this zone.
Multiple bullish candles from the support band indicate trend resumption.
Wave structure suggests upside momentum may now pick up.
🟩 Long-Term Target Zone: ₹13,995 – ₹14,889
Based on the projected Wave 5 extension, the upside potential is nearly +70% from current levels.
Ideal for long-term investors and positional traders.
📝 Trade Setup
✅ Entry:
Current Market Price (CMP) ~ ₹8,957
🎯 Targets:
T1: ₹13,995
T2: ₹14,889
❌ Stop Loss:
Weekly close below ₹7,629 (Wave B retracement & structure invalidation)
📈 Risk-Reward Ratio: ~5.54
🔒 Risk per share: ₹1,106
🚀 Potential Gain per share: ₹6,124
🧠 Trade Logic
Strong Elliott wave structure favors Wave 5 continuation.
Risk is well-defined and acceptable for the expected return.
Ideal case of “buying into the start of an impulsive wave”.
📌 Summary:
OFSS has completed its Wave 4 corrective phase and is now positioned for a strong Wave 5 rally. Long-term investors may consider accumulating near current levels for a target of ₹14,800+, maintaining a strict SL below ₹7,620 on a weekly close basis.
Disclaimer
The information and publications are not meant to be, and do not constitute, financial, investment, trading, or other types of advice or recommendations supplied or endorsed by TradingView. Read more in the Terms of Use.
Disclaimer
The information and publications are not meant to be, and do not constitute, financial, investment, trading, or other types of advice or recommendations supplied or endorsed by TradingView. Read more in the Terms of Use.