Symbol - ONDOUSDT
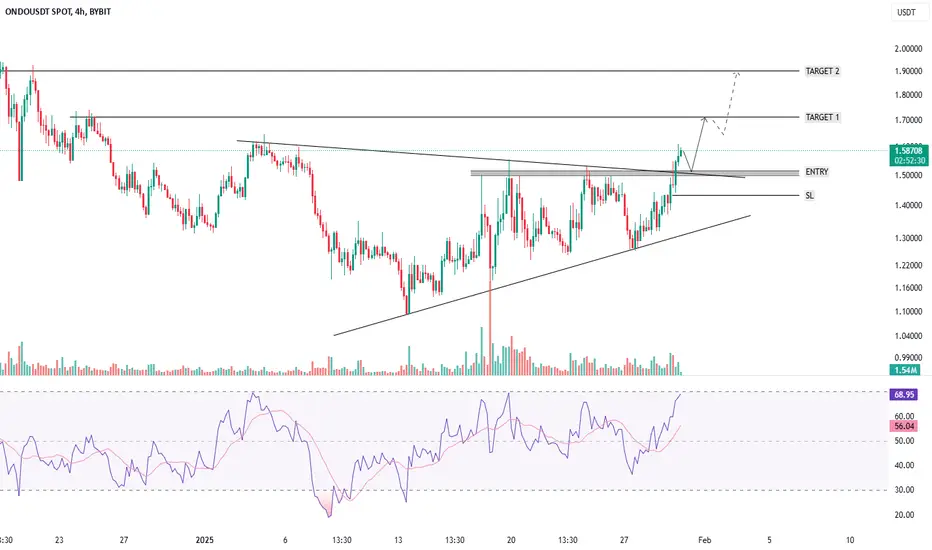
ONDOUSDT continues to demonstrate an upward trend, with periodic cyclical counter-trend corrections. The chart is currently indicating a potential conclusion of the correction phase, suggesting a readiness for further upward movement. A significant consolidation pattern has developed within the context of the prevailing uptrend. In this regard, the price is attempting to break above the consolidation resistance (triangle) and surpass the next key resistance level at 1.538. This level is of particular importance. Should the bulls successfully maintain support above 1.538, ONDO may experience a recovery towards the 1.7–1.9–2.15 range in the short to medium term.
Support levels: 1.538, 1.44
Resistance levels: 1.7344, 1.90
A minor pullback to support, followed by a false breakdown, remains a possibility. However, sustained price consolidation above this level would confirm readiness for upward movement. Entry, SL & Target levels are indicated on the chart.
Trade active
CMP 1.5460The support level is being retested. This presents an opportunity to consider entering long positions at this point.
Note
CMP 1.4700Adding more here. Avg Buy price now is 1.5080
Holding with SL 1.4300
Trade closed: stop reached
SL touched, Trade closed.It can still recover from current levels after liquidity capture. In that case, I will think to enter again after monitoring price action closely.
Trading isn’t a gamble. When skill meets discipline - profit becomes the natural outcome.
Join me, I'll guide you to PROFITABLE TRADING.
Connect with me directly on WhatsApp: +91-9915885530
Join my free Telegram group: t.me/akshit_official
Join me, I'll guide you to PROFITABLE TRADING.
Connect with me directly on WhatsApp: +91-9915885530
Join my free Telegram group: t.me/akshit_official
Disclaimer
The information and publications are not meant to be, and do not constitute, financial, investment, trading, or other types of advice or recommendations supplied or endorsed by TradingView. Read more in the Terms of Use.