Pyramid Technoplast Ltd – Falling Trendline Breakout! 💥
📅 Date: April 8, 2025
📊 Chart Analysis:
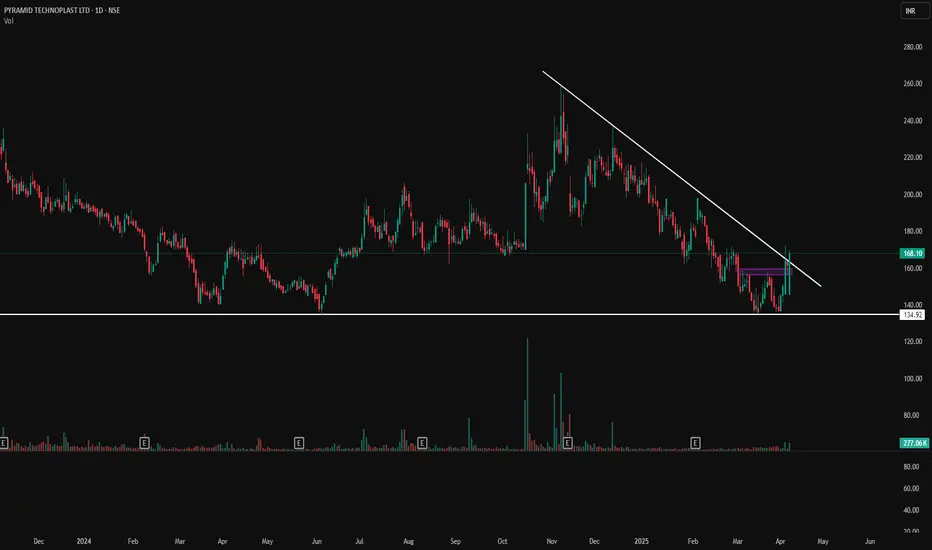
The stock has successfully broken out of a long-term falling trendline, indicating a potential reversal of the previous downtrend. This move is backed by strong bullish candles and an increase in volume.
📌 Key Levels:
📉 Major Support: ₹134.92
🔄 Previous Resistance/Flip Zone: ₹160-165 (now acting as support)
📈 Immediate Resistance Levels: ₹180, ₹195, ₹210
📈 Technical Indicators & Patterns:
Falling Trendline Breakout visible with strong bullish momentum.
Volume confirmation indicates institutional interest.
Price closing above ₹165 can lead to further upside.
🔍 Volume Insight:
Volume surged to 277K, which is significantly higher than the average, adding credibility to the breakout.
🚀 Potential Setup:
If price holds above ₹165–₹168, next targets could be ₹180 and ₹195.
Pullback toward ₹160–₹165 zone can be seen as a retest and buying opportunity.
📌 Disclaimer: This is for educational and analysis purposes only. Always consult your financial advisor before making investment decisions.
📅 Date: April 8, 2025
📊 Chart Analysis:
The stock has successfully broken out of a long-term falling trendline, indicating a potential reversal of the previous downtrend. This move is backed by strong bullish candles and an increase in volume.
📌 Key Levels:
📉 Major Support: ₹134.92
🔄 Previous Resistance/Flip Zone: ₹160-165 (now acting as support)
📈 Immediate Resistance Levels: ₹180, ₹195, ₹210
📈 Technical Indicators & Patterns:
Falling Trendline Breakout visible with strong bullish momentum.
Volume confirmation indicates institutional interest.
Price closing above ₹165 can lead to further upside.
🔍 Volume Insight:
Volume surged to 277K, which is significantly higher than the average, adding credibility to the breakout.
🚀 Potential Setup:
If price holds above ₹165–₹168, next targets could be ₹180 and ₹195.
Pullback toward ₹160–₹165 zone can be seen as a retest and buying opportunity.
📌 Disclaimer: This is for educational and analysis purposes only. Always consult your financial advisor before making investment decisions.
Disclaimer
The information and publications are not meant to be, and do not constitute, financial, investment, trading, or other types of advice or recommendations supplied or endorsed by TradingView. Read more in the Terms of Use.
Disclaimer
The information and publications are not meant to be, and do not constitute, financial, investment, trading, or other types of advice or recommendations supplied or endorsed by TradingView. Read more in the Terms of Use.