Projection Based on Wyckoff Cycle:
1. If the price breaks above the resistance level of 1584:
Bullish Scenario:
2. If the price fails to break the resistance at 1584 and pulls back:
Consolidation or Downward Scenario:
3. Testing the Support Zone (1374-1400):
Bullish Reversal:
4. Spring Action Near Support:
Projections
Bullish Case:
Bearish Case:
Actionable Steps:
1. If the price breaks above the resistance level of 1584:
Bullish Scenario:
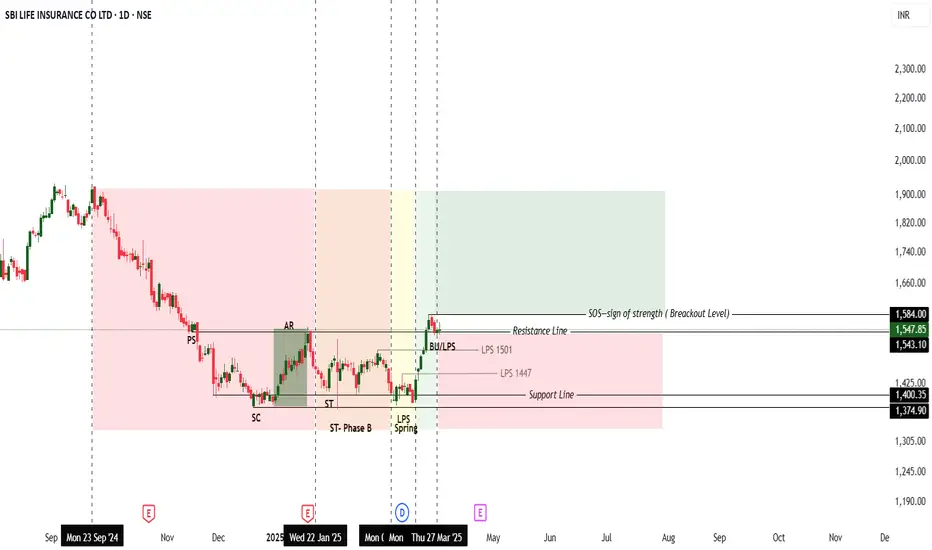
- A breakout above 1584 would signify a Sign of Strength (SOS), meaning that the market sentiment has shifted towards the buyers (demand overcoming supply).
- The upside target could be 1720-1863 based on the next logical resistance zone, considering the overall market conditions and the Wyckoff method. If the breakout is accompanied by strong volume, it could signal a sustained rally, potentially leading to new highs.
2. If the price fails to break the resistance at 1584 and pulls back:
Consolidation or Downward Scenario:
- If the price does not manage to break above 1584 and starts to pull back, the stock could enter a range-bound phase (consolidation) between 1374-1584.
- The price would then likely retrace towards the support zone around 1374-1400, forming a higher low (assuming it doesn’t break down through support). If the support zone holds, another rally could take place.
- Bearish Scenario: A break below 1374 would signal a possible downtrend or a deeper retracement, and the next support target would likely be near 1325.
3. Testing the Support Zone (1374-1400):
Bullish Reversal:
- If the stock retraces to the 1374-1400 support zone and shows signs of reversal (a higher low), it could be a sign of accumulation and suggest that the market participants are absorbing the sell-off. This would offer a good opportunity to buy for the next leg up.
- Watch for price action around this support level to see if buying pressure increases or if the support holds. If the support holds and a rally starts, the stock could rise toward 1500-1530 and potentially break higher.
4. Spring Action Near Support:
- If the stock dips below 1374 briefly (a Spring), it might create a false breakdown and then quickly reverse upwards. This action is common in Wyckoff theory to shake out weaker hands before a strong recovery. If this occurs, it could indicate a bullish reversal, with an immediate target of 1450 and potential for 1584 if the breakout occurs.
Projections
Bullish Case:
- Price breaks 1584 resistance → Target: 1720-1863.
- Price tests 1374-1400 support and rebounds → Target: 1530-1584.
- Sign of Strength (SOS) above resistance → New highs may follow.
Bearish Case:
- Price fails to break above 1584 and starts pulling back → Range-bound between 1374-1584 or a deeper correction.
- Break below 1374 support → Further downside towards 1325.
Actionable Steps:
- Watch for Breakout Confirmation: Look for confirmation of a breakout above 1584 for an upward trend or signs of price action at 1374-1400 for a potential reversal.
- Stop Loss: If you are long from lower levels, consider placing a stop loss below the support zone at 1370 to manage risk.
- Entry Point: Buying can be considered near the 1374-1400 zone (if support holds) or above 1584 (breakout confirmation).
Disclaimer:
The information provided is for educational purposes only and does not constitute financial or investment advice. Trading and investing carry significant risks, and past performance is not indicative of future results. Always conduct your own research and consult with a licensed financial advisor before making any investment decisions. The author assumes no responsibility for any losses or damages resulting from the use of this information.
Disclaimer
The information and publications are not meant to be, and do not constitute, financial, investment, trading, or other types of advice or recommendations supplied or endorsed by TradingView. Read more in the Terms of Use.
Disclaimer
The information and publications are not meant to be, and do not constitute, financial, investment, trading, or other types of advice or recommendations supplied or endorsed by TradingView. Read more in the Terms of Use.