I've been tracking SHARDACROP, and what I'm seeing is honestly one of those setups that doesn't come around too often. There's something brewing here that caught my attention—and it's not just one signal, but two completely different analytical approaches pointing to the exact same conclusion.
Today, I'm breaking down this chart using the modern supply & demand approach that tracks institutional footprints, and the classic technical analysis. When these two methodologies start singing the same tune? That's when you know it's time to pay attention.
What makes this SHARDACROP setup special? Both methods are screaming the same message. And in my experience, that's usually when the big moves happen.
💡 Supply & Demand Analysis - Reading the Smart Money Trail 💡
Let's start with the supply and demand zones. Think of these as crime scenes—they're where the big players left their fingerprints. These aren't random levels; they're areas where massive institutional orders are sitting, waiting to be filled.
🎯 How the Big Players Play 🎯
Here's what most retail traders don't get: when institutions want to buy or sell millions of dollars worth of stock, they can't just hit the market buy button like we do. They'd move the price against themselves instantly. Instead, they layer in orders over time, creating these demand and supply zones.
So when price comes back to test a demand zone, we're betting that the same smart money players who were buying there before still have unfilled orders waiting. It's like they've set a trap—and price is walking right into it.
🔥 What Jumped Out at Me with SHARDACROP 🔥
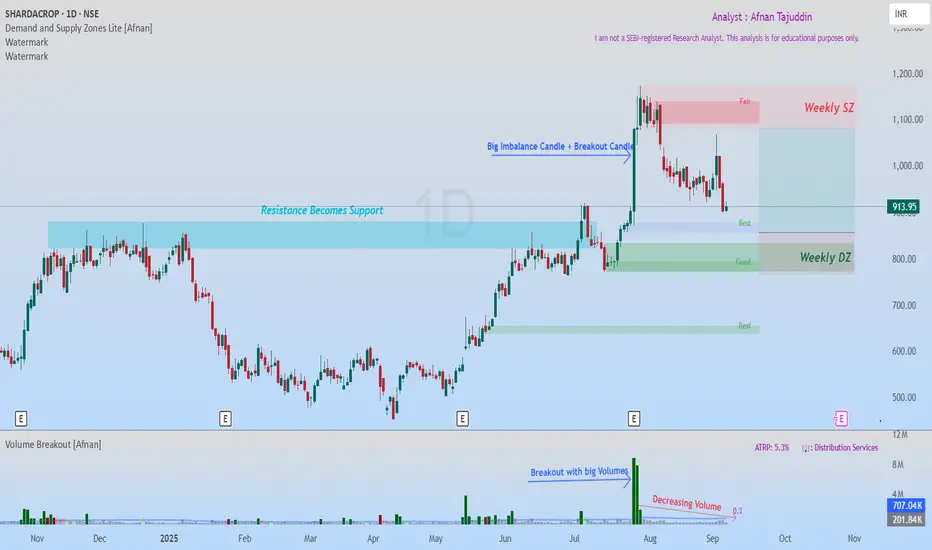
- Solid Weekly Foundation: There's a weekly demand zone that's been acting like a fortress
- Stacked Daily Zones: Inside that weekly zone, we've got 1 daily demand zone and another demand zone is latest layered on top of each other.
- Leg-out Candle Signature: That leg-out candle? Breaking to new highs, Pure smart money. The size of that imbalance tells me this wasn't retail traders getting excited
📈 The Setup That's Unfolding 📈
Now here's where it gets interesting. Price is drifting back toward our demand zone, and everything's lining up perfectly:- Entry Sweet Spot: Right within that established demand zone
- Clean Risk Level: Stop goes below the zone—simple
- Clear Target Path: Measured move up to the next supply zone
What I love about this risk-reward setup is the clean path to our 1:2.5 target. There's no major supply zone standing in our way, and the weekly trend is up.
⚡ Traditional Technical Analysis ⚡
Now let's flip the script and look at this through classic technical analysis. And you know what? The story gets even better.
🏗️ The Resistance That Finally Cracked 🏗️
This chart's telling a story I've seen a thousand times, but it never gets old:- The Struggle Phase: Price kept banging its head against the same resistance level, over and over
- The Explosion: When it finally broke, it didn't just break—it demolished that level with a massive candle and huge volume
- Volume Don't Lie: That breakout volume spike? That's confirmation the move was real
- The Polarity Play: Now that old resistance is getting ready to flip into support—textbook price action
📊 Volume Tells the Real Story 📊
What really caught my eye is how volume's behaving on this pullback. As price drifts down toward our support zone, volume's drying up. That's not weakness—that's actually bullish. It means the selling pressure is fading, and when volume contracts like this during a retest, it often sets the stage for the next leg higher.
🎯 When Two Worlds Collide - The Confluence Magic 🎯
Here's where things get really exciting. I'm not just seeing one good setup—I'm seeing two completely different analytical methods pointing to the exact same opportunity:- Supply & Demand Says: Smart money demand zone with layered institutional support
- Technical Analysis Says: Classic breakout retest with polarity support and volume confirmation
- The Bottom Line: Both methods identify the same zone as the high-probability entry point
When this happens, I call it a "confluence setup." It's like having two different GPS systems both telling you to take the same route—you can be pretty confident you're heading in the right direction.
🌟 Putting It All Together 🌟
SHARDACROP's showing me: institutional footprints perfectly aligned with classic technical patterns. The Multiple Timeframe demand zones, the breakout retest setup, the volume behavior—it's all coming together in a way that makes me sit up and take notice.
But remember, even the best setups can fail. The market doesn't owe us anything, and it certainly doesn't care how confident we are. Trade smart, manage risk, and let the probabilities work in your favor over time.
💪 "The best traders aren't the ones who are right the most—they're the ones who make the most when they're right and lose the least when they're wrong." 📈
Disclaimer: This analysis is purely for educational purposes and isn't meant as trading or investment advice. I'm not a SEBI registered analyst. Always consult with qualified financial advisors before making investment decisions. - Entry Sweet Spot: Right within that established demand zone
Access the powerful Demand and Supply Zone Pro indicator at:
marketup2date.com
Stay updated on Telegram:
t.me/MarketUp2Date
Join our WhatsApp channel:
whatsapp.com/channel/0029Va6ByyH0LKZCc4Az4x0u
marketup2date.com
Stay updated on Telegram:
t.me/MarketUp2Date
Join our WhatsApp channel:
whatsapp.com/channel/0029Va6ByyH0LKZCc4Az4x0u
Related publications
Disclaimer
The information and publications are not meant to be, and do not constitute, financial, investment, trading, or other types of advice or recommendations supplied or endorsed by TradingView. Read more in the Terms of Use.