Solana appears to be in the final leg of a complex corrective structure. According to the current Elliott Wave count, the larger cycle degree is unfolding in a downward wave c, while the primary degree is in an upward wave B, subdividing into intermediate wave C, which itself is in minor wave C—now developing.
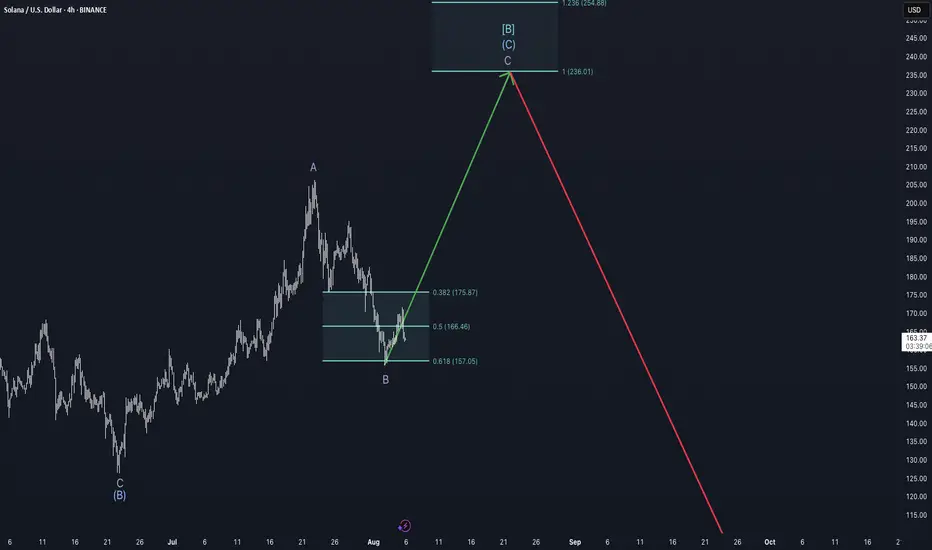
The corrective decline from the July high has retraced toward the 0.618 Fibonacci retracement level (~$157) of the prior move, marking a typical zone for the end of Wave B within a flat or zig-zag formation. From this low, Solana has begun to push higher, indicating the likely beginning of Wave C to the upside. Based on Fibonacci extensions, the potential target zone for this move lies between $236 (1.0 extension) and $254 (1.236 extension).
From a market structure perspective, funding rates across major perpetual futures markets for SOL remain slightly negative or neutral, indicating that the majority of traders are not aggressively long at this stage. This often provides a more stable environment for an upward move, as it suggests the absence of overcrowded long positions that could lead to sharp liquidations. For reference, data from Velo (as of August 5) shows funding on Binance SOLUSDT Perpetual at 6.07%, confirming this neutral-to-slightly-bearish bias in funding.
Additionally, open interest has been neutral since the local low around $157. This is visible on futures data platforms such as Velo.xyz.
However, the liquidity heatmap does not currently support a strong magnet effect toward the $236–$254 zone. There is no significant cluster of stop liquidity or resting orders above $230 that would attract price purely through liquidation mechanics. In contrast, notable liquidity still resides below current levels, making the setup more technically driven than structurally supported by liquidity.
Given these conditions, the case for a C-wave rally remains technically intact, but traders should be cautious: the absence of upper-side liquidity and the corrective macro context imply that this move, even if successful, is likely a countertrend rally within a broader bearish cycle structure.
In conclusion, as long as price holds above the $157–$166 support zone and maintains impulsive structure on lower timeframes, the outlook remains short- to mid-term bullish toward the $236–$254 area. Yet, any breakdown below $157 would invalidate this wave count and suggest that Cycle Wave c may already be resuming to the downside.
Note
The current pump we see is crucial for further evaluation. If we carry on impulsive momentum, the chances for the bullish scenario rise.Note
I saw that the sideways structure before the pump comes with a lot of volume, suggesting a bullish orderblock and institutionals buying in. This supports my thesis, because a drop below this orderblock at $161-164 is unlikely.Note
NOTE TO ALL OF MY ANALYSES:You might be wondering why prices are expected to rise — especially considering that Wave 3 is typically the most dynamic phase in an impulsive structure. One of the main reasons lies in macroeconomic conditions: for a long time, capital inflow into crypto has been limited due to the Federal Reserve (Fed) maintaining high interest rates. However, this could change at the upcoming FOMC meeting in September.
According to the CME Group’s FedWatch Tool, there is currently a 93.6% probability of a rate cut being priced in. This expectation could lead to a classic "sell-the-news" event, as markets front-run the decision. That front-running could provide fuel for Wave 3 — especially from retail participants.
Why retail?
Because institutional players have already entered. We’ve seen them form significant order blocks near the end of Wave 2, which indicates professional accumulation during peak uncertainty. This structural evidence supports the idea that the smart money is already positioned — leaving retail to push the next leg.
Have a great week & stay consistent.
Disclaimer
The information and publications are not meant to be, and do not constitute, financial, investment, trading, or other types of advice or recommendations supplied or endorsed by TradingView. Read more in the Terms of Use.
Disclaimer
The information and publications are not meant to be, and do not constitute, financial, investment, trading, or other types of advice or recommendations supplied or endorsed by TradingView. Read more in the Terms of Use.