Technical Analysis of SPX500
▪SPX500 Price Action Overview
▫Current Trend:
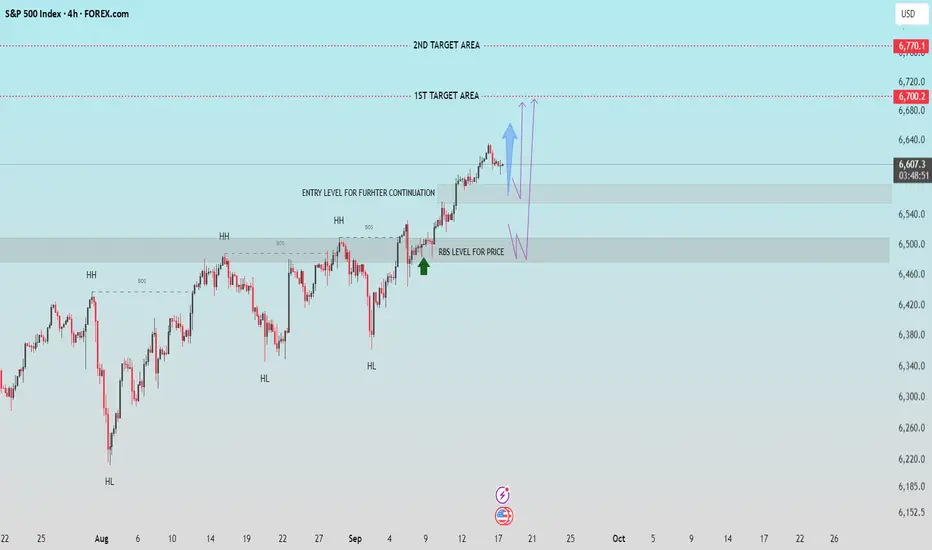
The S&P 500 index is currently showing a bullish trend as higher highs (HH) are being formed along with a series of breakouts and bullish structure (e.g., BOS – Break of Structure).
▪Price Target Areas:
▫1st Target Area:
The immediate resistance zone is marked at around 6,700. A break and close above this level could suggest continuation towards the second target.
▫2nd Target Area:
The next major resistance lies at 6,770, where further upward movement could face significant obstacles.
▪ Entry Point and Continuation
▫Entry Level:
The ideal entry point is near the green "RBS Level for Price," which serves as a potential reversal support zone where the price might find support to continue upward.
▫ Price Action:
The market is exhibiting an uptrend with the formation of higher lows (HL), suggesting that buying pressure is likely to continue as long as the price holds above the RBS level.
▪ Key Levels to Watch
▫ Support Zone:
The level near 6,500 acts as the key support zone. A breach below this area could shift the bias to the downside.
▫ Resistance:
Keep an eye on the resistance zones at 6,700 and 6,770 for potential reversal points if the price fails to break through them.
▪ Conclusion
The market is currently in a bullish phase, with the potential for higher targets. Traders should look for retracements to the RBS level for entry and monitor resistance areas at 6,700 and 6,770 for possible price stalls or reversals.
If this helpful for you, press the like button.
▪SPX500 Price Action Overview
▫Current Trend:
The S&P 500 index is currently showing a bullish trend as higher highs (HH) are being formed along with a series of breakouts and bullish structure (e.g., BOS – Break of Structure).
▪Price Target Areas:
▫1st Target Area:
The immediate resistance zone is marked at around 6,700. A break and close above this level could suggest continuation towards the second target.
▫2nd Target Area:
The next major resistance lies at 6,770, where further upward movement could face significant obstacles.
▪ Entry Point and Continuation
▫Entry Level:
The ideal entry point is near the green "RBS Level for Price," which serves as a potential reversal support zone where the price might find support to continue upward.
▫ Price Action:
The market is exhibiting an uptrend with the formation of higher lows (HL), suggesting that buying pressure is likely to continue as long as the price holds above the RBS level.
▪ Key Levels to Watch
▫ Support Zone:
The level near 6,500 acts as the key support zone. A breach below this area could shift the bias to the downside.
▫ Resistance:
Keep an eye on the resistance zones at 6,700 and 6,770 for potential reversal points if the price fails to break through them.
▪ Conclusion
The market is currently in a bullish phase, with the potential for higher targets. Traders should look for retracements to the RBS level for entry and monitor resistance areas at 6,700 and 6,770 for possible price stalls or reversals.
If this helpful for you, press the like button.
Trade active
Note
1st target achieved, Trade closed: target reached
💸FREE FOREX Signals in Telegram : t.me/FxInsightsHub0
🔹Join Our Telegram Channel, Pure Price Action Based Signals With Chart Analysis.
t.me/FxInsightsHub0
🚀FREE CRYPTO Signals In Telegram: t.me/FxInsightsHub0
🔹Join Our Telegram Channel, Pure Price Action Based Signals With Chart Analysis.
t.me/FxInsightsHub0
🚀FREE CRYPTO Signals In Telegram: t.me/FxInsightsHub0
Related publications
Disclaimer
The information and publications are not meant to be, and do not constitute, financial, investment, trading, or other types of advice or recommendations supplied or endorsed by TradingView. Read more in the Terms of Use.