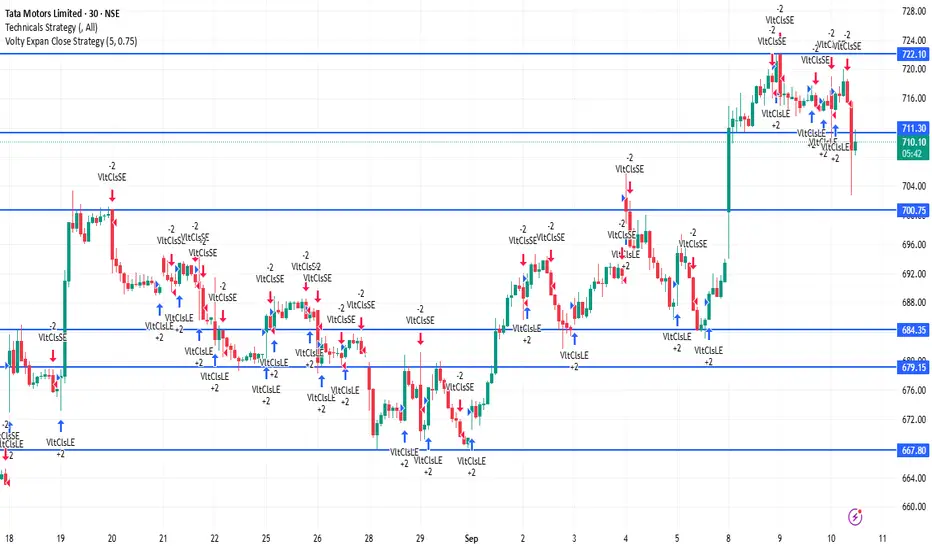
📊 Tata Motors – 30M Technical Levels
🔹 Support Zones
₹708 – ₹710 → Immediate intraday support
₹705 – ₹707 → Strong support zone
₹702 – ₹704 → Critical support; breakdown here can lead to further weakness
🔹 Resistance Zones
₹720 – ₹722 → First major resistance
₹724 – ₹726 → Strong supply zone
₹728 – ₹730 → Intraday breakout level; above this, momentum may pick up strongly
📈 30M Trend Outlook
Stock is sideways to mildly bullish on the 30-min chart.
Above ₹722 → Buyers gain control; possible upside to ₹726–₹730.
Below ₹708 → Weakness likely; price may slip to ₹705–₹702.
As long as it stays above ₹710, bias remains positive in the short term.
Disclaimer
The information and publications are not meant to be, and do not constitute, financial, investment, trading, or other types of advice or recommendations supplied or endorsed by TradingView. Read more in the Terms of Use.
Disclaimer
The information and publications are not meant to be, and do not constitute, financial, investment, trading, or other types of advice or recommendations supplied or endorsed by TradingView. Read more in the Terms of Use.