📊Technical Overview
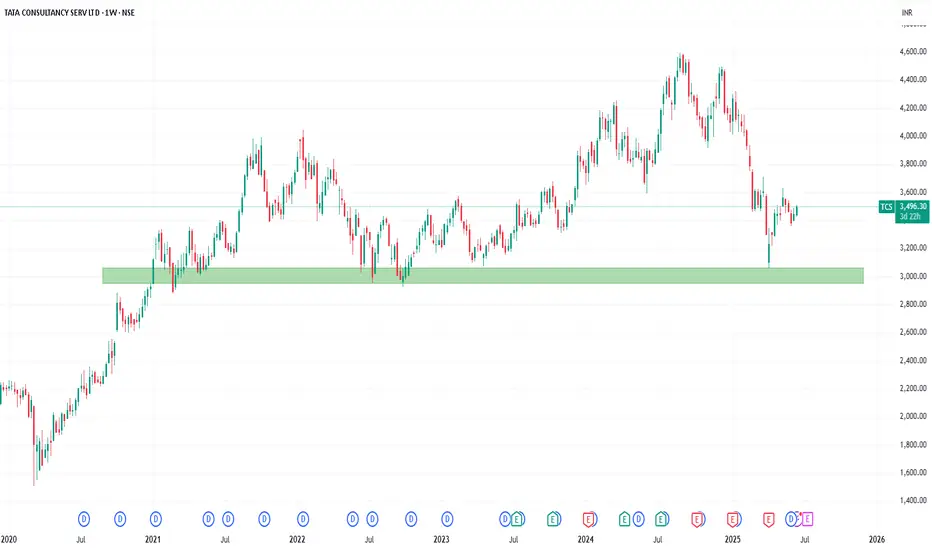
TCS has consistently traded above ₹3,000 since 2021, with this level serving repeatedly as a robust support zone.
The stock reached an all-time high of ₹4,592 in August 2024.
Given strong year-on-year financial performance and support at ₹3,000, TCS currently trades at ₹3,500.
As long as the ₹2,900–₹3,050 support zone holds, the stock has potential to rise to:
🎯Target 1: ₹3,800
🎯Target 2: ₹4,200
🎯Target 3: ₹4,600(All-time high)
A breakdown below the zone would negate the bullish thesis.
💰FY24 Key Financial Highlights (vs FY23 & FY22)
🧠Fundamental Insights
TCS crossed $30 bn in annual revenue, with a strong order book of $42.7 bn, including a record Q4 TCV of $13.2 bn
FY24 revenue rose 4.1% YoY (CC +3.4%), with net income up 7.8% YoY. Q4 margins were strong with operating at 24.6% and net at 19.3%
TCS declared a ₹30 final dividend and a combined FY25 dividend of ₹96/share (₹66 special + ₹30 final), rewarding shareholders with ~4.5% yield
Quarterly profit slipped 1.7% YoY to ₹12,224 Cr due to global headwinds, but revenue still rose 5.3%, backed by strong deal wins worth $12.2 bn (Q4) and $39.4 bn (full year) .
Continued investment in AI, digital innovation, and a strong cash flow (over $5.3 bn free cash flow in FY24) support long-term growth outlook .
🧭Conclusion
TCS remains fundamentally strong with robust growth in revenues, profits, and cash generation. Technically, it is maintaining a firm base above ₹3,000, setting the stage for a potential upside toward ₹3,800 → ₹4,200 → ₹4,600. The key is to watch for sustained support at ₹3,000–₹3,050.
⚠️Disclaimer
This report is for educational purposes only and does not constitute investment advice. Please consult a financial advisor before making any investment decisions.
TCS has consistently traded above ₹3,000 since 2021, with this level serving repeatedly as a robust support zone.
The stock reached an all-time high of ₹4,592 in August 2024.
Given strong year-on-year financial performance and support at ₹3,000, TCS currently trades at ₹3,500.
As long as the ₹2,900–₹3,050 support zone holds, the stock has potential to rise to:
🎯Target 1: ₹3,800
🎯Target 2: ₹4,200
🎯Target 3: ₹4,600(All-time high)
A breakdown below the zone would negate the bullish thesis.
💰FY24 Key Financial Highlights (vs FY23 & FY22)
- Total Income: ₹255,324 Cr (vs ₹240,893 Cr; ₹225,458 Cr)
- Total Expenses: ₹187,917 Cr (vs ₹176,597 Cr; ₹166,199 Cr)
- Financing Profit: ₹67,407 Cr (vs ₹64,296 Cr; ₹59,259 Cr)
- Profit Before Tax: ₹65,331 Cr (vs ₹61,997 Cr; ₹56,907 Cr)
- Profit After Tax: ₹48,797 Cr (vs ₹46,099 Cr; ₹42,303 Cr)
- Diluted Normalized EPS: ₹134.20 (vs ₹126.88; ₹115.19)
🧠Fundamental Insights
TCS crossed $30 bn in annual revenue, with a strong order book of $42.7 bn, including a record Q4 TCV of $13.2 bn
FY24 revenue rose 4.1% YoY (CC +3.4%), with net income up 7.8% YoY. Q4 margins were strong with operating at 24.6% and net at 19.3%
TCS declared a ₹30 final dividend and a combined FY25 dividend of ₹96/share (₹66 special + ₹30 final), rewarding shareholders with ~4.5% yield
Quarterly profit slipped 1.7% YoY to ₹12,224 Cr due to global headwinds, but revenue still rose 5.3%, backed by strong deal wins worth $12.2 bn (Q4) and $39.4 bn (full year) .
Continued investment in AI, digital innovation, and a strong cash flow (over $5.3 bn free cash flow in FY24) support long-term growth outlook .
🧭Conclusion
TCS remains fundamentally strong with robust growth in revenues, profits, and cash generation. Technically, it is maintaining a firm base above ₹3,000, setting the stage for a potential upside toward ₹3,800 → ₹4,200 → ₹4,600. The key is to watch for sustained support at ₹3,000–₹3,050.
⚠️Disclaimer
This report is for educational purposes only and does not constitute investment advice. Please consult a financial advisor before making any investment decisions.
Disclaimer
The information and publications are not meant to be, and do not constitute, financial, investment, trading, or other types of advice or recommendations supplied or endorsed by TradingView. Read more in the Terms of Use.
Disclaimer
The information and publications are not meant to be, and do not constitute, financial, investment, trading, or other types of advice or recommendations supplied or endorsed by TradingView. Read more in the Terms of Use.