WTI Oil (USOIL) hit both our 79.00 and 75.00 targets on the H&S sell call we made (see chart below) on October 30:

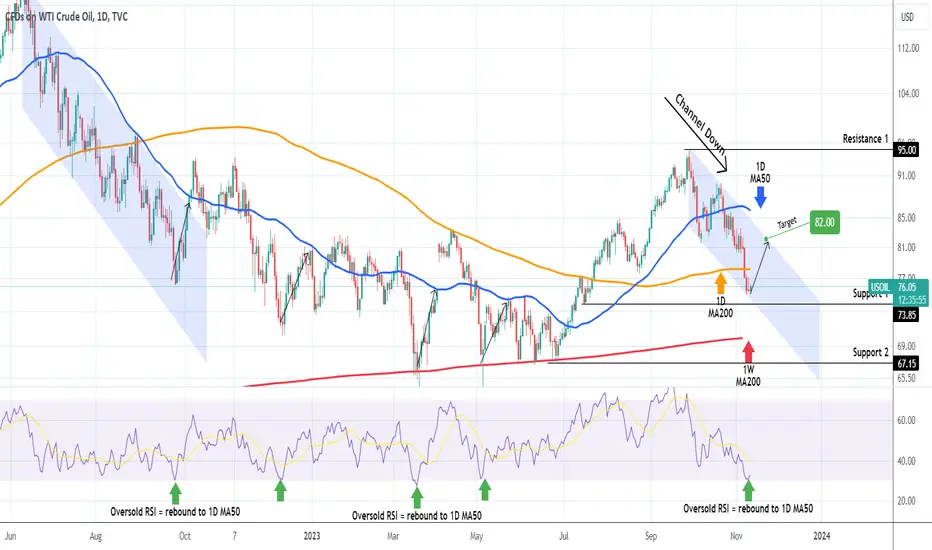
The trend on the 1D time-frame evolved into a Channel Down that broke below the 1D MA200 (orange trend-line) but hit on Wednesday it's bottom (Lower Lows trend-line) and is so far holding. As the 1D RSI touched the 30.00 oversold barrier, we have a strong buy signal emerging as every time in the last 2 years the 1D RSI got oversold, Oil always rebounded to reach the 1D MA50 (blue trend-line) at least.
The 1D MA50 has been the Resistance since October 24 and as Support 1 (73.85) is very close, we turn bullish again after a long time to target the top of the Channel Down at 82.00.
Notice that this correction got closer to the 1W MA200 (red trend-line) which is the ultimate long-term Support and the one that held on 5 different times from mid March to June (closed all 1W candles above it and eventually led to September's High).
-------------------------------------------------------------------------------
** Please LIKE 👍, FOLLOW ✅, SHARE 🙌 and COMMENT ✍ if you enjoy this idea! Also share your ideas and charts in the comments section below! This is best way to keep it relevant, support us, keep the content here free and allow the idea to reach as many people as possible. **
-------------------------------------------------------------------------------
💸💸💸💸💸💸
👇 👇 👇 👇 👇 👇
👑Best Signals (Forex/Crypto+70% accuracy) & Account Management (+20% profit/month on 10k accounts)
💰Free Channel t.me/tradingshotglobal
🤵Contact info@tradingshot.com t.me/tradingshot
🔥New service: next X100 crypto GEMS!
💰Free Channel t.me/tradingshotglobal
🤵Contact info@tradingshot.com t.me/tradingshot
🔥New service: next X100 crypto GEMS!
Disclaimer
The information and publications are not meant to be, and do not constitute, financial, investment, trading, or other types of advice or recommendations supplied or endorsed by TradingView. Read more in the Terms of Use.