1. Current Context
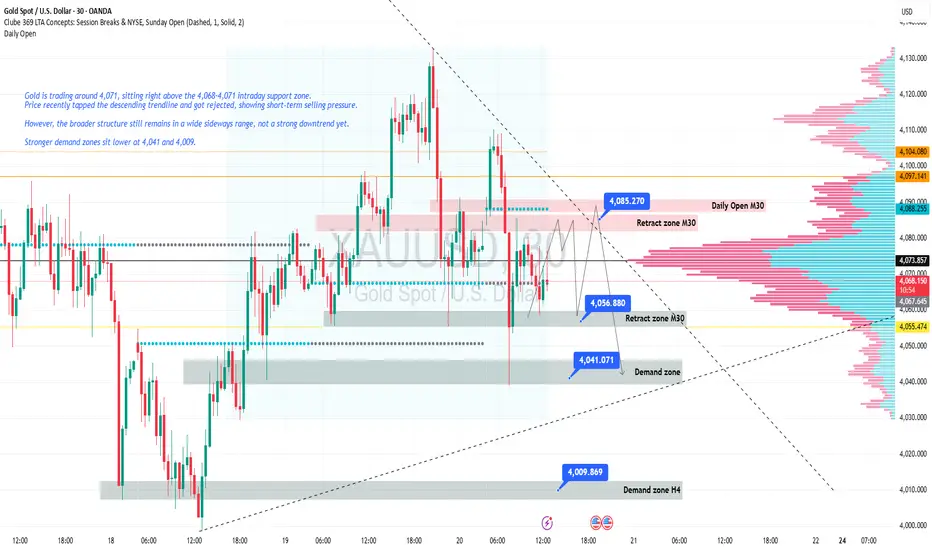
Gold is trading around 4,071, sitting right above the 4,068–4,071 intraday support zone.
Price recently tapped the descending trendline and got rejected, showing short-term selling pressure.
However, the broader structure still remains in a wide sideways range, not a strong downtrend yet.
Stronger demand zones sit lower at 4,041 and 4,009.
⸻
2. Price Action at 4,071
Currently gold is:
• Retesting 4,068–4,071 support
• Showing lower wicks → light buying pressure
• Still trading below M30/H1 downtrend line
This suggests the probability of sideways movement – accumulation – or a small bullish retest is high.
📌 If 4,068 breaks → price may head to 4,056 and then 4,041
📌 If 4,071 holds → price may bounce toward 4,077–4,080, possibly 4,085
⸻
3. Conclusion (Real-Time)
👉 No BUY yet – wait for confirmation at 4,071
👉 No SELL yet – only sell if price closes below 4,068
👉 Low volatility – prioritize safety
You can get more: t.me/+KIPbdagxkYUyMWQ1
Related publications
Disclaimer
The information and publications are not meant to be, and do not constitute, financial, investment, trading, or other types of advice or recommendations supplied or endorsed by TradingView. Read more in the Terms of Use.
You can get more: t.me/+KIPbdagxkYUyMWQ1
Related publications
Disclaimer
The information and publications are not meant to be, and do not constitute, financial, investment, trading, or other types of advice or recommendations supplied or endorsed by TradingView. Read more in the Terms of Use.