🔍 Key Observations:
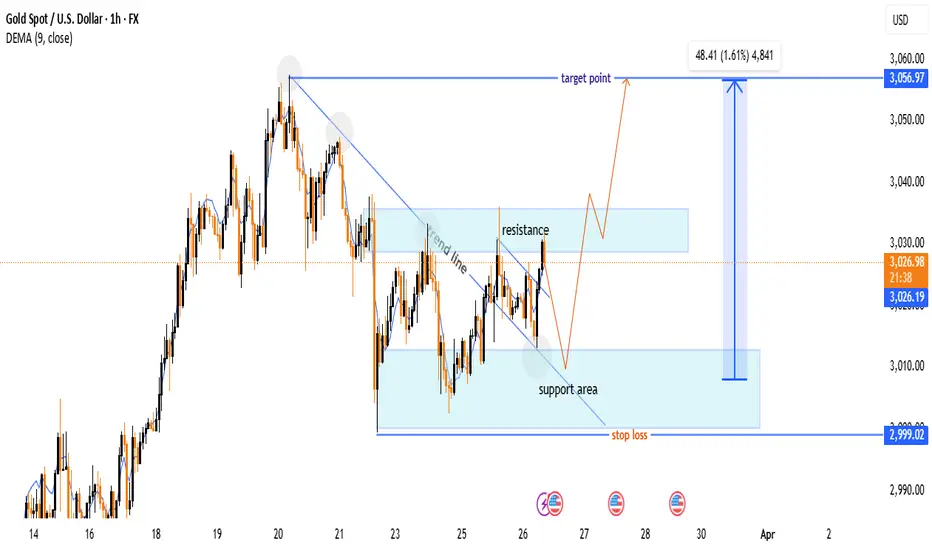
🔹 Trend Line Breakout:
📉⬇️ A downward trend line was broken, signaling a potential bullish reversal.
📈✅ The price has moved above the trend line, confirming the breakout.
🔹 Support & Resistance Zones:
🟦 Support Area: $3,000 - $3,010 (Buy Zone)
🟥 Resistance Area: $3,030 - $3,040 (Sell Pressure)
📊 Trade Setup:
✅ Buy Plan:
🔄 Wait for a pullback to the support zone (🟦 light blue area) before entering.
🎯 Target: $3,056.97 📈🏁
🛑 Stop Loss: $2,999.02 ❌🚨
📈 Indicators & Confirmation:
📊 DEMA (9-period) = $3,026.48 (near the current price, suggesting a neutral-to-bullish trend).
🔥 Conclusion:
🔵 Bullish Setup Active 🚀
⚠️ Wait for price reaction at support before entering.
❌ If price drops below $2,999, the setup is invalidated.
📌 Final Tip: Watch for a bullish candlestick pattern 📊 at support before executing the trade! 🎯
Trade closed: target reached
Note
📊 Gold (XAU/USD) 1H Chart Analysis🔹 Support & Resistance Zones
🟦 Support Area: Around $2,999 (Price bounced from here)
🟥 Resistance Area: Price broke above and turned bullish
🔹 Breakout Confirmation
📉 Trendline Break Broken → 🚀 Strong bullish move
✅ Target Point Hit at $3,056.97 🎯
🔹 Momentum & Indicators
📈 Measured Move: +48.41 points (1.61%) 📊
📊 9-Period DEMA (3,050.15) – Price still above 📍
⚡ Conclusion:
🎯 All Targets Hit! 🏆🔥
Now, watch for:
👉 Breakout above 3,056.97? (Bullish continuation)
👉 Pullback to support zones? (Possible retest)
join my tellegram channel
t.me/+yhY0QtYtM0g0NWM0
join my refferal broker
one.exnesstrack.org/a/g565sj1uo7?source=app
t.me/+yhY0QtYtM0g0NWM0
join my refferal broker
one.exnesstrack.org/a/g565sj1uo7?source=app
Related publications
Disclaimer
The information and publications are not meant to be, and do not constitute, financial, investment, trading, or other types of advice or recommendations supplied or endorsed by TradingView. Read more in the Terms of Use.