Here is a detailed technical and sentiment analysis for gold incorporating RSI, MACD, Ichimoku, and Volume, based on the charts and data you provided, followed by a concrete trading strategy.
Overall Sentiment: Bullish Exhaustion at a Critical Juncture
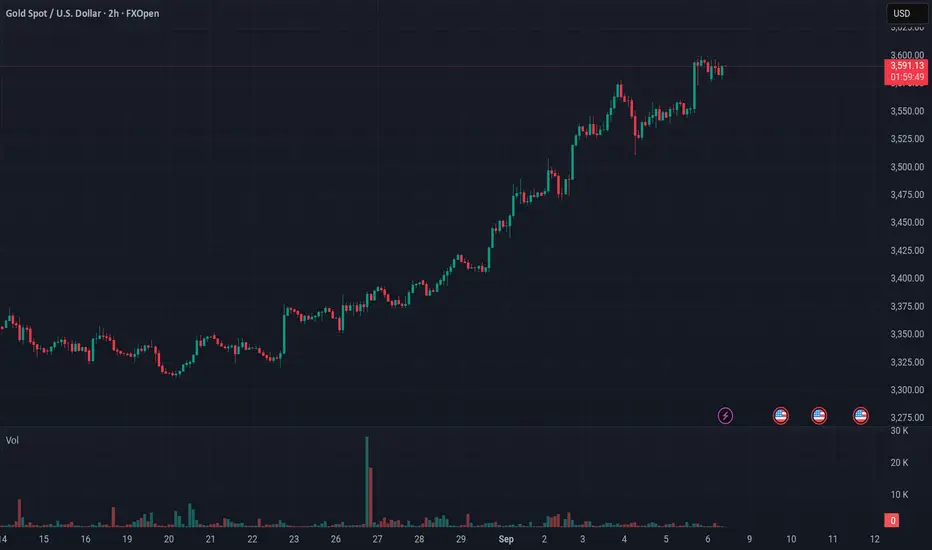
The market is in a state of powerful bullish momentum fueled by weak economic data (NFP) but is showing clear technical signs of exhaustion and overbought conditions. This creates a high-risk environment where a significant pullback is increasingly probable before any next leg up.
---
Technical Indicator Analysis
While your charts don't show the indicators directly, we can infer their likely state based on the price action and standard settings.
1. Relative Strength Index (RSI - Typically 14-period):
· Likely Reading: On the Daily (1D) and 4H charts, the RSI is almost certainly in overbought territory (above 70, likely even above 80).
· Analysis: This confirms the market is overbought. The minor pullbacks on the 2H and 4H charts (shown by the small red candles) are likely causing the RSI to dip from extreme levels, but it remains elevated. This is a classic warning sign of a potential reversal or consolidation.
2. Moving Average Convergence Divergence (MACD - Typically 12,26,9):
· Likely Reading: On all timeframes, the MACD is above its signal line and at or near extreme highs.
· Analysis: This supports the strong bullish momentum. However, on the shorter timeframes (2H, 4H), we should be watching for bearish divergence (price making equal or higher highs while the MACD makes lower highs). This would be a strong short-term sell signal. The current consolidation increases the probability of this divergence forming.
3. Ichimoku Kinko Hyo:
· Price vs. Cloud (Kumo): The price is ** dramatically above the Senkou Span (Cloud)** on the daily chart. This indicates an extremely strong bullish trend but also a massive extension from its mean, suggesting a pullback towards the cloud is a high probability.
· Tenkan-sen (Conversion Line) vs. Kijun-sen (Base Line): The Tenkan-sen is almost certainly far above the Kijun-sen, confirming the strong trend. A crossing below would be a strong short-term bearish signal.
· Future Cloud: The cloud is likely bullish (green) and thinning, suggesting underlying trend strength but potential for volatility.
4. Volume:
· Analysis: The COT report is a form of volume analysis. The ** surge in open interest (+49,148 contracts)** from the 09/02 report, driven by new speculator longs, represents a massive influx of volume and commitment. However, this often marks climactic buying, not a sustainable pace. In the price charts, the consolidation near the highs on declining volume would be a bearish sign, indicating a lack of new buyers at these levels.
Synthesis of All Factors
Factor Analysis Implication
Fundamental (NFP) Very Bullish. Weak data = weak USD, dovish Fed. Long-term trend is UP.
COT (Speculative Sentiment) Extremely Bullish (Overheated). Record net long positioning. High short-term risk of a sharp pullback.
Price Trend Bullish but Stalling. Consolidating at all-time highs. Indecision; potential exhaustion.
RSI Overbought on higher timeframes. Suggests a correction is due.
MACD Bullish but potential for bearish divergence. Momentum may be waning.
Ichimoku Price extremely extended from Cloud. Suggests a pullback is likely.
Volume (via COT) Climactic buying. Often marks a short-term peak.
---
Trading Strategy for Today
Core Principle: The trend is still up, but the risk/reward for new long entries at the current price is very poor. The optimal strategy is to wait for a technical correction to buy into strength or prepare for a reversal signal.
Scenario 1: Wait for a Pullback to Buy (Highest Probability & Prudence)
· Idea: Use the overbought signals and Ichimoku analysis to anticipate a pullback to a stronger support zone.
· Entry Zone: $3,480 - $3,520. This area aligns with previous resistance (now support) and a potential pullback towards the rising Tenkan-sen or Kijun-sen on the 4H chart.
· Confirmation: Look for bullish reversal candlesticks (hammer, bullish engulfing) and an RSI pulling back towards 50 (but not oversold).
· Stop Loss: A daily close below $3,450.
· Target: A move back towards the highs at $3,580 - $3,600.
Scenario 2: Breakout Trade (Lower Probability, Higher Risk)
· Idea: If the bullish momentum ignores all overbought signals.
· Entry: A sustained 4H or daily close above $3,610.
· Confirmation: The MACD should make a new high (avoiding divergence) and volume should increase on the breakout.
· Stop Loss: Below $3,590.
· Target: $3,650 - $3,680. Use a trailing stop.
Scenario 3: Aggressive Fade (For Experienced Traders)
· Idea: Fade the extreme bullish sentiment using bearish divergence and overbought RSI.
· Entry: On a clear bearish divergence on the 4H MACD (price makes a new high, MACD makes a lower high) AND a rejection from the $3,590 - $3,600 resistance level.
· Stop Loss: A close above $3,610.
· Target: $3,520 - $3,540.
Key Risk Management Note:
· NFP Event Risk: The next NFP release is TODAY (Sep 09, 19:30 GMT). This will cause massive, unpredictable volatility.
· Action: DO NOT enter new positions before this release. The market's reaction to the news will dictate the next major direction. If you are in a position, strongly consider reducing size or hedging.
Summary Table for Action
Strategy Entry Stop Loss Target Confidence
Pullback Buy $3,480 - $3,520 < $3,450 $3,580 - $3,600 High
Breakout Buy $3,610 < $3,590 $3,650 - $3,680 Low
Aggressive Fade ~$3,595 + Divergence $3,610 $3,520 - $3,540 Medium
Final Conclusion: The technical indicators (RSI, MACD, Ichimoku) all align with the COT data to scream "Overbought!" The fundamental driver is strong, but the market needs to cool off. The best trade is no trade until after the NFP news or a pullback into support. Patience will be rewarded with a much better risk-to-reward entry.
Overall Sentiment: Bullish Exhaustion at a Critical Juncture
The market is in a state of powerful bullish momentum fueled by weak economic data (NFP) but is showing clear technical signs of exhaustion and overbought conditions. This creates a high-risk environment where a significant pullback is increasingly probable before any next leg up.
---
Technical Indicator Analysis
While your charts don't show the indicators directly, we can infer their likely state based on the price action and standard settings.
1. Relative Strength Index (RSI - Typically 14-period):
· Likely Reading: On the Daily (1D) and 4H charts, the RSI is almost certainly in overbought territory (above 70, likely even above 80).
· Analysis: This confirms the market is overbought. The minor pullbacks on the 2H and 4H charts (shown by the small red candles) are likely causing the RSI to dip from extreme levels, but it remains elevated. This is a classic warning sign of a potential reversal or consolidation.
2. Moving Average Convergence Divergence (MACD - Typically 12,26,9):
· Likely Reading: On all timeframes, the MACD is above its signal line and at or near extreme highs.
· Analysis: This supports the strong bullish momentum. However, on the shorter timeframes (2H, 4H), we should be watching for bearish divergence (price making equal or higher highs while the MACD makes lower highs). This would be a strong short-term sell signal. The current consolidation increases the probability of this divergence forming.
3. Ichimoku Kinko Hyo:
· Price vs. Cloud (Kumo): The price is ** dramatically above the Senkou Span (Cloud)** on the daily chart. This indicates an extremely strong bullish trend but also a massive extension from its mean, suggesting a pullback towards the cloud is a high probability.
· Tenkan-sen (Conversion Line) vs. Kijun-sen (Base Line): The Tenkan-sen is almost certainly far above the Kijun-sen, confirming the strong trend. A crossing below would be a strong short-term bearish signal.
· Future Cloud: The cloud is likely bullish (green) and thinning, suggesting underlying trend strength but potential for volatility.
4. Volume:
· Analysis: The COT report is a form of volume analysis. The ** surge in open interest (+49,148 contracts)** from the 09/02 report, driven by new speculator longs, represents a massive influx of volume and commitment. However, this often marks climactic buying, not a sustainable pace. In the price charts, the consolidation near the highs on declining volume would be a bearish sign, indicating a lack of new buyers at these levels.
Synthesis of All Factors
Factor Analysis Implication
Fundamental (NFP) Very Bullish. Weak data = weak USD, dovish Fed. Long-term trend is UP.
COT (Speculative Sentiment) Extremely Bullish (Overheated). Record net long positioning. High short-term risk of a sharp pullback.
Price Trend Bullish but Stalling. Consolidating at all-time highs. Indecision; potential exhaustion.
RSI Overbought on higher timeframes. Suggests a correction is due.
MACD Bullish but potential for bearish divergence. Momentum may be waning.
Ichimoku Price extremely extended from Cloud. Suggests a pullback is likely.
Volume (via COT) Climactic buying. Often marks a short-term peak.
---
Trading Strategy for Today
Core Principle: The trend is still up, but the risk/reward for new long entries at the current price is very poor. The optimal strategy is to wait for a technical correction to buy into strength or prepare for a reversal signal.
Scenario 1: Wait for a Pullback to Buy (Highest Probability & Prudence)
· Idea: Use the overbought signals and Ichimoku analysis to anticipate a pullback to a stronger support zone.
· Entry Zone: $3,480 - $3,520. This area aligns with previous resistance (now support) and a potential pullback towards the rising Tenkan-sen or Kijun-sen on the 4H chart.
· Confirmation: Look for bullish reversal candlesticks (hammer, bullish engulfing) and an RSI pulling back towards 50 (but not oversold).
· Stop Loss: A daily close below $3,450.
· Target: A move back towards the highs at $3,580 - $3,600.
Scenario 2: Breakout Trade (Lower Probability, Higher Risk)
· Idea: If the bullish momentum ignores all overbought signals.
· Entry: A sustained 4H or daily close above $3,610.
· Confirmation: The MACD should make a new high (avoiding divergence) and volume should increase on the breakout.
· Stop Loss: Below $3,590.
· Target: $3,650 - $3,680. Use a trailing stop.
Scenario 3: Aggressive Fade (For Experienced Traders)
· Idea: Fade the extreme bullish sentiment using bearish divergence and overbought RSI.
· Entry: On a clear bearish divergence on the 4H MACD (price makes a new high, MACD makes a lower high) AND a rejection from the $3,590 - $3,600 resistance level.
· Stop Loss: A close above $3,610.
· Target: $3,520 - $3,540.
Key Risk Management Note:
· NFP Event Risk: The next NFP release is TODAY (Sep 09, 19:30 GMT). This will cause massive, unpredictable volatility.
· Action: DO NOT enter new positions before this release. The market's reaction to the news will dictate the next major direction. If you are in a position, strongly consider reducing size or hedging.
Summary Table for Action
Strategy Entry Stop Loss Target Confidence
Pullback Buy $3,480 - $3,520 < $3,450 $3,580 - $3,600 High
Breakout Buy $3,610 < $3,590 $3,650 - $3,680 Low
Aggressive Fade ~$3,595 + Divergence $3,610 $3,520 - $3,540 Medium
Final Conclusion: The technical indicators (RSI, MACD, Ichimoku) all align with the COT data to scream "Overbought!" The fundamental driver is strong, but the market needs to cool off. The best trade is no trade until after the NFP news or a pullback into support. Patience will be rewarded with a much better risk-to-reward entry.
Disclaimer
The information and publications are not meant to be, and do not constitute, financial, investment, trading, or other types of advice or recommendations supplied or endorsed by TradingView. Read more in the Terms of Use.
Disclaimer
The information and publications are not meant to be, and do not constitute, financial, investment, trading, or other types of advice or recommendations supplied or endorsed by TradingView. Read more in the Terms of Use.