1. Technical Pattern
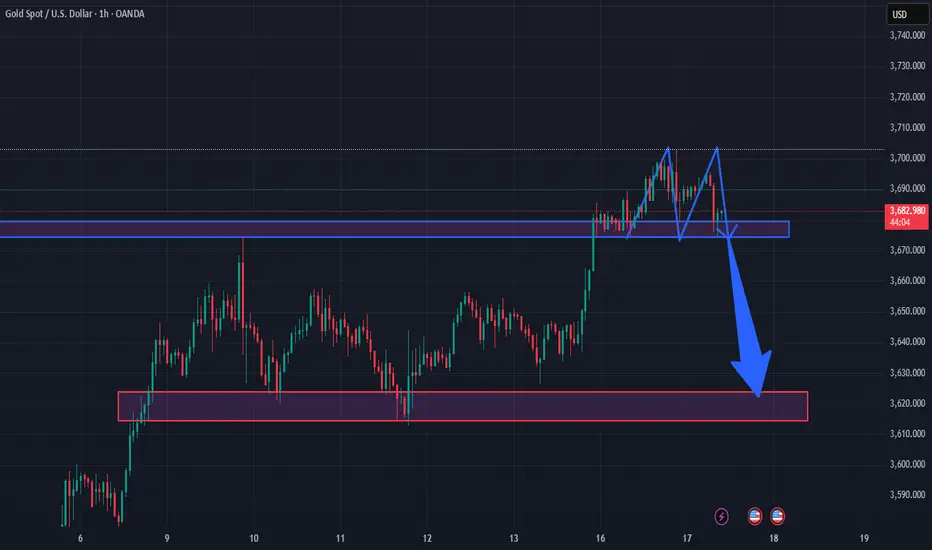
The market is forming a Double Top pattern around the 3,700 level.
After breaking the neckline (previous support, now turned resistance, marked in blue), the price is retesting this area.
This confirms a potential bearish continuation.
2. Support & Resistance
Key Resistance: 3,690 – 3,705 (neckline area after the breakdown).
Near-term Support: 3,670 (current retest zone).
Major Support: 3,615 – 3,625 (red zone below, aligning with previous lows and accumulation area).
3. Price Scenarios
If the price fails to break above 3,690 – 3,705, there is a high probability of dropping toward 3,620 – 3,625.
On the other hand, if the price closes above 3,705 on H1/H4, the bearish setup fails, and the market could resume its bullish trend.
4. Trading Implication
This is a SELL setup following the short-term bearish trend, with entry around 3,685 – 3,695.
Target: 3,620 – 3,625.
Stop Loss: above 3,710 (to avoid a false breakout).
✅MY FREE FOREX & XAUUSD SIGNALS TELEGRAM CHANNEL:
t.me/Jenny_in_your_area
🔴9-12 signals per day
🔴Free knowledge support
🔴24/7 support for newbies.
🔴You always have priority.
JENDA FISH 😘
t.me/Jenny_in_your_area
🔴9-12 signals per day
🔴Free knowledge support
🔴24/7 support for newbies.
🔴You always have priority.
JENDA FISH 😘
Related publications
Disclaimer
The information and publications are not meant to be, and do not constitute, financial, investment, trading, or other types of advice or recommendations supplied or endorsed by TradingView. Read more in the Terms of Use.