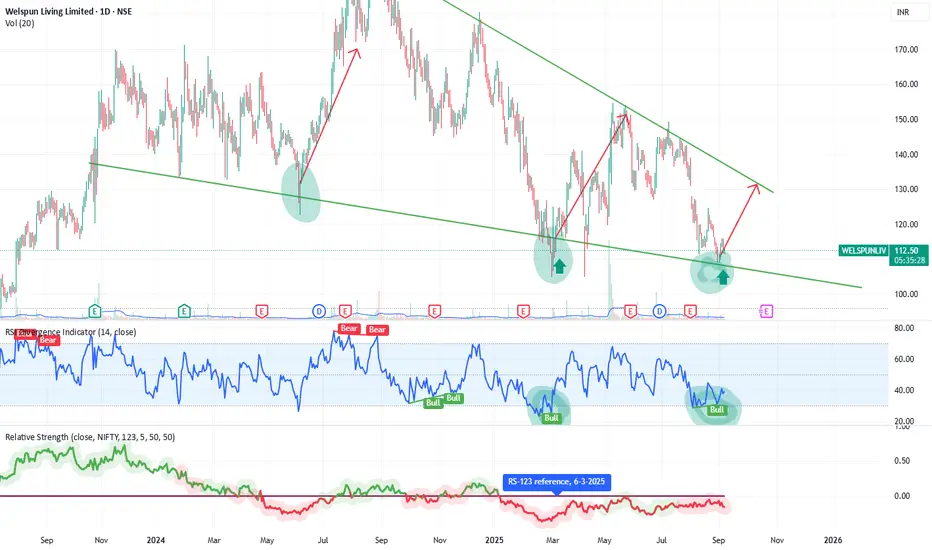
Welspun Living – Bullish Reversal | Swing Trade SetupWelspun Living (NSE: WELSPUNLIV) is showing a potential bullish reversal after bouncing off a long-term descending trendline support. This level has previously triggered strong upward swings.
The chart also shows a bullish RSI divergence, indicating waning selling momentum. A breakout above immedia
Explore the community
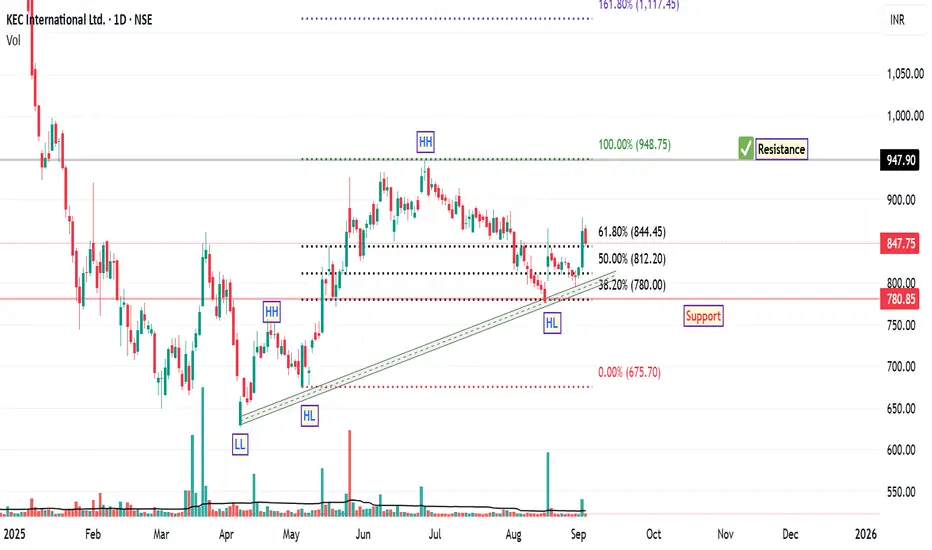
KEC International: Bullish Structure with StrengthSince April 7th, the price structure of KEC International has demonstrated a notable bullish trend reversal, characterized by the formation of higher highs and higher lows along an ascending trendline. This pattern is often interpreted by technical analysts as a sign of strengthening upward moment
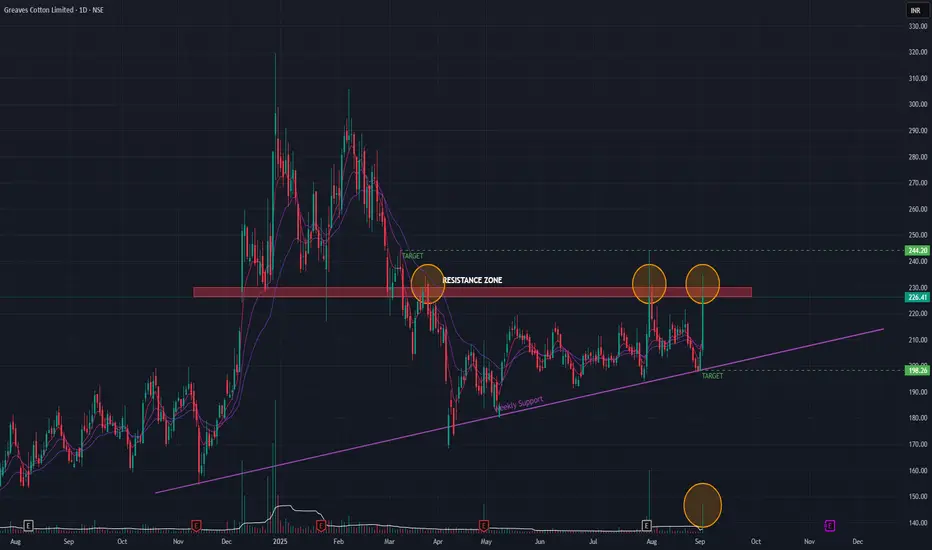
Greaves Cotton (Daily Timeframe) - Will it BreakOut or Not?Greaves Cotton since it's Double-Top formation has been in a downtrend. A key support level has become a resistance zone, which it's been trying to BreakOut few times. The stock has been forming Higher Lows for a while now. Few attempts to BreakOut has been futile. The recent BreakOut attempts been
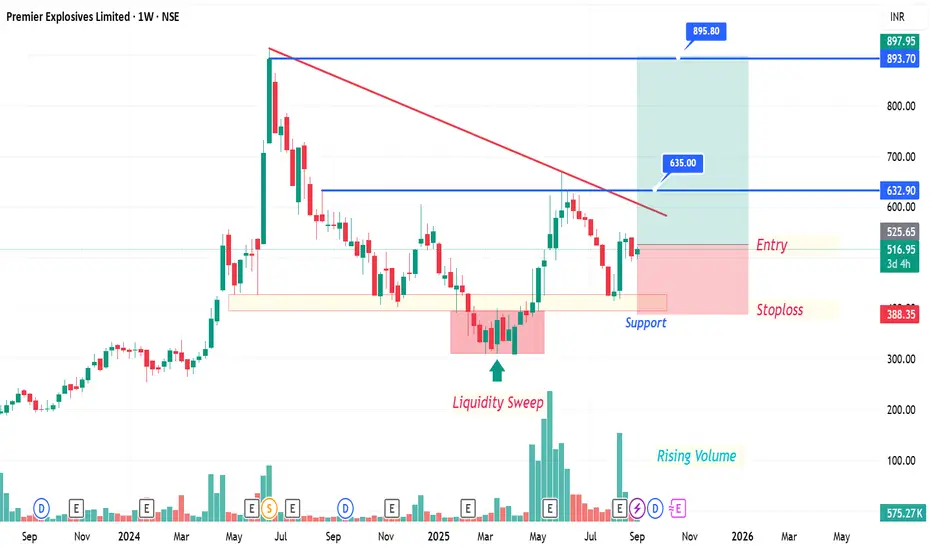
Premier Explosives Limited (NSE: PREMIER) Analysis -1WWeekly Chart Analysis
✅ Support Zone: Strong base around ₹388–400 held well with a liquidity sweep.
📈 Rising Volumes: Indicating accumulation and strong buying interest.
🔻 Downtrend Line: Stock approaching breakout zone near ₹632–635.
📌 Entry Zone: Around ₹517–525 (current levels).
⛔ Stoploss:
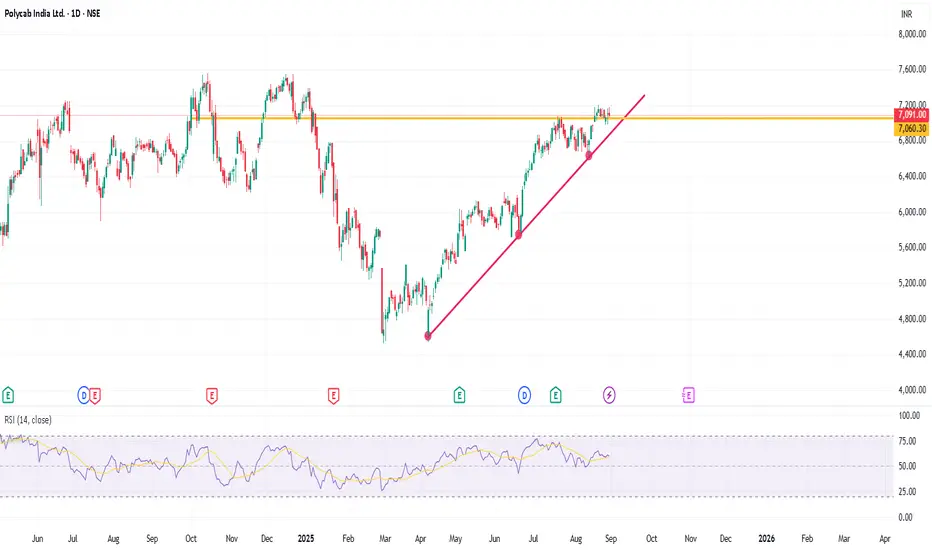
POLYCABThis analysis is intended solely for educational purposes and does not constitute financial advice.
Polycab is showing gradual bullish momentum, supported by a trendline reversal and trading above a key support level. The stock is currently in a minor consolidation phase, which may signal accumulat
Dixon Inverted HnSDixon Technologies is making a inverted Head n shoulder in the daily timeframe.
One can look for taking an entry at the retest of 17300-17320. Support can be considered at todays low. Keep a Check on the Chart and you will get to see how a head n shoulder is made.
Usually the Support for a HnS is

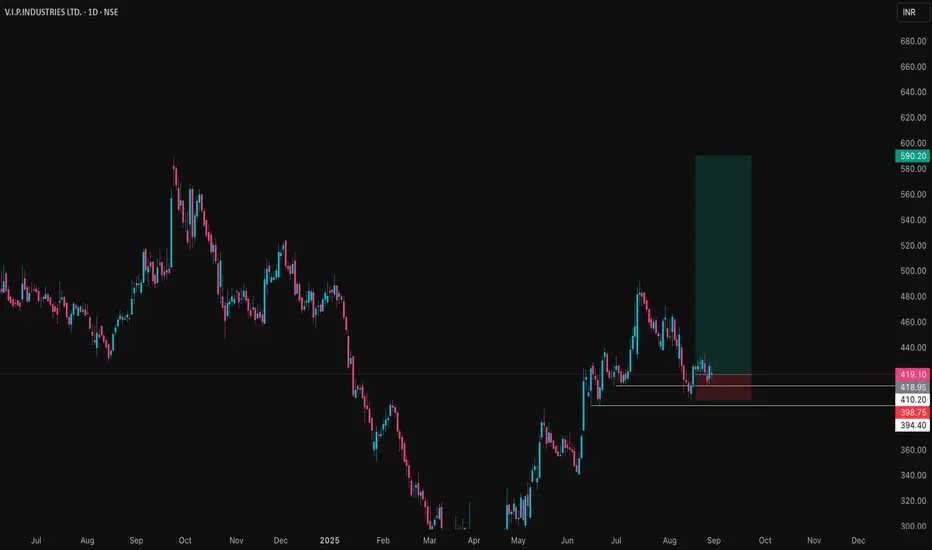
VIPIND Price ActionVIP Industries is trading around ₹420 at the end of August 2025, showing relative stability despite recent operational headwinds. The company reported a decline in both revenue and profitability for the June quarter, with net sales falling to approximately ₹561 crore and a posted net loss of about ₹
Garuda Construction – Cup & Handle Breakout | Swing Trade PlanGaruda Construction has given a textbook Cup & Handle breakout backed by strong volume and solid fundamentals.
Technical Analysis
A Cup & Handle pattern has formed with a neckline breakout above ₹200.
Stock closed strongly at ₹216.33 (+9.66%) with massive volume (7.5M vs 3.1M avg) - confirms inst

Support and Resistance Concept- Bank NiftyThis article concentrates on Support and resistance concept from investment perspective with Bank Nifty monthly chart example.
Let us first understand a few things:
⚪ In simple terms, a resistance is a level from where price rejects significantly because sellers dominated buyers. Contrastingly, su

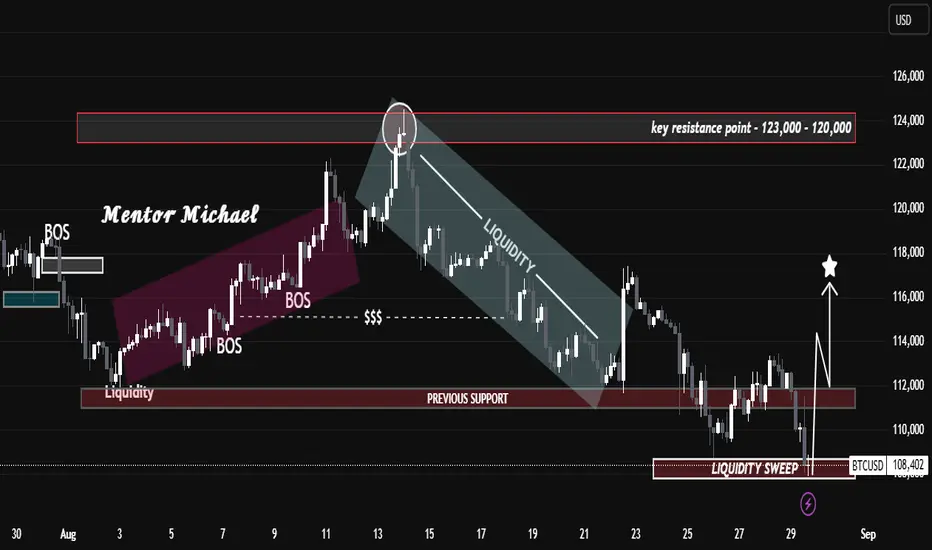
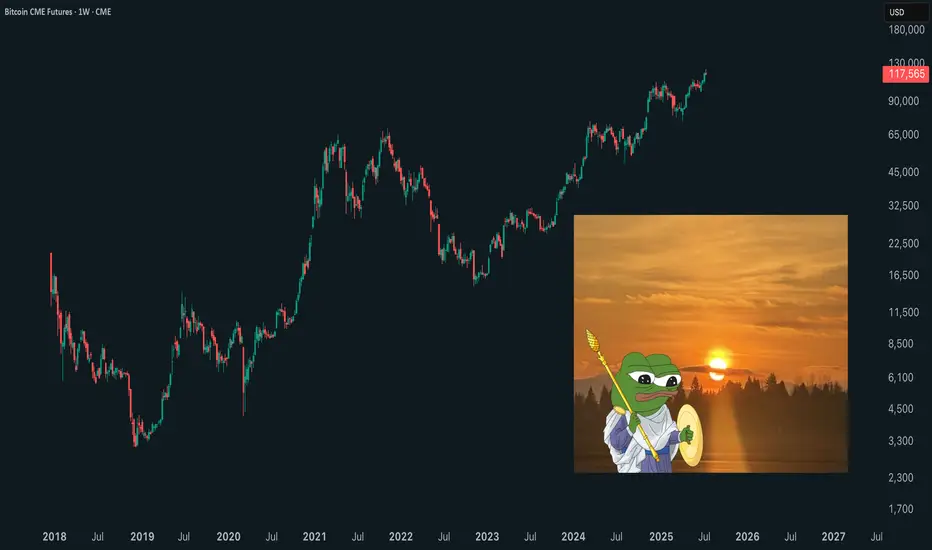
Liquidity Grab Completed – Bulls Back in Control?Liquidity Grab Completed – Bulls Back in Control?
Key Technical Insights:
Resistance Rejection: Price sharply rejected the 120K – 123K resistance zone, confirming this area as a key supply level.
Bearish Liquidity Flow: After rejection, BTC flowed within a descending liquidity channel, continuous
See all editors' picks ideas
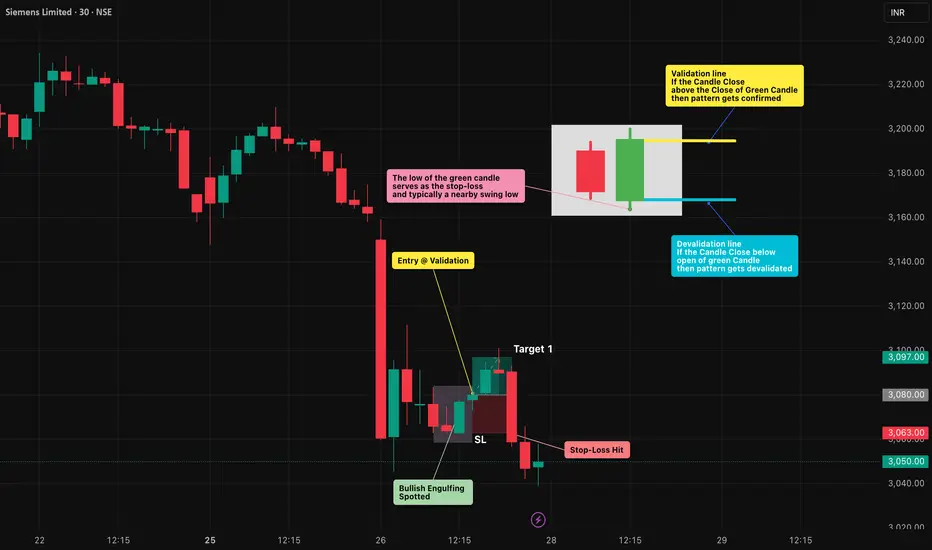
Bullish Engulfing Pattern: Spotting Reversals with Discipline🔎 Intro / Overview
Managing risk is just as important as finding an entry. The Bullish Engulfing is one of the most effective candlestick patterns to identify potential reversals. When traded with discipline, it signals a shift from seller pressure to buyer control, helping traders time their ent
Commit to the Shift next week - focuse on becoming consistent
For the next week, we’re focusing on two powerful tasks that will move you closer to becoming a consistently profitable trader:
✅ Task 1: Deep self-reflection. Understand your strengths, demons, and bad habits—the things holding you back from consistency. Identify your triggers and write them down

Survival First, Success LaterThere was once a stone that lay deep in the heart of a flowing river.
Every day, the water rushed past it, sometimes gently, sometimes with force. The stone wanted to stay strong, unmoved. It believed that by holding its ground, it could outlast the river.
For years, the stone resisted. It didn’t
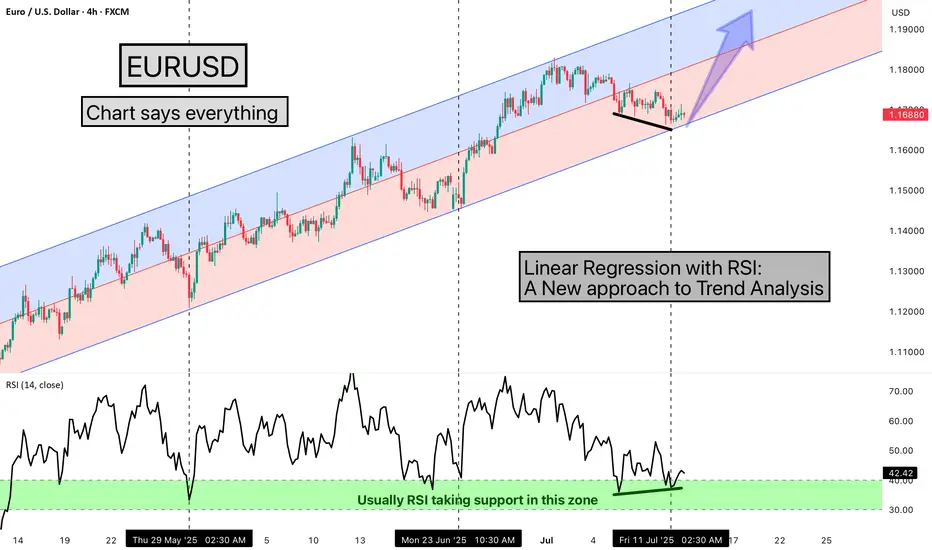
Linear Regression with RSI: A New approach to Trend AnalysisHello Friends,
Welcome to RK_Chaarts,
Today we are going to learn one Method of analysing the chart, here we are using EURUSD chart, and the method we're using is very simple & interesting, We are using the Linear Regression Trend Channel & Relative Strength Index (RSI), What happens in this metho
Who Should Avoid Trading? Is That You? Ask YourselfThere is no doubt that trading is the simplest business in the world. You just need to do a small paperwork which is online these days, need a laptop or PC and an internet connection. Besides that, all you need is time. But here the simplest should not be confused with the Easy. Although you just ne

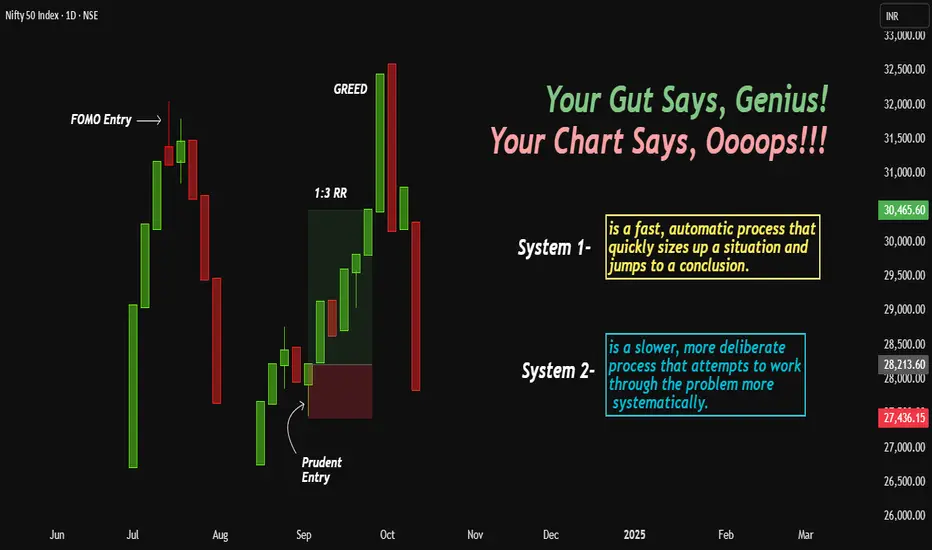
Brain Hunts, Wallet Hurts!In this brief article, I aim to throw some light upon a typical trader's psychology, which is often swayed by greed and fear, and the constant battle between careful analysis and impulsive decisions.
Traders who actually trade and not just analyze understand that the stock market is not merely a ga
Effective inefficiencyStop-Loss. This combination of words sounds like a magic spell for impatient investors. It's really challenging to watch your account get smaller and smaller. That's why people came up with this magic amulet. Go to the market, don't be afraid, just put it on. Let your profits run, but limit your los

The Ascending Triangle Pattern: A Bullish Continuation GuideHello Traders!
In today's post, we’ll explore the Ascending Triangle Pattern , one of the most reliable bullish continuation patterns that traders look for during uptrends . It’s an important tool for identifying potential breakout points in trending markets. If you want to learn how to trade

Investing in ETFs made simple 101Hello,
Investing in Exchange-Traded Funds (ETFs) can be challenging, especially for beginners who may struggle with selecting the right funds, understanding market trends, and managing risks. With thousands of ETFs available, covering various asset classes, sectors, and investment strategies, it ca

The Budget Effect- Key ObservationsThe market often reacts to major political or economic events, with people setting high expectations. These expectations, whether positive or negative, lead to wild market swings and hence higher volatility. However, when you take a look at the Nifty’s long-term chart, you’ll see that the impact of

See all editors' picks ideas
Dow Theory Update and Nifty AnalysisIn this video, we have explained the following points -
* A new Dow Top "A1" has been created by Nifty50.
* The significance of the new Dow Top has been explained.
* The current structure of Nifty has been discussed.
* The importance of waiting for the next candle and the current key support lev

Commit to the Shift next week - focuse on becoming consistent
For the next week, we’re focusing on two powerful tasks that will move you closer to becoming a consistently profitable trader:
✅ Task 1: Deep self-reflection. Understand your strengths, demons, and bad habits—the things holding you back from consistency. Identify your triggers and write them down
Market Analysis and Nifty AnalysisIn this video, I have provided an overall market analysis. :
Although the market is green today, it's important to stay cautious.
Small caps are forming range-bound bullish engulfing candles, but we need to wait for the closing.
Nifty continues to form lower lows on the lower time frame. A

Nifty 50 Analysis and Dow theory LevelNifty 50 Analysis:
Points discussed in the video-
How we should observe structure when there is a big gap.
Importance of current gap up on major resistance.
Importance of today's closing.
Dow Theory Level:
As per Dow theory, we are heading towards trend change and uptrend will be there.
O

What is Object Tree and it's UsesHi mates kindly watch the video for understanding the Object tree and it's uses in technical analysis as i feel the new entrants to technical analysis still might not know about it, I hope you will like this publication,
Thanks for watching and giving your time.
Best regards- Amit

A clear Falling channel pattern in Amara Raja(Hindi)NSE:ARE_M From it's All time high it has formed a falling channel pattern and now it is ready to break it for a higher high. Target is an all-time high and SL will be 1340 and below as per risk appetite and holding capacity.

Nifty Analysis for 21-Oct-24 and Short term Orient AromaticsStock has been analyzed based on my trendline analysis. Please note that levels given are for training and educational purpose only. Please do consult your financial advisor before investing in the stock

MAHINDRA LOGISTICSHello & welcome to this analysis
It has resistance near 550 while strong support between 500-450
One can accumulate the stock in the wider range of 550-450 for possible upside levels of 650-725-900.
View would go wrong if it starts slipping below 350
Happy investing

Amazing swing trading idea for 13 May Markets I make educational content videos for swing / positional trading

2 Amazing swing trading idea for 24 AprilI daily make educational content videos for swing / positional trading

See all editors' picks ideas
VWAP Price ChannelVWAP Price Channel cuts the crust off of a traditional price channel (Donchian Channel) by anchoring VWAPs at the highs and lows. By doing this, the flat levels, characteristic of traditional Donchian Channels, are no more!
Author's Note: This indicator is formed with no inherent use, and serves

Fibonacci Sequence Circles [BigBeluga]🔵 Overview
The Fibonacci Sequence Circles is a unique and visually intuitive indicator designed for the TradingView platform. It combines the principles of the Fibonacci sequence with geometric circles to help traders identify potential support and resistance levels, as well as price expansio

ATAI Volume Pressure Analyzer V 1.0 — Pure Up/DownATAI Volume Pressure Analyzer V 1.0 — Pure Up/Down
Overview
Volume is a foundational tool for understanding the supply–demand balance. Classic charts show only total volume and don’t tell us what portion came from buying (Up) versus selling (Down). The ATAI Volume Pressure Analyzer fills that g

Market Cap Landscape 3DHello, traders and creators! 👋
Market Cap Landscape 3D. This project is more than just a typical technical analysis tool; it's an exploration into what's possible when code meets artistry on the financial charts. It's a demonstration of how we can transcend flat, two-dimensional lines and step into

ZigzagLiteLibrary "ZigzagLite"
Lighter version of the Zigzag Library. Without indicators and sub-component divisions
method getPrices(pivots)
Gets the array of prices from array of Pivots
Namespace types: Pivot
Parameters:
pivots (Pivot ) : array array of Pivot objects
Returns: array array

ZigzagLibrary "Zigzag"
Zigzag related user defined types. Depends on DrawingTypes library for basic types
method tostring(this, sortKeys, sortOrder, includeKeys)
Converts ZigzagTypes/Pivot object to string representation
Namespace types: Pivot
Parameters:
this (Pivot) : ZigzagTypes/Pivot

Angled Volume Profile [Trendoscope]Volume profile is useful tool to understand the demand and supply zones on horizontal level. But, what if you want to measure the volume levels over trend line? In trending markets, the feature to measure volume over angled levels can be very useful for traders who use these measures. Here is an att

MathEasingFunctionsLibrary "MathEasingFunctions"
A collection of Easing functions.
Easing functions are commonly used for smoothing actions over time, They are used to smooth out the sharp edges
of a function and make it more pleasing to the eye, like for example the motion of a object through time.
Easing function

Treasury Yields Heatmap [By MUQWISHI]▋ INTRODUCTION :
The “Treasury Yields Heatmap” generates a dynamic heat map table, showing treasury yield bond values corresponding with dates. In the last column, it presents the status of the yield curve, discerning whether it’s in a normal, flat, or inverted configuration, which determined by us

Time & Sales (Tape) [By MUQWISHI]▋ INTRODUCTION :
The “Time and Sales” (Tape) indicator generates trade data, including time, direction, price, and volume for each executed trade on an exchange. This information is typically delivered in real-time on a tick-by-tick basis or lower timeframe, providing insights into the traded size

See all editors' picks scripts