Only You can make you ProfitableThose who have been in the trading world for some time must have realized by now that Profitable trading isn’t just about charts and indicators, it’s mostly about Yourself.
We may have the cleanest setup, perfect RSI levels, and all your EMAs aligned like planets, and still lose money😢
Because charts do not control your hand on the mouse or keyboard buttons, only you do.
The real problem usually is not the entry or the indicators.
It’s
Impatience,
Overconfidence,
Revengeful trading,
Need more confirmation
before hitting the buy button.
These habits grow over time if not realized and controlled at the very beginning, lead to more and more losses.
Indicators can give you an edge. But they can’t stop you from cutting winners too soon or holding losers too long. You need to first plan and then execute it religiously.
Trading doesn’t test your strategy; it tests your discipline.
And honestly, that’s what makes it both frustrating and fascinating.
What do you think?
Community ideas
EMA 50 + RSI Divergence = Gold Reversal Setup!Hello Traders!
Gold often makes sharp one-sided moves, trapping traders who enter too late. But if you know how to combine a simple moving average with a momentum indicator, you can spot high-probability reversal setups.
One such method is using the EMA 50 together with RSI Divergence . Let’s break down how it works.
1. Why EMA 50?
The 50-period EMA acts as a dynamic trend filter.
When gold trades above it, the short-term trend is bullish; below it, bearish.
Price often retests the EMA 50 during pullbacks, making it a key level to watch for reversals.
2. What is RSI Divergence?
Divergence happens when price makes a new high/low, but RSI doesn’t confirm it.
Example: Price makes a higher high, but RSI makes a lower high → bearish divergence.
This signals that momentum is weakening, even if price is still moving strongly.
3. Combining EMA 50 with RSI Divergence
First, check where price is relative to EMA 50.
Next, look for divergence on RSI near that zone.
If both align (price struggling at EMA 50 + RSI divergence), chances of a reversal increase sharply.
4. Entry & Risk Management
Wait for a confirmation candle near EMA 50 (like engulfing or pin bar).
Place stop loss just above recent swing high/low.
Target the next support/resistance zone for exits.
Rahul’s Tip:
Don’t use divergence alone, combine it with EMA 50 for structure and you’ll filter out most false signals. This setup works best on higher timeframes like 1H or 4H for gold.
Conclusion:
EMA 50 gives you the trend filter, and RSI divergence reveals momentum weakness.
Together, they form a reliable reversal setup that helps you enter gold trades at the right time instead of chasing moves.
This Educational Idea By @TraderRahulPal (TradingView Moderator) | More analysis & educational content on my profile
If this post gave you a new setup idea, like it, share your thoughts in comments, and follow for more practical trading strategies!
EMA vs SMA vs WMA: Which Moving Average Should You Use?🔎 Intro / Overview
Moving Averages remain one of the most trusted tools in technical analysis. They smooth price action, highlight the trend, and often act as dynamic support or resistance.
In this post, we compare the 20-period SMA, EMA, and WMA on BTCUSD 4H to show how each reacts differently to market moves.
___________________________________________________________
📔 Concept
SMA (Simple Moving Average): Every candle in the lookback is weighted equally → smooth but slower to react.
EMA (Exponential Moving Average): Recent candles carry more weight → reacts faster, hugs price closely.
WMA (Weighted Moving Average): Linear weighting → a balance between SMA’s stability and EMA’s sensitivity.
The difference lies in responsiveness. Faster averages react early but risk false signals, slower averages confirm trends but lag.
___________________________________________________________
📌 How to Use
1️⃣ Plot the 20-period SMA, EMA, and WMA together.
2️⃣ Watch how each responds during pullbacks, rallies, and consolidations.
3️⃣ Use EMA for quicker signals, SMA for smoother long-term view, and WMA if you prefer a middle ground.
4️⃣ Combine with price action or RSI to avoid relying on moving averages alone.
___________________________________________________________
🎯 Trading Plan
Intraday traders: EMA crossovers (e.g., 9 vs 21 EMA) for faster entries and exits.
Swing traders: SMA for identifying trend direction and major support/resistance.
Balanced traders: WMA for medium-term setups where stability and responsiveness matter equally.
Always align the moving average with your trading style and risk appetite.
___________________________________________________________
📊 Chart Explanation
On BTCUSD 4H:
EMA (red) bent upward first during the $114k breakout, SMA (blue) confirmed later, and WMA (green) sat between them.
At the $115k retest, EMA dipped first, while SMA lagged.
At $116.5–117k resistance, EMA whipsawed but SMA stayed smoother.
Notice how these differences become clear during sharp pullbacks, quick rallies, and sideways ranges.
___________________________________________________________
👀 Observation
EMA is quick but noisy ⚡, SMA is calm but late 🕰️, WMA strikes a middle ground ⚖️.
___________________________________________________________
❗ Why It Matters?
Choosing the right moving average impacts how quickly you spot entries, confirm trends, and manage stop-losses. Understanding the differences helps traders adapt strategies to both trending and sideways markets.
___________________________________________________________
🎯 Conclusion
No single moving average is “best.” Each serves a purpose depending on the timeframe and style of trading. The key is consistency — choose one that aligns with your plan, test it, and apply it with discipline.
👉 Which one do you prefer in your trading — EMA, SMA, or WMA?
___________________________________________________________
⚠️ Disclaimer
📘 For educational purposes only ·
🙅 Not SEBI registered ·
❌ Not a buy/sell recommendation ·
🧠 Purely a learning resource ·
📊 Not Financial Advice
Small Account Challenge1. Introduction to the Small Account Challenge
The world of trading often fascinates people because of the possibility of turning small sums of money into significant wealth. But in reality, most aspiring traders don’t begin with huge capital. They usually start with a small account—sometimes $100, $500, or $1,000. That’s where the concept of the Small Account Challenge comes in.
The Small Account Challenge is a structured attempt to grow a limited trading account into something much larger by following disciplined strategies, strict risk management, and consistency. It’s not just about making money—it’s about proving that with knowledge and discipline, even small amounts of capital can generate meaningful results.
The challenge is extremely popular on platforms like YouTube, Twitter (X), and Instagram, where traders showcase their journey from “$500 to $5,000” or “$1,000 to $10,000.” While some of these are genuine and inspiring, others are exaggerated or misleading. The reality lies somewhere in the middle: growing a small account is possible, but it requires patience, risk control, and realistic expectations.
For beginners, the small account challenge is appealing because:
It lowers the financial barrier to entry.
It provides a structured learning curve.
It forces traders to master risk management.
It builds trading discipline early on.
In short, the challenge is about mindset and strategy as much as it is about profit.
2. The Psychology Behind the Challenge
When trading with a small account, psychology plays a massive role. Unlike institutional traders with deep pockets, small-account traders face unique pressures.
2.1 The Motivation
Many traders start the challenge because they want financial independence, to prove their skill, or simply to test their strategies without risking too much. The thrill of seeing a $500 account grow to $1,000 is powerful motivation.
2.2 Emotional Control
The smaller the account, the higher the temptation to “double up” quickly. Unfortunately, that often leads to over-leverage and account blow-ups. To succeed, traders need to control emotions like greed, fear, and revenge trading.
2.3 Patience & Discipline
The hardest part of growing a small account isn’t making money—it’s sticking to small, consistent gains. Many traders expect 100% returns overnight, but the reality is more like 2–5% gains per week (still huge compared to banks).
A disciplined trader understands:
Consistency beats luck.
Risk management is survival.
Patience compounds growth.
3. Risk Management for Small Accounts
This is the foundation of the Small Account Challenge. Without proper risk management, no strategy will work long-term.
3.1 Position Sizing
With a small account, risking too much on one trade can wipe you out. The rule of thumb is risk only 1–2% of the account per trade.
For example, in a $500 account:
Risk per trade = $5–$10.
If stop-loss is $0.50 per share, you can only trade 10–20 shares.
3.2 Stop-Loss Discipline
Small accounts can’t afford deep losses. A strict stop-loss ensures that even a string of losing trades doesn’t kill the account.
3.3 Surviving Losing Streaks
Even the best traders face losing streaks. Risk management ensures survival during bad phases so you can capitalize during good ones.
A trader with a $500 account risking $50 per trade may survive only 10 bad trades. A trader risking $5 can survive 100 trades. Survival is everything.
4. Strategies for Small Account Challenges
Different traders use different approaches. Let’s explore the most common ones:
4.1 Scalping & Day Trading
Definition: Quick trades aiming for small profits.
Why it works: Small accounts benefit from fast turnover. A few cents of movement can yield decent percentage returns.
Risk: Requires speed, discipline, and often leverage.
4.2 Swing Trading
Definition: Holding trades for days or weeks.
Why it works: Less stressful than scalping, suitable for those with jobs.
Risk: Requires patience and larger stop-losses.
4.3 Options Trading
Definition: Trading contracts based on stock price movement.
Why it works: Provides leverage, allowing small accounts to control large positions.
Risk: Options can expire worthless quickly. Requires advanced knowledge.
4.4 Futures and Forex
Definition: Trading global currencies or commodity futures.
Why it works: High leverage, 24-hour markets, low capital required.
Risk: Leverage cuts both ways; easy to blow up accounts.
4.5 Copy-Trading / Social Trading
Definition: Copying professional traders’ trades via platforms.
Why it works: Beginners learn while following experienced traders.
Risk: Success depends on who you follow.
5. Compounding & Growth
The magic of the small account challenge lies in compounding.
5.1 The Power of Reinvestment
Instead of withdrawing profits, traders reinvest them. Even small percentage gains grow exponentially.
Example:
Start: $500
Gain 5% weekly → $25 first week
After 52 weeks → Over $6,000 (if compounded).
5.2 Realistic Expectations
Social media may glamorize turning $500 into $100,000 in months, but that’s rare. A disciplined trader focuses on sustainable growth, like doubling or tripling the account in a year.
6. Tools & Platforms for Small Accounts
6.1 Brokers
Robinhood, Webull, Zerodha, Upstox → popular for commission-free trades.
Interactive Brokers → advanced tools, good for scaling later.
6.2 Journaling Tools
Keeping a trading journal is crucial. Tools like TraderSync or Edgewonk help track win rates, risk-reward ratios, and mistakes.
6.3 Charting Platforms
TradingView → easy charts and social features.
Thinkorswim → great for U.S. traders.
MetaTrader 4/5 → standard for forex.
Conclusion
The Small Account Challenge isn’t just about money—it’s about discipline, patience, and skill-building. While social media may glorify turning $100 into $100,000 overnight, the real value of the challenge lies in learning how to manage risk, control emotions, and grow steadily.
A trader who can manage a $500 account with discipline can later manage $50,000 or even $500,000. The challenge is like training for a marathon—you build endurance, habits, and consistency that last for a lifetime.
In the end, success in the Small Account Challenge is less about how much money you make and more about the trader you become through the journey.
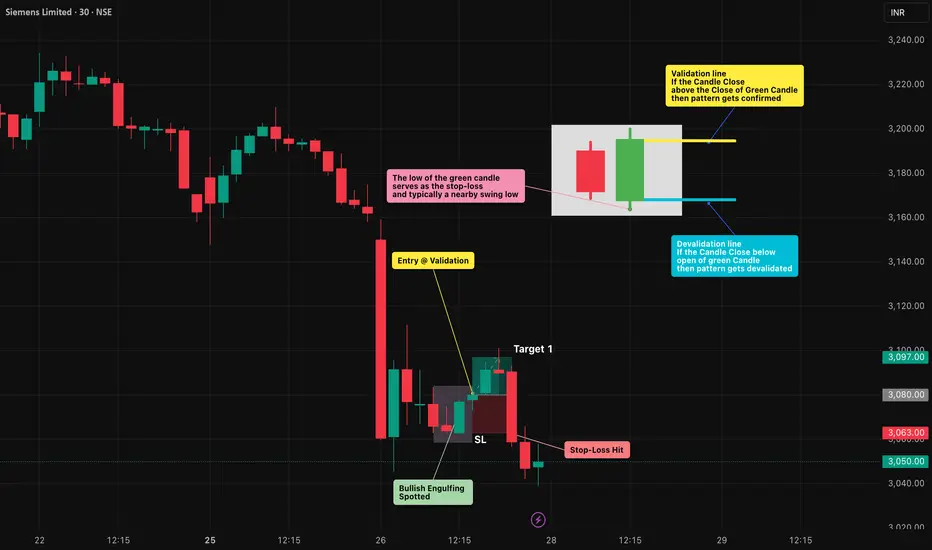
Bullish Engulfing Pattern: Spotting Reversals with Discipline🔎 Intro / Overview
Managing risk is just as important as finding an entry. The Bullish Engulfing is one of the most effective candlestick patterns to identify potential reversals. When traded with discipline, it signals a shift from seller pressure to buyer control, helping traders time their entries with confidence.
📔 Concept
A Bullish Engulfing occurs when:
The first candle is a small red candle that continues the downtrend.
The next candle is a large green candle whose body completely engulfs the red candle’s body .
👉 This shows a clear psychological shift — sellers push lower (red candle), but buyers step in strongly (green candle) and reclaim control.
📌 How to Use
✅ Validation → The candle must close above the close of the green candle.
❌ Invalidation → If price closes below the open of the green candle before confirmation.
Trading Plan:
Entry → After confirmation of the green candle’s close.
Stop-Loss (SL) → Below the low of the green candle.
Take-Profit (TP) :
Conservative → 1R (Entry → SL distance)
Moderate → 2R
Aggressive → Book partial at 1R and trail the rest using tools like ATR, Fibonacci levels, or structure-based stops to ride any extended upside move.
📊 Chart Explanation
On the chart, the first small red candle shows sellers continuing the downtrend. The next large green candle completely engulfs the red candle’s body and closes higher — signaling that buyers have taken control.
The pattern was validated at the close of the green candle , where the long entry was taken. The low of the green candle is used as the stop-loss level, while the targets are mirrored in reverse using the same distance.
In this example, Stop-loss was quickly achieved . From there, traders can apply trailing stop methods to lock in profits and manage further upside targets.
👀 Observation
Most effective at support zones or after a prolonged downtrend .
A high-volume green candle adds conviction to the signal.
In sideways/choppy markets , it can produce false signals — always filter with structure and indicators.
❗ Why It Matters?
The red candle shows seller pressure .
The green candle shows buyer strength .
This clear shift in control creates a rule-based setup with defined entry, SL, and TP.
🎯 Conclusion
The Bullish Engulfing is a strong sign of reversal — but only when combined with structure, confirmation, and disciplined risk management.
🔥 Patterns don’t predict. Rules protect.
⚠️ Disclaimer
For educational purposes only · Not SEBI registered · Not a buy/sell recommendation · No investment advice — purely a learning resource
Commit to the Shift next week - focuse on becoming consistent
For the next week, we’re focusing on two powerful tasks that will move you closer to becoming a consistently profitable trader:
✅ Task 1: Deep self-reflection. Understand your strengths, demons, and bad habits—the things holding you back from consistency. Identify your triggers and write them down. Awareness is the first step to control.
✅ Task 2: Pure execution. When you know your edge, the next step is flawless execution. Commit to taking 30 trades, track every single one, and review them with complete honesty.
This challenge may not sound flashy—there’s no fancy technical talk here—but it’s a game changer. If you take it seriously, this one week can push you seven steps ahead in your journey and set you on the path to join the top 5% of traders.
Take the challenge. Do the work. Your future self will thank you.

Survival First, Success LaterThere was once a stone that lay deep in the heart of a flowing river.
Every day, the water rushed past it, sometimes gently, sometimes with force. The stone wanted to stay strong, unmoved. It believed that by holding its ground, it could outlast the river.
For years, the stone resisted. It didn’t want to change. It believed that strength meant standing still, no matter how hard the current pulled.
But slowly, almost without noticing, the stone began to wear down. The river wasn’t trying to destroy it. The water wasn’t cruel. It was simply doing what rivers do - moving, shifting, carving its own path.
One day, the stone realised it wasn’t the same shape anymore. It was smoother now, smaller in places. It hadn’t won by resisting. It had survived by adapting. It had learned to let the river shape it without breaking it apart.
The stone couldn’t control the river. All it could do was endure without letting itself be shattered.
Trading is NOT so different.
The market moves like a river. It doesn’t care if you want it to go left or right. It doesn’t reward those who stand rigid against its flow. It rewards those who learn when to hold their ground, when to let go, and how to survive the constant pull of forces bigger than themselves.
This is NOT a story about rivers and stones. It’s a story about YOU.
About learning to endure without breaking. About understanding that survival comes not from fighting the current, but from learning how to live within it.
Much like the stone, every trader begins with the same illusion, that strength means control, that certainty can be conquered with enough knowledge or willpower.
But time in the markets teaches you otherwise. It shows you, again and again, that survival isn’t about resisting the flow. It’s about learning to move with it, to protect yourself from the inevitable storms without being broken by them.
And so, this is where the real story of trading begins.
Trading often appears simple from a distance. You buy, you sell, you make a profit, and then you repeat the process.
But anyone who has spent enough time in the markets will tell you the truth. This isn’t a game of certainty. This is a game of survival.
The market humbles you early. It doesn’t care how much you know, how brilliant you think you are, or how much confidence you bring. The market doesn’t reward ego; it breaks it down piece by piece.
Almost everyone starts with the same mindset. You want to win. You want to make money. You believe you can figure it out if you study hard enough, work smart enough, hustle more than the next person.
But eventually, reality steps in. You begin to understand this game isn’t about knowing where the price will go next. It’s about knowing where you will stop, where you will cut a loss, where you will step aside and wait.
The traders who survive are not the ones who chase perfection or seek to predict every move. They are the ones who learn how to lose properly - small losses, controlled losses. Losses that don’t bleed into something bigger, mentally or financially.
Most people can’t do that. They fight the market. They fight themselves. They refuse to accept small losses, believing they can somehow force a different outcome.
Those small losses eventually snowball. Blowups rarely come from one bad trade. They come from ignoring the small signs over and over again. The market isn’t cruel. It’s just indifferent. It’s your responsibility to protect yourself.
Good trading isn’t loud. It isn’t exciting. It isn’t full of adrenaline and big calls.
Good trading is quiet, repetitive, and frankly, a little boring. It’s built on discipline, not drama. Your job is to manage risk, protect your capital, and let time do its work.
There is no holy grail. There is only process. A process you can repeat with a clear head, day after day, year after year, without losing yourself in the noise.
Wins will come. Losses will come. Neither defines who you are. What defines you is how you respond.
⦿ Can you stay calm after a red day?
⦿ Can you follow your plan even after a mistake?
⦿ Can you sit on your hands when there’s nothing to do and trust the work you’ve already done?
Patience, in the end, is the real edge. Most won’t have it.
They’ll bounce between strategies, searching for certainty where none exists. They’ll burn out chasing shortcuts. They’ll forget that progress comes through small, steady steps taken over years, not through chasing big wins.
Trading is a mirror. It reflects your fear, your greed, your impatience. It shows you who you really are. Ignore what it reveals and you’ll keep paying for the same lesson until you finally learn it.
In the end, this game isn’t about the market. It’s about YOU.
⦿ Learn to protect yourself.
⦿ Learn to sit with boredom.
⦿ Learn to lose well.
⦿ Learn to wait without losing faith.
If you can do that, the market has a way of rewarding you in time.
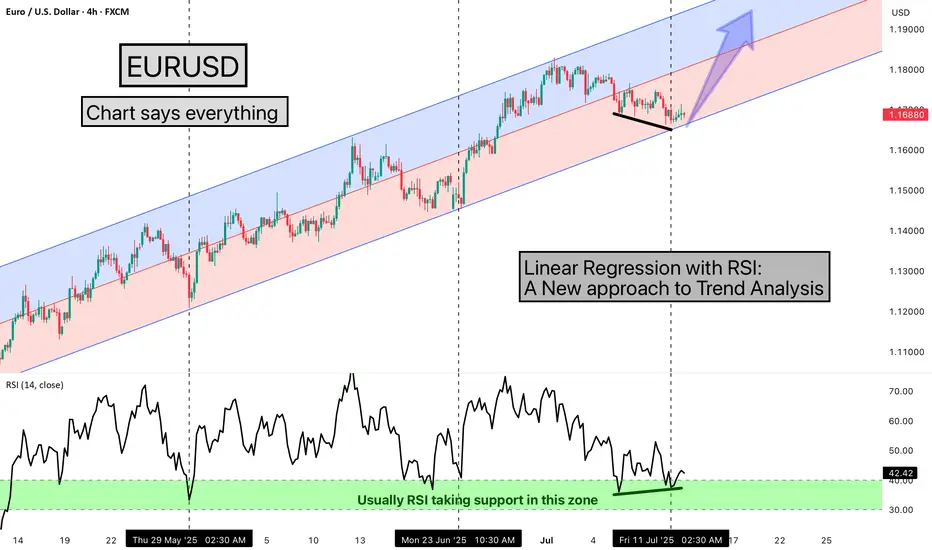
Linear Regression with RSI: A New approach to Trend AnalysisHello Friends,
Welcome to RK_Chaarts,
Today we are going to learn one Method of analysing the chart, here we are using EURUSD chart, and the method we're using is very simple & interesting, We are using the Linear Regression Trend Channel & Relative Strength Index (RSI), What happens in this method, is that we identify a particular zone where the price is making a one-sided move, like if the price is trending upwards, making higher highs and higher lows. We then apply a regression channel to it, and within that channel, we set internal deviation for the upper and lower sides, like 2 or 2.5 or 3 etc., whatever setting it takes.
In this chart, we can clearly see that the 2.5 setting is forming a complete channel, which we've applied for the last two months, from 12th May 2025, when the uptrend started. We've used the 4-hour time frame chart and the RSI. Every time the price hits the bottom of the channel, we can see that the RSI also enters the same zone, between 30-40, and from there, it bounces back.
Currently, the price has again hit the bottom of the regression channel, and the RSI has also gone below 40, between 30-40. And the good thing is that we're seeing a positive divergence in the RSI. So, there's a high possibility that the price might bounce back from here.
It's worth watching what happens next in the market. Nothing is guaranteed here; everything is a game of probabilities. This is one method that we often use, and its results have given us a very good experience. So, let's see what happens next in this chart. This observation is also a good learning experience, which we often encounter, 7-8 times out of 10, in favor of the market, but sometimes it doesn't work, maybe 2-3 times, when the trend changes. So, let's see what happens next.
This post is shared purely for educational purpose & it’s Not a trading advice.
I am not Sebi registered analyst.
My studies are for educational purpose only.
Please Consult your financial advisor before trading or investing.
I am not responsible for any kinds of your profits and your losses.
Most investors treat trading as a hobby because they have a full-time job doing something else.
However, If you treat trading like a business, it will pay you like a business.
If you treat like a hobby, hobbies don't pay, they cost you...!
Hope this post is helpful to community
Thanks
RK💕
Disclaimer and Risk Warning.
The analysis and discussion provided on in.tradingview.com is intended for educational purposes only and should not be relied upon for trading decisions. RK_Chaarts is not an investment adviser and the information provided here should not be taken as professional investment advice. Before buying or selling any investments, securities, or precious metals, it is recommended that you conduct your own due diligence. RK_Chaarts does not share in your profits and will not take responsibility for any losses you may incur. So Please Consult your financial advisor before trading or investing.
Who Should Avoid Trading? Is That You? Ask YourselfThere is no doubt that trading is the simplest business in the world. You just need to do a small paperwork which is online these days, need a laptop or PC and an internet connection. Besides that, all you need is time. But here the simplest should not be confused with the Easy. Although you just need a mouse click for execution yet the decision-making process in the background confuses you and leads to hasty or delayed mouse clicks most of the time.
Perhaps anybody can start trading at will but in my opinion, followings are a few cases where short term trading should be avoided.
If you are not Rich then avoid...
Yes, you read it correct. It is rich people’s game. If you don’t have huge money to back you up, you have less probability of success in this business. A small example. I know these days index option trading is in trend. You can buy an option in under 10,000 rupees but the darker reality is that most people starting with small capital are losing money. All brokers in India warns you about this when you open your trading terminal and that is for a reason.
Options are hedging instruments, if you are buying them naked with a small capital then you are going to lose because of Greeks- Theta to be more precise.
If you don’t have 5 to 10 lakh spares that you are willing to lose without a strain on head, then don’t do this business. Depositing small capital again and again in your trading account is not going to work.
If you want to get rich quick then avoid...
Everybody choosing short term trading wants to be rich overnight- dreaming of buying a tradable instrument at 10 rupees and selling at 1000. Sadly, most of those thinkers are getting poor and poor day by day. Trading is not a ‘get rich quick’ business, it is all about slow and gradual learning and execution with discipline. This is not lottery or casino, you need to build your capital gradually. This way you learn at each and every step.
Even if you make huge money in a few trades or a few days, there are higher chances that you will lose it in lesser number of trades or days. Money earned in haste leads to hasty decisions. Excitement and lack of experience kills. Experience is not about -how many trades you made in a year, it’s about - on how many mistakes you worked in a year.
If you are stubborn to change your mindset then avoid...
Mindset matters the most in trading. If the following runs in your mind while trading, then you have a lot of work to do on your mindset.
I am always correct, I can never be wrong, this trade must work, this strategy must work…
I can never be correct, I am always wrong, this trade is going to lose, this strategy is not going to work…
In reality, market does not care what you think. It keeps doing what it has to. You just need an Edge and a focus on its execution. This is all what you have in your hands. Neither the market is not going to trend because you are riding that trend, nor it is going to reverse because you think it is going to reverse. It's all about trades going Right and trades going Wrong. Thinking about those in terms of probability might work.
If you are new, start working on your mindset right away but if you are in this business for a decent amount of time and still losing then you are stubborn to change.
If you do not have a side income then avoid...
This business demands money. Initially you are bound to lose. It’s a learning process or fee that you need to pay to the market. You can’t pay your bills from trading, at least in your initial phase. I am not talking about those with the beginner’s luck.
These losses can go for even for months and you need a backup which could be any side business or support that can feed your monthly expenditures and refill your trading account as well. Paper trading could be a solution, but real trading is truly different. Emotions play their role when real money is involved and that often lead to unwanted results.
Also, always have a Plan B. Give some stipulated time to trading and if it does not work in that much time, move to your side business.
If you are not willing to lose then avoid...
Aspiring for short term trading and not willing to lose? Then sorry my friend, don’t even give it a try.
As I said in the above paragraphs, you will lose money when you trade for short term because trades will go against you several times. If you keep on holding those losing trades in hope, you will lose more by the end of day or week. A simple stop loss could be a solution. Calculate how much you can risk on a trade and identify your SL and position size according to that. Put a hard SL in the system and that’s it.
If you have 'don’t want to lose' attitude, then short term trading is not for you.
I just hope this article would help some aspiring buds in their trading journy.
Do like and comment to motivate for more writeups in future.
Regards

Brain Hunts, Wallet Hurts!In this brief article, I aim to throw some light upon a typical trader's psychology, which is often swayed by greed and fear, and the constant battle between careful analysis and impulsive decisions.
Traders who actually trade and not just analyze understand that the stock market is not merely a game of numbers- it’s a psychological battlefield where your own mind can turn into your sneakiest opponent.
You’ve got your charts, your indicators, and your gut screaming at you, but many a times, your prediction could be a game spoiler. That little voice in your head saying, “I’ve got this figured out,” can lead you straight into a trap.
Let’s break this down with two classic trader blunders (of course there are more) and sprinkle in some brain science to see why we keep doing this to ourselves and how to fight back.
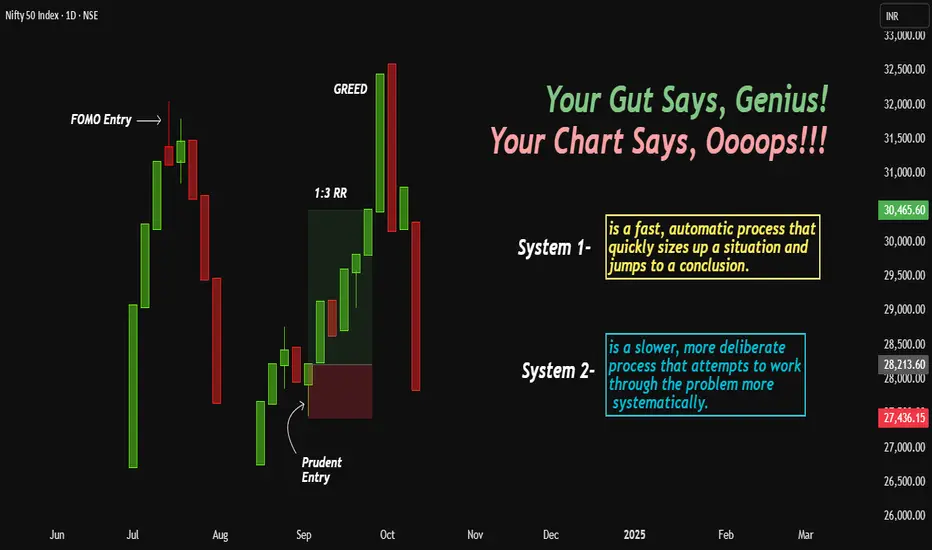
Situation 1: The Pullback That Never Came
Imagine a situation when you’ve been watching a stock like a hawk, waiting for that sweet dip to jump in. But the price keeps climbing, and you’re sitting there, twisting your hands, grunting, “It’s going to pull back soon”.
Then, your patience snaps and you say, “screw it, this thing’s not dropping anytime soon- I’m calling it”. You hit the buy button at what turns out to be the tippy-top, proudly predicting endless upside. Perfect moment when the whole universe starts laughing in your face while the price tanks the second your order fills, and you’re left holding a bag heavier than your ego.
What happened here? System 1 of your brain- the impulsive hotshot- got tired of waiting and convinced you the pullback was a myth. Meanwhile, System 2, the slow-mo logical analyst- was napping on the job, too lazy to double-check the trend or your risk plan.
The result? A prediction born from frustration, not facts, and a bruised trading account to show for it (see the first figure on chart)
Situation 2: Going to the Moon Call
Now imagine when you nail a trade with a solid 1:3 risk-reward setup. The price hits your target and you are high-fiving yourself in your head. But wait, the momentum is insane! The chart’s practically vertical, and your inner fortune-teller pops up saying: “this is just the beginning, it’s going way higher.”
So, you ignore the initial 1:3 profit button, predicting a jackpot just around the corner. But caution- the market doesn’t care about your crystal ball. The price may fall faster than the Adam's apple, and you will be booking a loss instead of sipping champagne (see figure 2 in the chart).
Here’s the brain glitch:
System 1, that greedy adrenaline hotshot, saw the momentum and screamed, “More, more, more!”.
System 2, the voice of reason, should’ve stepped in with, “Hey, dummy, take the win- you hit your target.” But nope, Mr.1 is drowned in the thrill of that chase. Your prediction wasn’t analysis, it was hope dressed up as logic.
The Psychology Behind the Madness
Our brains are wired into two systems, straight out of Daniel Kahneman’s book.
System 1 is the lightning bolt- emotional, instinctive, and prone to jumping the gun.
System 2 is the nerdy analytical- slow, deliberate, and obsessed with data.
Trading is tough because the market moves fast and System 1 loves to take on the wheel, especially when predictions feel like a superpower. Problem is, it’s usually guessing and not knowing. System 2, meanwhile, gets lazy unless you force it to wake up and do the math.
How to Outsmart Yourself
So, how do you stop your predictions from stabbing you in the back?
Lean harder on System 2. Build a trading plan with clear rules—entry points, exits, profit targets—and stick to it religiously. When your senses are itching to predict the next big move, pause!!! Ask yourself, “Is this my gut talking, or my chart?”
Needless to mention, the market doesn’t care what you think, and it will do what it is going to do anyway. Your job is not to outguess or outsmart it, your job is to outthink yourself. So, next time you’re about to bet on a hunch, give System 2 its fair chance. Your trading account will thank you and you might just sleep better at night 🙂
I hope you like the writeup.
Do like and comment if you feel necessary.
Effective inefficiencyStop-Loss. This combination of words sounds like a magic spell for impatient investors. It's really challenging to watch your account get smaller and smaller. That's why people came up with this magic amulet. Go to the market, don't be afraid, just put it on. Let your profits run, but limit your losses - place a Stop-Loss order.
Its design is simple: when the paper loss reaches the amount agreed upon with you in advance, your position will be closed. The paper loss will become real. And here I have a question: “ Does this invention stop the loss? ” It seems that on the contrary - you take it with you. Then it is not a Stop-Loss, but a Take-Loss. This will be more honest, but let's continue with the classic name.
Another thing that always bothered me was that everyone has their own Stop-Loss. For example, if a company shows a loss, I can find out about it from the reports. Its meaning is the same for everyone and does not depend on those who look at it. With Stop-Loss, it's different. As many people as there are Stop-Losses. There is a lot of subjectivity in it.
For adherents of fundamental analysis, all this looks very strange. I cannot agree that I spent time researching a company, became convinced of the strength of its business, and then simply quoted a price at which I would lock in my loss. I don't think Benjamin Graham would approve either. He knew better than anyone that the market loved to show off its madness when it came to stock prices. So Stop-Loss is part of this madness?
Not quite so. There are many strategies that do not rely on fundamental analysis. They live by their own principles, where Stop-Loss plays a key role. Based on its size relative to the expected profit, these strategies can be divided into three types.
Stop-Loss is approximately equal to the expected profit size
This includes high-frequency strategies of traders who make numerous trades during the day. These can be manual or automated operations. Here we are talking about the advantages that a trader seeks to gain, thanks to modern technical means, complex calculations or simply intuition. In such strategies, it is critical to have favorable commission conditions so as not to give up all the profits to maintaining the infrastructure. The size of profit and loss per trade is approximately equal and insignificant in relation to the size of the account. The main expectation of a trader is to make more positive trades than negative ones.
Stop-Loss is several times less than the expected profit
The second type includes strategies based on technical analysis. The number of transactions here is significantly less than in the strategies of the first type. The idea is to open an interesting position that will show enough profit to cover several losses. This could be trading using chart patterns, wave analysis, candlestick analysis. You can also add buyers of classic options here.
Stop-Loss is an order of magnitude greater than the expected profit
The third type includes arbitrage strategies, selling volatility. The idea behind such strategies is to generate a constant, close to fixed, income due to statistically stable patterns or extreme price differences. But there is also a downside to the coin - a significant Stop-Loss size. If the system breaks down, the resulting loss can cover all the earned profit at once. It's like a deposit in a dodgy bank - the interest rate is great, but there's also a risk of bankruptcy.
Reflecting on these three groups, I formulated the following postulate: “ In an efficient market, the most efficient strategies will show a zero financial result with a pre-determined profit to loss ratio ”.
Let's take this postulate apart piece by piece. What does efficient market mean? It is a stock market where most participants instantly receive information about the assets in question and immediately decide to place, cancel or modify their order. In other words, in such a market, there is no lag between the appearance of information and the reaction to it. It should be said that thanks to the development of telecommunications and information technologies, modern stock markets have significantly improved their efficiency and continue to do so.
What is an effective strategy ? This is a strategy that does not bring losses.
Profit to loss ratio is the result of profitable trades divided by the result of losing trades in the chosen strategy, considering commissions.
So, according to the postulate, one can know in advance what this ratio will be for the most effective strategy in an effective market. In this case, the financial result for any such strategy will be zero.
The formula for calculating the profit to loss ratio according to the postulate:
Profit : Loss ratio = %L / (100% - %L)
Where %L is the percentage of losing trades in the strategy.
Below is a graph of the different ratios of the most efficient strategy in an efficient market.
For example, if your strategy has 60% losing trades, then with a profit to loss ratio of 1.5:1, your financial result will be zero. In this example, to start making money, you need to either reduce the percentage of losing trades (<60%) with a ratio of 1.5:1, or increase the ratio (>1.5), while maintaining the percentage of losing trades (60%). With such improvements, your point will be below the orange line - this is the inefficient market space. In this zone, it is not about your strategy becoming more efficient, you have simply found inefficiencies in the market itself.
Any point above the efficient market line is an inefficient strategy . It is the opposite of an effective strategy, meaning it results in an overall loss. Moreover, an inefficient strategy in an efficient market makes the market itself inefficient , which creates profitable opportunities for efficient strategies in an inefficient market. It sounds complicated, but these words contain an important meaning - if someone loses, then someone will definitely find.
Thus, there is an efficient market line, a zone of efficient strategies in an inefficient market, and a zone of inefficient strategies. In reality, if we mark a point on this chart at a certain time interval, we will get rather a cloud of points, which can be located anywhere and, for example, cross the efficient market line and both zones at the same time. This is due to the constant changes that occur in the market. It is an entity that evolves together with all participants. What was effective suddenly becomes ineffective and vice versa.
For this reason, I formulated another postulate: “ Any market participant strives for the effectiveness of his strategy, and the market strives for its own effectiveness, and when this is achieved, the financial result of the strategy will become zero ”.
In other words, the efficient market line has a strong gravity that, like a magnet, attracts everything that is above and below it. However, I doubt that absolute efficiency will be achieved in the near future. This requires that all market participants have equally fast access to information and respond to it effectively. Moreover, many traders and investors, including myself, have a strong interest in the market being inefficient. Just like we want gravity to be strong enough that we don't fly off into space from our couches, but gentle enough that we can visit the refrigerator. This limits or delays the transfer of information to each other.
Returning to the topic of Stop-Loss, one should pay attention to another pattern that follows from the postulates of market efficiency. Below, on the graph (red line), you can see how much the loss to profit ratio changes depending on the percentage of losing trades in the strategy.
For me, the values located on the red line are the mathematical expectation associated with the size of the loss in an effective strategy in an effective market. In other words, those who have a small percentage of losing trades in their strategy should be on guard. The potential loss in such strategies can be several times higher than the accumulated profit. In the case of strategies with a high percentage of losing trades, most of the risk has already been realized, so the potential loss relative to the profit is small.
As for my attitude towards Stop-Loss, I do not use it in my stock market investing strategy. That is, I don’t know in advance at what price I will close the position. This is because I treat buying shares as participating in a business. I cannot accept that when crazy Mr. Market knocks on my door and offers a strange price, I will immediately sell him my shares. Rather, I would ask myself, “ How efficient is the market right now and should I buy more shares at this price? ” My decision to sell should be motivated not only by the price but also by the fundamental reasons for the decline.
For me, the main criterion for closing a position is the company's profitability - a metric that is the same for everyone who looks at it. If a business stops being profitable, that's a red flag. In this case, the time the company has been in a loss-making state and the size of the losses are considered. Even a great company can have a bad quarter for one reason or another.
In my opinion, the main work with risks should take place before the company gets into the portfolio, and not after the position is opened. Often it doesn't even involve fundamental business analysis. Here are four things I'm talking about:
- Diversification. Distribution of investments among many companies.
- Gradually gaining position. Buying stocks within a range of prices, rather than at one desired price.
- Prioritization of sectors. For me, sectors of stable consumer demand always have a higher priority than others.
- No leverage.
I propose to examine the last point separately. The thing is that the broker who lends you money is absolutely right to be afraid that you won’t pay it back. For this reason, each time he calculates how much his loan is secured by your money and the current value of the shares (that is, the value that is currently on the market). Once this collateral is not enough, you will receive a so-called margin call . This is a requirement to fund an account to secure a loan. If you fail to do this, part of your position will be forcibly closed. Unfortunately, no one will listen to the excuse that this company is making a profit and the market is insane. The broker will simply give you a Stop-Loss. Therefore, leverage, by its definition, cannot be used in my investment strategy.
In conclusion of this article, I would like to say that the market, as a social phenomenon, contains a great paradox. On the one hand, we have a natural desire for it to be ineffective, on the other hand, we are all working on its effectiveness. It turns out that the income we take from the market is payment for this work. At the same time, our loss can be represented as the salary that we personally pay to other market participants for their efficiency. I don't know about you, but this understanding seems beautiful to me.

The Ascending Triangle Pattern: A Bullish Continuation GuideHello Traders!
In today's post, we’ll explore the Ascending Triangle Pattern , one of the most reliable bullish continuation patterns that traders look for during uptrends . It’s an important tool for identifying potential breakout points in trending markets. If you want to learn how to trade these breakouts effectively, mastering the Ascending Triangle is essential.
Chart Pattern: The Ascending Triangle is a strong bullish continuation pattern. In the case of ASIAN PAINTS LTD , we see the price action forming a flat resistance at the top and a rising upward sloping support at the bottom, indicating that the bulls are gradually taking control of the stock.
Key Points to Note:
The stock is respecting the flat resistance , which has been tested multiple times (marked by the red circles).
The upward sloping support is strengthening with each new low, showing growing buying pressure.
The price has recently broken out above the resistance , confirming the breakout pattern.
Trading Strategy:
Entry Point : Once the price breaks the resistance level, consider entering at 1,172.45 .
Stop Loss : Set your stop loss just below the upward sloping support at 1,151.25 to manage risk.
Profit Target : The ideal target after the breakout is approximately 1,261.65 , which is calculated by measuring the height of the triangle and projecting it upward from the breakout point.
Real-World Application:
This is a bullish setup , and traders should keep an eye on volume confirmation post-breakout. A breakout with increased volume would make the setup even stronger. A price move towards the target of 1,261.65 would indicate a successful breakout trade.
Risk Management:
Ensure that you follow your stop loss at 1,151.25 to avoid unnecessary losses in case the breakout fails.
Position size properly to align with your risk tolerance and the potential reward.
What This Means for Traders:
Bullish Setup : The ascending triangle signals that the bulls have control, and we expect the stock to continue higher.
Watch for confirmation of the breakout and enter with confidence, but always be prepared with your stop loss.
Conclusion:
This ascending triangle is a classic pattern, and it offers a great opportunity for long traders . Keep an eye on the breakout, manage your risk, and this trade could potentially yield solid returns.

Investing in ETFs made simple 101Hello,
Investing in Exchange-Traded Funds (ETFs) can be challenging, especially for beginners who may struggle with selecting the right funds, understanding market trends, and managing risks. With thousands of ETFs available, covering various asset classes, sectors, and investment strategies, it can be overwhelming to determine which ones align with your financial goals. Factors such as expense ratios, liquidity, underlying assets, and market conditions all play a crucial role in making an informed decision.
To simplify this process, we have carefully analyzed and selected a number of ETFs that we believe offer strong potential for growth, diversification, and long-term value. Below, we highlight these ETFs and explain why they could be good investment choices.
ISHARES CORE S&P 500 UCITS ETF U.S. DOLLAR - ISHARES VII PLC
FUND OVERVIEW
The Fund seeks to track the performance of an index composed of 500 large cap U.S. companies.
• Asset Class: Equity (Focused on large caps)
• Accumulation ETF
• Unit price: $643.82
• Benchmark: S&P 500
• Expense ratio: 0.07
Top 10 holdings
• Apple: 7.59%
• Nvidia Corp: 6.61%
• Microsoft Corp: 6.29%
• Amazon Inc.: 4.12%
• Meta platforms: 2.56%
• Tesla: 2.26%
• Alphabet: 2.22%
• Broadcom Inc.: 2.17%
• Alphabet Inc: 1.82%
• Berkshire Hathaway Inc.: 1.67%
Why we think this is a good ETF to have
The iShares Core S&P 500 UCITS ETF (Acc) offers investors a cost-effective way to gain exposure to the 500 largest U.S. companies across various sectors. As a passively managed fund, it seeks to replicate the performance of the S&P 500 Index, making it an excellent choice for those looking for broad market diversification. Having an accumulating structure, dividends are reinvested, maximizing long-term returns through compounding. The fund is managed by Blackrock and is domiciled in Ireland.
SPDR MSCI WORLD COMMUNICATION SERVICES UCITS UCITS ETF USD Acc
Fund Objective
The investment objective of the Fund is to track the performance of companies in the Communication Services sector, across developed markets globally. The MSCI World Communication Services 35/20 Capped Index measures the performance of global equities that are classified as falling within the Communication Services sector, as per the Global Industry Classification Standard (GICS).
• Investment Manager: State Street Global Advisors Europe Limited
• Asset Class: Equity (Focused on companies in the Communication Services sector)
• Accumulation ETF
• Unit price: $67.15
• Benchmark: MSCI World Communication Services 35/20 Capped Index
• Expense ratio:
Top 10 holdings
• Meta Platforms Inc-Class A 18.58
• Alphabet Inc-Cl A 18.30
• Alphabet Inc-Cl C 15.80
• Netflix Inc 7.81
• Walt Disney Co/The 4.11
• Verizon Communications Inc 3.43
• At&T Inc 3.33
• Comcast Corp-Class A 2.96
• T-Mobile Us Inc 2.36
• Deutsche Telekom Ag-Reg 2.13
Fund performance
Why we think this is a good ETF to have
The technology, media, and communications sector is likely to benefit significantly under a Trump presidency. While the tech industry has faced antitrust scrutiny in recent years, Trump has largely ignored or downplayed these cases. His reluctance to support antitrust actions against media giants has indirectly favored them and is expected to continue doing so. During Trump’s inauguration, top tech CEOs were given VIP seats ahead of even some cabinet members, signaling his close ties to the industry. Additionally, Trump owns his own social media platform, "Truth Social," while his close ally, Elon Musk, owns "X." Any restrictive regulations imposed on the sector would directly impact these platforms, making it less likely that heavy-handed policies will be introduced.
A day after his inauguration, Trump announced a major initiative to expand artificial intelligence infrastructure in the U.S., calling it the largest buildout of its kind in history. These factors collectively suggest strong growth prospects for the tech sector under his leadership. Given this favorable outlook, we see an opportunity to invest in an ETF with significant exposure to this sector.
ISHARES GLOBAL HEALTHCARE ETF
Investment objective
The iShares Global Healthcare ETF seeks to track the investment results of an index composed of global equities in the healthcare sector.
• Asset Class: Equity (Focused on the healthcare sector)
• Unit price: $92.57
• Benchmark: S&P Global 1200 Healthcare Sector Index
• Expense ratio: 0.41%
Top holdings
• Eli Lilly- 8.72%
• United Health group Inc- 6.68%
• Johnson & Johnson- 4.74%
• AbbVie Inc- 4.51%
• Novo Nordisk- 3.88%
• Merck & co Inc- 3.61%
• AstraZeneca PLC- 2.92%
• Thermo Fisher scientific Inc- 2.86%
• Roche holding par AG- 2.84%
• Abbott laboratories- 2.82%
Why we think this is a good ETF to have
Investing in a healthcare ETF right now could be especially promising given the anticipated direction of U.S. healthcare policy under President Donald Trump. The administration is expected to stick to its strong deregulation agenda while keeping healthcare access and cost management at the forefront. Looking ahead, the Trump administration intends to uphold campaign promises for the health sector with four key themes: Promote access to healthcare via market competition and transparency, enhance flexibility and choice in healthcare to states and individuals, focus on deregulation by reversing or modifying Biden-era policies and Enhance national security with “America first” principles.
While there is a possibility that efforts to lower drug prices and boost competition might counterbalance some deregulation benefits, the overall push for a more dynamic, less regulated market suggests significant upside potential. For investors, this means your healthcare ETF could stand to gain from a regulatory environment that encourages innovation, speeds up market entry for new products, and drives overall industry growth. We see an opportunity to tap into a changing regulatory landscape with high potential for growth and innovation through investing in the Ishares Global Healthcare ETF.
VANGUARD FINANCIALS ETF
Investment Objective
The fund seeks to track the performance of the MSCI US Investable Market Index (IMI)/Financials 25/50, investing in multi-cap equity within the financials sector. It is passively managed, employing a full-replication strategy when possible, but resorts to a sampling approach if regulatory constraints arise to maintain the index’s key characteristics. The fund remains fully invested, with low expenses helping to minimize net tracking error.
Asset Class: Equity (Focused on the US financial sector)
Unit price: $126.28
Benchmark: MSCI US Investable Market Index (IMI)/Financials 25/50
Expense ratio: 0.10%
Dividend schedule: Quarterly
Ten largest holdings
JPMorgan Chase & Co. 8.7 %
Berkshire Hathaway Inc. 7.7 %
Mastercard Inc. 5.5 %
Visa Inc. 4.8 %
Bank of America Corp. 3.9 %
Wells Fargo & Co. 3.1 %
Goldman Sachs Group Inc. 2.3 %
American Express Co. 2.2 %
S&P Global Inc. 2.0 %
Morgan Stanley 1.9 %
PERFORMANCE
Why we think this is a good ETF to have
Optimism is building for more deal making in a Trump presidency, with activity showing signs of life. After a relatively low year in global mergers & acquisitions in 2023, 2024 witnessed a moderate uptick as the pandemic receded further into the rear-view mirror, the U.S. economy stabilized, inflation declined, financing markets brightened, albeit modestly, and equity markets climbed ever higher. While the business grew in 2024, heightened regulatory enforcement, among other factors, led to fewer very large transactions. The return of President-elect Donald Trump to the White House, with the Republican party having majorities in both houses of the U.S. Congress, is expected to bring a more business-friendly, deregulatory approach to policymaking, and further solidifies widespread expectations among market participants that M&A activity will increase in 2025. The Vanguard Financials ETF gives you exposure to the financial sector at a low cost. Given the above, we see opportunity in owning the ETF.
All the above information has been compiled from
ETF screener: in.tradingview.com
ETF news: in.tradingview.com & in.tradingview.com
ETF ideas: in.tradingview.com
Good luck

The Budget Effect- Key ObservationsThe market often reacts to major political or economic events, with people setting high expectations. These expectations, whether positive or negative, lead to wild market swings and hence higher volatility. However, when you take a look at the Nifty’s long-term chart, you’ll see that the impact of such events tends to be pretty small within the overall market structure. During a strong bull market, the market usually absorbs a big negative news. There might be a short-term dip, but within a few weeks or months, things typically stabilize, and the market resumes its upward trend.
With the budget announcement coming up tomorrow, here are some key observations based on the budget’s impact on the market over the last five years, both in the short-term and long-term perspective:
🔘 Budget Week Trend: The market has generally closed higher in the budget week (meaning the close was above the open), except in 2020 when it ended in the red. Based on this, there are good chances that the market could close green this week as well.
🔘 Post-Budget Market Behavior: After the budget news, the market has mostly resumed its prior short-term trend, except in 2020. Here’s a quick note of what happened in previous years:
2021: The market consolidated for 11 weeks before bouncing back and resuming into its strong bull trend.
2022: The market was in a bearish phase from late 2021 and continued that trend for 19 weeks after the budget, despite some strong rallies in between.
2023: The short-term downtrend continued for another 7 weeks after the budget.
2024: The market consolidated for 15 weeks before picking up the bullish trend again.
2025: Since September 2024, we’ve been in a downtrend, so based on the last four years observations, it seems likely this short-term downtrend could continue for a few more weeks.
🔘 Breaking the Budget week Low: If the market is already in a correction before the budget, there's a chance it could dip further if the budget week low is breached.
🔘 Breaking the Budget Week High: Just because the market breaks above the budget week high doesn’t necessarily means we are going for a big rally. It could also lead to consolidation or a continuation of a short-term downtrend until a higher high is established. In 2025, any bullish move below 24858 would not confirm a change in short term trend.
🔘 Long-Term Bullish Trend: In all of the past years, after the short-term effects of the news is over, the market has resumed its longer-term bullish trend.
Now this is up to a trader how he interprets these observations. A short-term trader might be looking for short term moves and short the rallies, whereas a long-term trader will focus on the long-term bullish trend and buy the pullbacks.
So, what’s your approach? Feel free to drop a comment below, and don’t forget to like or share if you want more educational content in the future.

How to define the Daily Bias for the Day? Determining the likely direction of the market for a particular day can be both challenging and cumbersome. Many traders find themselves overwhelmed by the multitude of data points and differing indicators. However, using a structured methodology, one can systematically analyze the chart and create a daily bias for the day.
If you are an intraday trader, you can use a combination of the Daily chart for the bias and the 15-minute chart for the entry, or alternatively, you can use a 75-minute chart for the bias and a 5-minute chart for the entry.
Steps to Identify the Daily Bias
1. Identify the Most Recent Swing High and Swing Low
The first step in defining the daily bias involves identifying the most recent swing high and swing low. This can be done manually, or you can use ready-made indicators available on trading platforms such as TradingView to plot these points on the chart. Understanding swing highs and lows are fundamental concepts in technical analysis, representing the highest and lowest points within a specific time period. These points can indicate potential reversal areas where the market may change direction.
2. Divide the Region into Two Equal Parts
Once the swing high and swing low are identified, the next step is to divide this region into two equal parts. This can be achieved using the rectangle tool in TradingView. Make sure to enable the middle line feature within the rectangle tool to visually divide the two sections. The middle line acts as a crucial reference point, providing a clear visual boundary between areas of perceived higher and lower value.
3. Define Retail and Wholesale Areas
After dividing the region into two parts, the upper section is termed the “Retail Area,” where prices are considered expensive. Conversely, the lower section is called the “Wholesale Area,” where prices are deemed cheap. This concept stems from the basic economic principle of supply and demand, where higher prices in the Retail Area suggest selling opportunities, and lower prices in the Wholesale Area indicate buying opportunities.
4. Focus on Buying and Selling Opportunities
With the areas defined, the next step is to focus on the appropriate trading opportunities. When prices are in the Retail Area, the focus should be on “Selling” opportunities. When prices are in the Wholesale Area, the focus should be on “Buying” opportunities. This methodology, known as “Curve Analysis” or determining your Bias for the day, simplifies the decision-making process by providing a clear framework for evaluating market conditions.
Example: BankNifty 75-Minute Chart
Let’s look at an example to understand this better. Here we have the BankNifty 75-minute chart. We have identified the most recent swing high and swing low on the chart and divided the section into two parts. The current market price is in the Wholesale Area, which means that on your execution time frame, which is 5 minutes, you will be focusing on buying or “Long” opportunities.
Now, proceed to the lower time frame and identify your key levels of interest using support, resistance, demand, supply, or any other technical analysis tools. Observe how the supply zone on the chart played out beautifully and how prices fell from the Retail Area. This example illustrates the practical application of the methodology, demonstrating how historical price movements can inform future trading decisions.
While the above steps provide a solid foundation for defining the daily bias, incorporating the following advanced tips can enhance your trading efficiency:
1. Use Multiple Time Frames
Integrate multiple time frames to gain a comprehensive view of the market. For example, use the Daily chart to determine the overall bias and the 15-minute or 5-minute chart for precise entries and exits. This multi-time frame analysis allows traders to align shorter-term trades with the broader market trend, increasing the likelihood of successful outcomes.
2. Incorporate Technical Indicators
Employ technical indicators such as Moving Averages, RSI, and MACD to corroborate your bias. Confirming signals from multiple sources can provide greater confidence in your trades. These indicators serve as additional tools to validate the defined bias, offering insights into market momentum, overbought or oversold conditions, and potential trend reversals.
3. Monitor Economic News
Stay updated with economic news and events that could influence market movements. Important news releases can cause significant price fluctuations, impacting your defined bias. Economic indicators, such as GDP reports, employment data, and central bank announcements, can have profound effects on market sentiment and price action.
4. Practice Risk Management
Always practice sound risk management strategies. Define your risk tolerance levels and use stop-loss orders to protect your capital. Never risk more than you can afford to lose on any single trade. Effective risk management involves setting appropriate position sizes, diversifying trades, and adhering to pre-defined risk parameters to safeguard against unforeseen market movements.
5. Keep a Trading Journal
Maintain a trading journal to record your trades, strategies, and outcomes. Analyzing past trades can help you refine your methodology and improve future performance. A detailed journal provides valuable insights into trading patterns, strengths, and areas for improvement, fostering continuous learning and development.
Conclusion
Defining the daily bias for the day is crucial for successful intraday trading. By following the structured steps of identifying swing highs and lows, dividing the price region into Retail and Wholesale areas, and focusing on appropriate buying and selling opportunities, traders can streamline their market analysis. Remember to use multiple time frames, incorporate technical indicators, stay informed about economic news, practice risk management, and maintain a trading journal. With these strategies in place, you can effectively navigate the markets and enhance your trading performance.
I hope you all find this article useful. Do give your valuable feedback in the comments section.

What is Object Tree and it's UsesHi mates kindly watch the video for understanding the Object tree and it's uses in technical analysis as i feel the new entrants to technical analysis still might not know about it, I hope you will like this publication,
Thanks for watching and giving your time.
Best regards- Amit

From Novice to Pro: Navigating Support & Resistance Like a BossGreetings to all. I trust that you are all thriving in both your personal lives and trading endeavors. Today, I present educational content aimed at understanding the concepts of support and resistance in chart analysis.
Support and resistance are key concepts in technical analysis used to identify potential price levels where an asset's price might reverse, stall, or consolidate. They are often visualized on a price chart and are critical for traders making decisions about entry, exit, and stop-loss levels.
1. Support:
Definition: Support is a price level at which a downward trend may pause or reverse due to a concentration of buying interest.
Why it works: Traders perceive this level as a "bargain," increasing demand and preventing further price drops.
Visualization: On a chart, support levels often appear as a horizontal line or a sloping line below the current price where previous price action reversed or consolidated.
Breakthroughs: If the price breaks below a support level, it may indicate a continuation of the downtrend.
2. Resistance:
Definition: Resistance is a price level where an upward trend might pause or reverse due to selling pressure or profit-taking.
Why it works: Traders perceive this level as "expensive," reducing demand and increasing selling activity.
Visualization: On a chart, resistance levels are horizontal or sloping lines above the current price where the price struggled to move higher in the past.
Breakthroughs: If the price breaks above a resistance level, it may indicate the start of a new upward trend.
Common Characteristics of Support and Resistance:
Role Reversal: Once a support level is broken, it often becomes a new resistance level, and vice versa.
Psychological Levels: Round numbers (e.g., $50, $100) often act as strong support or resistance due to psychological significance.
Volume Confirmation : High trading volume near these levels reinforces their strength.
Types of Support and Resistance:
Horizontal Lines: Based on past price action.
Trendlines : Diagonal lines formed by connecting higher lows (support) or lower highs (resistance) in a trend.
Moving Averages: Dynamic levels that adjust with price movement, often acting as support or resistance.
Fibonacci Retracement: Levels based on mathematical ratios indicating potential reversal zones.
How to Use Support and Resistance:
Entry Points: Buy near support levels or after a breakout above resistance.
Exit Points: Sell near resistance levels or after a breakdown below support.
Risk Management: Place stop-loss orders just below support (for long positions) or above resistance (for short positions).
Today, I decided to share some educational content, as my previous posts have primarily focused on trade ideas. I hope that you all would find this educational material valuable and engaging. If you appreciate this type of content, I encourage you to show your support by liking this post and following me for more educational insights in the future.

The GREENS Vs The REDThere are two most important and fundamental questions that every trader should ask to himself and should not put his hard-earned money in the market before answering them.
>> The first one is why more than 95-98% traders lose money in the market?
>> And the second one is How those 2-5% traders are still able to make money in the market?
🤔 Is it about fundamental or technical analysis that fill this gap here or is it something else that is ignored on part of the losing traders?
Well one can be a good analyst who mastered those arts in months or over years but may still lose 🎃 when it comes to real trading.
Social media has made it too easy to learn analysis but trading still keeps its difficult spot in the real world.
The space 📏 between the winners and the losers is surely more about discipline and consistency.
Losers generally lose because of fear or greed.
Fear 😣 could be of missing the trade, so entering too early or could be of losing a winning trade and always exiting with minor profit. Both scenarios lead to damage when trade goes against the expected direction.
Greed 🤑 may result into keep on holding a losing trade in hope or not booking good profit in the hope of more and then booking loss. Greed may also lead to unacceptably higher position sizes or over-trading. One should not forget that greed in a good cause is still greed and can damage capital in trading.
Both greed and fear lead to lousy decision making and hence loss in almost all cases.
Winning approach is more about discipline. It is to know one's reasons for trading. These reasons could be their tested setups- No setup, no trade.
Its also about knowing when to stop 🤚. Stop when a defined loss in a trade reaches or stop when specific number of trades are lost.
Winners 🥇 understand that there is no perfect exit when in profit. Either exit at a target or at least with some profit. Protecting capital, without overtrading, could boosts confidence in future trades.
Hence the task of winning more can be achieved by losing less with the above-mentioned approach. One can also lose less by keeping (acceptably) wider stop and hence limiting the number of trades by by-passing volatility.
I hope this would make sense for some traders.
Do boost 🚀 comment below to get educational ideas more frequently.
Regards.

Classic Double Correction PatternThis is a classic example of Double correction (Double three) in HDFCLIFE.
Marked in the first box, we can see Flat Correction where wave B is retraced to the 81% level. We are fulfilling the minimum requirement (61.8%) of wave B. Here in wave C, we see three waves. This is the first hint of an upcoming complex correction. The whole wave is marked as W here.
In the second box, there is a perfect Zig-zag pattern. Wave B is retraced to 50% here. Also, we can see three waves in wave C, which gives us wave Y.
These two waves are connected by wave X which is retraced to 111%.
This is the best example of Double correction.
This analysis is for educational purposes only.
This analysis is based on Elliott Wave theory and Fibonacci analysis.

HOW TO TAKE TRADE AFTER PRICE BREAKS MAJOR LEVELAdvanced PRICE ACTION Trading
Key Trade Concepts:
Buyer Trap Identification:
Before entering, always check for a buyer trap or liquidity hunt, where impulsive buyers are lured into the market at a vulnerable level. In this setup, I’ve highlighted how a buyer trap has been triggered, providing a strong signal for potential reversals.
Order Block Strategy for Long Entries:
Wait for Price to Enter the Order Block: Before any long position, let price retrace to the designated order block.
Confirm with High Break and Rejection Candle: Once in the order block, wait for recent highs to break, followed by a rejection candle to confirm the entry. A candle close above this level on the 15-minute time frame is essential, adding strength to the confirmation.
Time Frames: Utilize the 5-minute chart for initial moves but rely on a 15-minute candle close for entry confirmation.
Take-Profit (TP):
Target buy-side liquidity and other strategic levels beyond that, maximizing the potential of each setup.
For more professional insights like this, don’t forget to like, follow, and comment. This is the kind of premium content many charge for, but I’m sharing it for free to help others succeed!

5 Important Lessons to Learn From the MarketsYou Can Never Outsmart the Market
Detailed analysis 🧐and strategies are not enough to survive in the market. There are several other economic or geo-political factors that may influence the movement of the market. If market is flying higher due to positive factors, there is no point in going reverse and shorting stocks or indices. Conversely if the market is going down, its good to wait and watch rather than going all in. A popular saying that mostly works in the markets is that a trend🚀 may last longer than you can expect.
Its Stock Market, Not Casino
A few elements like risk management, position management, diversification, research etc. differentiate the Markets from Casino🤑. However, most new traders enter the market with a dream of overnight richness. Social media influencers add fuel to this fire and soon this fire🔥evaporates the entire capital of new traders. One needs to realize that the stock market is a business which will develop and grow gradually.
Stock Market as Primary or Secondary Source of Income?
People from mediocre business or salary class come to the market, make some money with beginner’s luck, become confident, keep increasing capital and become more and more confident😵. Ultimately, they start thinking of quitting their job or ignoring their business. But finally, the dooms days follow, and they start losing and losing till they lose it all. One may think of stock market as a primary source of income if one is profitable for at least a year (3 years would be good though🤔). Secondary sources of income are must because all traders lose in their initial phase. In fact, keep the market as a secondary source for 1-3 years.
Stock Tips Will Burn Your Fingers
Relying on stock tips from friends, news sources, or social media can be risky. Most tips are randomly picked without any research. Blindly following them without conducting your own research would lead to poor investment decisions and must financial losses. Most people have time⏳ constraints, but they must first learn the market nuances by using small capital and making small losses. Improve their knowledge for at least 3-6months and then go for some reliable advisory service. Do your own research on their tips rather than blind👩🦯 faith.
Your Portfolio May Lag in a Bullish Market
Rising market would not always lead to rise in your portfolio. Your portfolio performance may still be stagnant👎 even when the market is up by 15%👍. It all depends upon the performance of your stocks. Its always good to keep blue-chip or good midcap stocks in your portfolio. Generally, they will perform in-line with the indices. Investing in penny stock hoping for a lottery might be highly disappointing and may lead to further worst decisions in future. Self-education📕 is the best investment.
I hope this small effort would help some new traders.
All views are personal.
Keep boosting 🚀for more educational content in future.

Combining Fundamental & technical Analysis to pick great stocksHello,
One of the most often asked question is how I conduct my market research and today I will be trying to answer the question in a simple way. Below is my process flow
1: Screening Potential Stocks
Purpose: Narrow down the list of stocks to focus on those that meet specific criteria.
Method: Use a stock screener to filter stocks based on factors like market capitalization, industry, financial ratios, etc. Sometimes, I research a stock based on recent developments or personal interest.
For our case you can find the stocks screener via link here www.tradingview.com . This screener allows you to filter stocks across different countries and apply various metrics to find potential investment opportunities.
2: Industry Research
Purpose: Understand the industry landscape and identify key trends.
Method: Use paid services, data terminals, expert insights, and accessible news sources to gather information about the industry. Keeping up-to-date with industry news is crucial for insights.
A great recourse to use when trying to understand the industry is the spark via link www.tradingview.com This will be very key because it simplifies the industry and breaks how the peers are also performing.
3: Assessing Investment Feasibility and Risks
Purpose: Evaluate the feasibility of a company’s plans, potential risks, and its ability to execute effectively.
Method: Examine the company’s strategic priorities, planned capital expenditures, and historical performance. Assess whether the company has a track record of successfully executing similar strategies or acquisitions.
4: Analyzing Financial Performance
Purpose: Understand the company's financial health and value.
Method: Look at long-term ROI metrics, such as Return on Capital Employed (ROCE), Return on Invested Capital (ROIC), and Return on Equity (ROE). Conduct peer analysis by comparing these metrics with similar companies in the industry.
Analyzing a company’s financial statements is key to understanding its performance. TradingView offers a detailed breakdown of financial statements over comparative years. For example, see the financials for Bharti Airtel www.tradingview.com These dashboards include additional metrics that can provide deeper insights into a company's performance.
more metrics to help you better understand the companies are incorporated in the dashboards.
5: Valuation Analysis
Purpose: Determine if the stock is fairly priced relative to its peers and historical data.
Method: Use relative valuation methods, including Price-to-Earnings (P/E) ratio, EV/EBITDA, and Free Cash Flow Yield. Compare these metrics to historical figures and industry benchmarks to assess valuation.
6: Identifying Competitive Advantages (Moat)
Purpose: Find companies with sustainable competitive advantages that protect them from competition.
Method: Identify unique features or barriers that provide the company with a competitive edge. Look for aspects that align with Warren Buffett’s concept of a “moat,” such as brand strength, cost advantages, or proprietary technology.
7: Monitoring and Watchlisting
Purpose: Keep track of potential investment opportunities and be prepared to act on them.
Method: Add promising stocks to a watch list. Monitor their performance and news. Be ready to take advantage of price dips due to market events, ensuring the impact is not material to the company's fundamentals.
8: Organizing and Documenting Research
Purpose: Ensure research is accessible and easy to reference in the future.
Method: Summarize findings in bullet points, using frameworks like SWOT (Strengths, Weaknesses, Opportunities, Threats). Create a checklist of factors to consider for each company, allowing for a structured and repeatable research process.
9: Continuous Review
Purpose: Stay informed and adaptable in investment decisions.
Method: Regularly review research and stock performance to ensure no critical updates are missed. Adjust investment thesis based on new information or changes in the company’s fundamentals.
10: Technical Analysis Using Wave Theory
Purpose: Predict future price movements and identify potential buying or selling opportunities.
Method: Utilize Elliott Wave Theory, which is a form of technical analysis that identifies recurring price wave patterns in financial markets. The theory suggests that market prices move in predictable cycles of five waves (impulsive) and three waves (corrective), driven by investor psychology and market sentiment. By analyzing these wave patterns, traders and analysts can forecast potential market trends and turning points. Combining wave theory with other technical indicators can enhance the accuracy of predictions and support informed decision-making.
the chart shows that the price of the stock is at the top & although all fundamentals might lead to it being a great company, buying at the top is not wise. Wait for correction before buying.
Goodluck!

Understanding the Cup and Handle Formation in Technical AnalysisThe Cup and Handle pattern is one of the most well-known and reliable chart patterns used by traders to predict bullish continuations. Understanding this formation can give you a valuable edge in identifying potential breakout stocks.
What is the Cup and Handle Pattern?
The Cup and Handle is a bullish continuation pattern that usually forms during an uptrend. It resembles the shape of a tea cup, with a rounded bottom followed by a slight pullback (the handle).
Cup: The cup is a rounded bottom, forming after a downtrend or consolidation. It indicates that the stock is finding support and gradually regaining momentum.
Handle : After forming the cup, the price pulls back slightly, creating a handle. This handle represents a period of consolidation before a breakout.
How to Identify a Cup and Handle Formation?
Prior Uptrend: The pattern typically forms after an established uptrend.
Rounded Bottom: The "cup" part should have a smooth, rounded bottom, indicating that the stock has gradually built support and is preparing for a bullish move.
Handle: The handle forms as a small pullback or consolidation, often at the upper end of the cup. This is where sellers temporarily outnumber buyers, but the selling pressure is limited.
Breakout: The breakout occurs when the price moves above the resistance level at the top of the handle, often accompanied by increased volume, signaling a continuation of the uptrend.
Example: DOLAT ALGOTECH LTD
DOLAT ALGOTECH LTD displayed a classic Cup and Handle pattern on its chart, signaling a potential bullish breakout. Here’s a breakdown of the key elements of the pattern:
Prior Uptrend: The stock was in a strong uptrend before entering a consolidation phase.
Cup Formation: The price formed a rounded bottom, creating the cup, showing a gradual recovery after a pullback.
Handle Formation: After the cup, the price consolidated and slightly pulled back, forming the handle.
Breakout: The stock has recently broken out of the handle with increased volume, indicating a potential continuation of the uptrend.
Key price targets based on the breakout:
First target: ₹202.53 (+17.82%)
Second target: ₹251.25 (+46.25%)
This real-world example demonstrates how the Cup and Handle pattern can be used to identify potential bullish breakouts in stocks.
Why is it Important?
The Cup and Handle pattern is considered reliable because it reflects a period of accumulation (cup) followed by a mild correction (handle), before the price resumes its upward movement. Traders often use this formation to identify potential buying opportunities before a breakout.
Key Points to Remember:
Pattern Duration: The cup can take several weeks or even months to form, while the handle usually takes a shorter time.
Volume Confirmation: A volume increase during the breakout is a strong signal that the pattern is valid and that the uptrend is likely to continue.
Risk Management: While this pattern is reliable, no technical analysis is foolproof. Always use stop-loss orders and manage risk properly.
NSE:DOLATALGO
