Trading is a waste of time Trading is a waste of time - until you do this!
Welcome back for another exciting video, an educational video, and an eye-opening video for a lot of traders, and I have given it a very, very interesting title that is Trading a Waste of Time.
Let's find out in this short video. Recently reading a book called The Best Loser Wins.
It's written by Tom Hoggard , he goes by the name of Trader Tom on YouTube .And I urge you to check him out. There are some things that I have learned from his book and I'd like to share it with you.
The particular data is of 2019 and these brokers are all located in European Union and, by law they are required to post the failure rates , how many clients are losing money in their market in their accounts.
Out of a hundred clients, 89 clients were in a loss. And the situation is same for almost each and every broking houses.
So eventually the brokers are making money, but the clients are not.
Whenever as a beginner or even a seasoned trader, we are looking at these data and we believe that we are not in this statistical data. We are in the winning percentage in the remaining 10%, but it's not like that for the markets. We are just a statistic. Right? And even if you look at the top 10 broking forms in the world, the majority of people are in a loss.
So that really makes us ask this question. Is trading really a waste of time? Are we just wasting our time in trading? And a lot of people, it's a very fine detail and a lot of people might agree with me that, in the initial stages it's really hard to be consistent in making money, right?
And I'll discuss the reason with you because this particular reason is not discussed.
The social media of Twitter, YouTube, it has all created an image where if you're not doubling your money every month, then you are a loser in the market.
But in fact, trading is a very tough profession and it's really hard to make money and initial days protecting your money is one of the biggest tasks in surviving in the market.
Protecting yourself from ruin is one of the biggest achievements in trading.
So whenever we are starting our journey as a trader, where is our focus? What are the questions we are looking for? What are the things we are usually focused on? , we are on the internet looking for strategies, how to do scalping, how to do seing trading, how to use the indicators, the MACD and RSI, and how we can use different types of breakout indicators, right?
These are the focal points of. I remember when I started trading, these are the things I was looking for. A hundred percent strategy, no loss strategy. These are the things that I was looking for initially, but these are usually the wrong answers.
You know, in an area where 90% people are in a loss, then you need to ask yourself that.
Because it has never been easier to trade because you go back 10 to 15 years, it was not easy to trade. You had to call your broker. And now we have an online trading system where we can just buy and sell stocks at an instant, right?
That leads to high liquidity. And high liquidity usually means you can enter and. Very fast and you don't have to pay much for it. And you have all the tools available, especially a tool like Trading View, where you get each and every trading charts, indicators without paying a single penny.
So it has never ever been easier to trade. So why are we all still losing money? We are only creating brokerage for our broking firm.
This takes us to another and final topic is that in the year 2019, one Forex brokerage firm did an analysis of over 25,000 traders.
And over a span of 15 months or 16 months.
So that is a long period of time and over five crore trades were analyzed.
So it was a very big data to analyze and that would give us a clear picture.
So in that analysis it was recorded that out of hundred. , the traders were profitable in 60 of them and they lost money in 40 of them.
So this is a very good data, right? Your win, your hit ratio is very high in the total amount of trades.
So eventually the data is in your favor, but there's a small catch . When the traders are winning, they're winning 40 points.
And when they lose, they lose around 75 points. This is a recipe for disaster. This particular thing created a lot of problems for me in the initial trades during my initial career.
And this might be creating a lot of problems for people who are trading for the past one or two years in this high VIX environment because, you know, on paper, on week to week basis, you are winning And, and suddenly there's one particular day when you lose it all and that is the day when it drags your capital back to square one.
So this is the biggest reason why it's very difficult for people to manage their trades.
Cause it all comes down to how much you win when you win, and how much you lose when you lose.
This brings us to the concept of risk . right in this modern area, uh, where option selling and creating spreads and selling naked options has been a very famous thing to do for the past couple of years. That is what happens whenever you're selling options, you have a probability of one 68%.
That is a one standard deviation, right?
So out of hundred trades you are going to win in 68% of them. But what you do and how you come out of the remaining 30 trades when the situation is not going to go in your favor, that is all going to matter.
And that is the crux of thing that makes your journey as a successful trader.
Our position in the market is very, very small for the market to know that we even exist or not.
If you look at the data, if you just reverse the win and the loss points, even if you're winning only 50% of the times, then also your position is going to be in a net profit.
So that's it for the guys.
That makes this particular question really interesting. Is trading a waste of time?
You're wasting of time, or are you smart enough to realize this thing that the other traders are doing and are in a loss?
And what are you doing to improve this position and to improve your survival In this market.
So that's it for you guys. I hope I have provided some value in this video, and if you found the video helpful, don't forget to follow me @piyushrawtani Trading View. And if you have any queries, feel free to post it in the comments section.
Thank you very much and good night.
Community ideas

Trend Analysis and its Characteristics.MCX:GOLD1!
What is Trend and how to identify it?
A trend is the overall direction of a market or an asset's price.
an uptrend is defined using peak and trough analysis. An uptrend is represented by a series of successively higher highs (peaks) and lows (troughs), while a downtrend is represented by a series of successively lower highs and lows.
->One can identify it by determining peaks and troughs.
->By using trendlines
->Price remaining above or below an overlay indicator.
we can quickly identify the general direction of a market or an asset by looking at the price chart but what we have to learn is to identify the quality of the current trend and how we can do that, by gauging the strength of the trend.
Here are some significant points which help us in understanding the mood and quality of a trend.
The highest skill any trader can aspire to is the ability to read pure price action.
1. Cycle Amplitude
Look for decreasing cycle amplitude in uptrends and downtrends.
A decrease in cycle amplitude in an uptrend is an early indication that there may potentially be an underlying weakness in the uptrend.
In a similar fashion, a decrease in cycle amplitude in a downtrend is regarded as a bullish indication.
2. Cycle Period
A gradual reduction in the cycle period during an uptrend is an early indication that there may potentially be an underlying weakness in the uptrend and a gradual reduction in the cycle period during the downtrend is a bullish indication.
3.Average Bar Range
A decrease in the average bar range in an uptrend and downtrend is an early indication of potential weakness in the current trend.
-> you can track the bar range using the average true range (ATR) oscillator
4.Bar Retracement Symmetry
A change in the number of bars in a retracement is also an early indication of a potential change in trend behaviour.
5. Average Candlestick Real Body to Range Ratio
A gradual decrease in the real body to candlestick range is also an early indication of potential weakness in a Trend.
6. Angular Symmetry and Momentum
Any change in the Angle of trend is significant:-
i.) An upside acceleration in price is bullish whereas an upside deceleration in price is bearish
ii.) A downside acceleration in price is bearish whereas a downside deceleration in price is bullish.
#It should be noted that although an upside acceleration in price is bullish, the uptrend may not be self‐sustaining if the rate of ascent was excessive. Such rapid increases in price usually end in a blow-off or buying climax with prices subsequently collapsing. Similarly, downside acceleration in prices may also end in a selling climax.
7. Frequency and Depth of Trend-Based Oscillations
When a trend moves with reasonable retracements not too short and not too big, it indicates a healthy trend which has profit taking along the way as the trend unfolds.
Traders and investors tend not to react as emotionally and irrationally at higher prices where the risk of losing pent‐up and unrealized profit is greater.
8.Relative Measure of Consolidation Size and Duration
Trend interruptions are more significant if:
■ Price formations are of greater magnitude (taller chart patterns).
■ Price formations develop over a longer period (wider chart patterns).
Larger trend interruptions normally tend to lead to a greater probability of a reversal. In a strong uptrend, a larger head and shoulders formation would be deemed more bearish than a smaller formation. Similarly, a larger rounding bottom formation would be more bullish than a smaller one in a downtrend.
In short, size takes precedence over form. Moreover, the longer it takes for a consolidation to unfold, the greater will be its disruptive power with respect to the trend, should a reversal occur.
By considering these characteristics while analysing trend will give a in depth insight and helps in making more informed and rational decisions.
I Hope you found this helpful.
Please like and comment.
Keep Learning,
Happy Trading!

The 2022 TradingView Community AwardsHey everyone! 👋
🥳 Welcome to the 2022 Community Awards! 🥳
It’s that time of year again, which means it’s time for us to shine a light on some of the best content shared on TradingView in 2022. Roll back the clocks with us as we dive deep into the best trade ideas, educational posts, and videos that you shared on our network. Without further ado, let’s jump in!
Starting us off, here were the top 3 most popular written trade ideas (by likes).
TeamTaurus, with their idea “Nifty Prediction”
Wolf-AD7, with their idea “The Bitcoin Cycle: A guide to time the next major entry”
Here were the top 3 most popular educational ideas:
RK_Charts, with their idea “How and when you should apply which Option strategy”
Chaser30, with their idea “'Verse' of 'Reverse' Candlestick Pattern”
johntradingwick, with their idea “How to find High Probability trades?”
Here were the top 3 most popular Video ideas:
piyushrawtani, with their idea: “Gap up/gap down intraday strategy with simple entry/exit”
priceNpedia with their idea: “HCL Tech: Coming out of downward channel”
StockEngineers_ with their idea: “Volume Analysis Series Part-3”
Here were the top 3 most popular scripts:
mallu-trader, with their script “ADR + CPR By MT”
bharatTrader, with their script “Alpha-Returns”
VinayKumarKV, with their script “Super Scalper - 5 Min 15 Min”
Here were the top 3 most active streamers of 2022 (by # of streams)! Be sure to check them out:
🥇 Stoxway
🥈 SathishChandrasekaran
🥉 AlphaBulls
And finally, the honorable mentions. These were users who were selected by a bunch of different criteria, impressed the editors, and had at least one idea selected for Editor’s Picks. Please put your hands together for the following awesome community members!
🥇 Bravetotrade
🥈 TRADEWITHFUN247
🥉 Charts_insiders
And there you have it! Our 2022 community award winners. Think we missed a good user, idea, script, or comment? Let us know in the comments below 😎
Let’s all have a fantastic 2023 together.
-Team TradingView ❤️❤️

How to trade doji candle like a legendhello everyone,
It's been a long that we haven't discussed anything here..
so our today's topic of discussion is how to trade/play with signs similar to Doji/ dragonfly/hanging-man etc
so we know the sign very well. we are referring here to the candlestick pattern, where there is some conflict between buyers & sellers & both keep trying to push/pull each other resulting in forming a candle where we usually see a small body candle having wicks on both sides.
so our next question is how to trade them..
1. Trend: before trading such patterns the trend should be known very well.
2. Once we have got the trend then wait for the small body candle.
3. Once we have got the candle, mark the high/low of the prior candle of the doji candle.
4. Wait for the next candle to form after the formation of doji candle.
5. once, the marked candle high/ low is breached on a closing basis you are all set to go!
examples shared
Example -1
Example-2
Example-3
Example-4
Example-5
Example-6
Example-7
Example-8
Example-9
I have shared multiple examples regarding the same & hope I be able to add some logic also..
Please note time frame must be kept the same while analyzing this setup.
I have shared entry & stop-loss levels only. will share stop loss technique in another post
Thanks for reading!!

Introducing Minds! 5 Things you need to know.Social media has evolved to become an essential tool for traders and investors. Staying up to date with market narratives, sharing and reading top ideas, and directly collaborating with others all serve to make the medium an extremely important part of the research process. That’s why today we’re thrilled to announce the next step in that evolution - Minds!
In today’s post, we’re going to highlight a few ways to use Minds to improve the way you follow, share, and chat about your favorite symbols. After all, in markets, information is everything and this is another tool to build into your workflow:
1.) Think of Minds as a feed created by your peers – full of their opinions, notes, and shared news topics, all relevant to whatever ticker you’re currently looking at.
2.) Minds can be used to quickly measure the general sentiment for any symbol. Ask yourself what people are talking about and if it’s bullish or bearish.
3.) Accessible from any symbol page, or from the right rail (with the thought bubble icon), this unique format allows you to chat with other members of the community alongside your chart. Watch the chart and social conversation at the same time.
4.) Want feedback about a specific symbol? Head to the Minds feed for that symbol and share your questions or comments. Other traders will eventually see your posts on the Minds feed. They can then comment, upvote, and downvote to let you know what their initial reaction is. This feedback can be used to improve your understanding of a symbol.
5.) Minds can be used to quickly catch up on all the news about your favorite symbols. Head to a Minds feed and examine what people are saying. Is there breaking news? Links? Charts? Something else? Over time these feeds will become essential newsfeeds for you.
Minds is currently in beta, so please send us any feedback you have! Know that we are working diligently to improve it.
Finally - while Minds is open to all users to read, follow, and vote, only paying members (Pro, Pro+, and Premium) can currently post to the Minds feed and leave comments, similar to the other social tools on our site.
Let us know how you like it, and get out there and post your first Mind today!
Happy Holidays! 😎🌲
-Team TradingView ❤️❤️

A pill for missed opportunitiesPrevious parts of the post:
Part 1: My Three Comrades: the Chart, the Screener, and the Watchlist
Part 2: Two captains of the same ship
The market is an element we take for granted. It can't stop when we're busy doing other things, and it can't work if the stock market is off and you personally have work days.
The small investor's impact on the market is close to zero. Some may not like it, but I see it as a big plus. I'm not the only one. Even Peter Lynch wrote about this . It is because of our size that we small investors have the ability to get the best buy and sell prices on stocks. Just imagine an elephant and a mouse trying to drink water from a coffee mug. Who has a better chance?
Like the best sales, attractive stock prices don't last long. This also applies to the period of increased stock prices that are interesting to sell. To make sure you don't miss this time, TradingView has an alert service.
Why do we need an alert system? For our convenience. Once we have selected fundamentally strong companies, our next step is to keep an eye on their stock price so we can buy them at a price we can benefit from.
You remember our strategy, right? Buy rooms in a great hotel, and even during a sale period.
How do you monitor these "sales"? You have two options: to monitor the price chart yourself during the trading period, or set up alerts so that if the stock price reaches a certain level, you will receive an SMS message to your phone or email, or a push-notification in the TradingView app (depending on your settings). Agree, this is very convenient.
So how do you set up the alerts?
1. First of all, you must open the chart of the stock you are going to configure the alerts for.
2. Then click on the "Alert" button at the top toolbar of the chart.
3. Set the alert parameters in the settings menu.
How do I read the settings in this picture?
If the Apple stock price is less than $130 per share, I will receive an alert every minute, all the time the stock is trading below $130.
The alert I will receive will contain the following message:
AAPL Less Than 130.00
If you don't want to get an alert every minute, set the trigger to "Only Once".
4. In the "Notifications" tab, you can configure where the alerts and the sound will go. The system of customized alerts will allow you to use your time effectively. You will not be chained to the monitor and you can calmly wait for the cherished message.
In the picture you can see that alerts can come as:
- push notification to your phone (if you have the TradingView app installed);
- a pop-up window on your monitor;
- a letter to your email address;
- a message to a web address (advanced feature for developers);
- SMS to your phone, but via email (i.e. your email service must have the ability to send copies of emails via SMS).
As for my investment strategy, it's quiet enough to work on it even without alerts. Mr. Market doesn't often come with insanely interesting prices, so it takes time to get to the target values. It's like waiting for an astronaut from the Moon: he can't return to Earth in a day, you have to wait patiently, with the occasional peek at the situation.
So, I'm concluding my series of posts dedicated to the basic functions of TradingView. I advise you to "play" with the platform for a while to get used to it as quickly as possible. In fact, it has a lot of features that you will discover over time. For now, that's it.
In the following posts, we will begin to examine perhaps the most important aspect of an investment strategy, which is fundamental analysis. Get ready, here comes the part that will require the most concentration. But then you will be able to navigate this topic with ease.
See you next time!

'SANTA' of the 'TRADERS'This publication is dedicated to thanking the 'Santa' of the ‘Traders’ i.e. the 'Stock Market'.
The lessons given to us as a gift of the market, not only help us to succeed in the stock market but also helps us throughout life.
This 25th December i.e. Christmas let’s thank our 'Santa' and have a detailed look at 5 Great Gifts of the Stock Market and thank her for these
life-awakening gifts.
-> Discipline: The most important teaching in markets is discipline. As the wording of Jim Rohn states “Discipline is the bridge between goals and accomplishment” stock market develops that bridge.
The market has its way of teaching and punishing, I think all of us had witnessed its punishment whether in form of not keeping stop loss or not following your trade system.
Discipline plays a vital role in an individual’s life. As said by Horace “Rule your mind or it will rule you. ”The disciplined person has the power to rule his mind whereas others lack this ability.
-> Patience: Another gem cultivated by markets in our personality and harvested by us throughout life. One of the familiar names of our school time Benjamin Franklin says “He that can have patience can have what he will.” market first teaches this gem to us and then offer us what we wish.
We all have at least once missed taking the real profit by not waiting till the target is achieved but leaving the trade in midway though it was moving in our direction the reason is we lack patience and the market gives profit only to eligible ones so, either you be eligible or market will make you fit for it by its way.
-> Ability to conquer 3 gateways of hell: According to ‘The Bible’ there are 12 gateways to hell and among them, the most dangerous are Lust, Greed, and Anger.
The market helps its students in conquering those strong emotions. The beginner in the stock market has a strong lust for making money very quickly and greed for making lots of money without that kind of effort and when he fails in his motive anger gets born in his personality from where degradation or hell starts.
Those few people who still have not left the hands of the market get the knowledge to conquer those emotions throughout their journey in markets.
-> Faith in yourself: One of the famous quotes by Ralph Waldo Emerson is “The best lightning rod for your protection is your spine.” market strengthen that spine so that we as its student can withstand any kind of storm in our life.
Taking any trade based on your analysis requires self-belief on the early days people hesitate but later they rely on their analysis because the market has taught them self-belief.
-> Crush your arrogance: Market is popular in crushing the arrogant guy along with this removing any trace of arrogance in his personality. The famous wording says “Close some doors today. Not because of pride, incapacity, or arrogance, but simply because they lead you nowhere.” market as a kind teacher keep a keen eye on her student for arrogance as she knows that as soon as arrogance arises person starts his fall.
All of us had witnessed that whenever we start thinking that we have mastered markets and try to neglect discipline market slaps us badly to awaken us that we are still newbies and still had to learn a lot.
I believe these 5 are the most valuable gifts of the market but if you have any gift of the market much valuable in your life please mention it in the comments.
Finally, Merry Christmas to all my trader mates.
The stock market gives success only to eligible ones so, either you be eligible or the market will make you fit for it in its own way.

Gap Trading Combined With Supply & Demand ZonesWhat Are Gaps?
Gaps are nothing but Price of a Stock moving up and down sharply with no or little trading happening between the previous days close and current days open. Gaps show an ultimate picture of imbalance between supply & demand. Gap formations are due to many fundamental and technical reasons.
Most common example, when there is an announcement of company earnings. Gap Up or Gap Down is imminent the next trading day due to positive or negative news. A trader can profit from gaps provided he/she can identify the type of gap and its location with perspective to Institutional Supply & Demand Zones.
Gap Trading Strategy using Supply and Demand Zones
A lot of traders are fearful of Gaps and see it as a threat & aren’t comfortable carrying positions overnight. However, for a professional Supply Demand Trader, these Gaps aren’t threats on the contrary they provide high probability trading opportunities, when combined with Supply & Demand Zones.
Four Gap Structures That We Look At:
1. Inside Gaps
2. Outside gaps
3. Novice Gaps
4. Professional Gaps
1.How to Identify & Trade Inside Gaps?
Inside gaps are created when Price Opens between the prior Day’s High and low. Often these gaps fill quickly on the same day. Inside gaps can be mainly used for quick intraday trades, provided they happen at strong supply & demand zones.
Gap Up into a strong Supply Zone provides a good short opportunity, whereas Gap Down into a strong Demand Zone presents a good long opportunity. Let’s see an example:
2.How to Identify & Trade Outside Gaps?
Outside gaps are created when Price opens beyond the Prior days High and low. These gaps generally do not fill on the same day. They indicate the establishment of a new Trend or the continuation of the existing one.
One must wait for quality Supply & Demand Zones to form after the gap and wait for a pullback to join the new move. Let’s see an example:
3.How to Identify & Trade Novice Gaps?
When price gaps in the same direction of the current trend, then it is called a Novice Gap. Novice gaps as the name suggests are created by novice trader emotions and are excellent opportunities to find high probability trade setups.
Gap Up or Gap Down after extended moves into quality areas of Supply & Demand, offer us high probability Short & Long opportunities respectively. Let’s see an example:
4.How to Identify & Trade Professional Gaps?
When price gaps up in the Opposite direction of the current trend, it is called a Professional Gap or a Pro gap. Pro gaps represent a significant imbalance between Supply & Demand.
Pro Gaps generally occur after extended moves in one direction, taking the amateur traders completely by surprise. They generally bring about trend change. Pro Gap Down & Pro Gap Up form high probability Supply & Demand Zones. Pull back to these zones provide us with opportunities to enter at trend change points. Let us see with an example:

5 Things to remember about bull marketsHey everyone! 👋
Bull markets are a time of optimism and growth, and they can be a great opportunity for making substantial gains. However, it's important to remember that bull markets don't last forever, and it's crucial to approach them with a healthy dose of caution while keeping your eye on your long-term goals. 🙂
Here are a few things to keep in mind when dealing with bull markets:
🚨 Don't get caught up in the speculative frenzy
It's important to remain level-headed and avoid making impulsive decisions based on short-term gains. Take time to thoroughly research any trades you're considering. It’s always good to focus on ideas with strong fundamentals as well as technicals.
📚 Keep an eye on valuations
In a bull market, it's common for stock prices to rise, sometimes to levels that may not be justified by a company's fundamentals. For investors, it can be important to keep an eye on valuations and make sure the stocks you're investing in are reasonably priced.
🔔 Be prepared for reversals
Like all good things, the Bull markets too eventually come to an end. Hence, it's essential to be prepared for a downturn. It’s always good to manage risk exposure by employing techniques such as diversification and hedging.
💸 Control your risk
It's natural to want to hold on to the positions that are performing well, but it's important to remember that bull markets eventually come to an end.
If you've made substantial gains, trailing may be a good option to lock in profits should things change quickly. Letting the winners ride by continually trailing your positions is one good strategy for improving a trade’s Risk-Reward ratio.
📈 Keep a long-term perspective
Trading is a marathon, not a sprint. Bull markets can be a great opportunity for gains, but it's important to keep a long-term perspective about your goals. Did you miss the big moves? Don’t get angry and make bad decisions. There will be more opportunities down the road to apply what you’ve learned.
Bull markets can provide excellent opportunities, however, they must be approached with caution and with defined personal goals. Consider the risks and rewards of each investment, keep an eye on valuations, and always be prepared for a downturn.
We hope you enjoyed this post! Please feel free to write any additional tips or pieces of advice in the comments section below.
See you all next week. 🙂
– Team TradingView
Do check us out on YouTube and Instagram for more awesome content!

Japanese Candlesticks: Game of Body and ShadowsSo, in the last post we learned how to build a simple line chart based on the tape. Each point on the chart is defined by coordinates from the time (X scale) and price (Y scale) of a trade. But some stocks are traded at a frequency of hundreds of trades per second, at different prices. The question arises: which trade price to choose from this set?
Interval charts were invented to solve this question. The most popular is the Candlestick Chart . They appeared in Japan three hundred years ago, when the Japanese exchanges were trading rice. They were invented by a trader named Homma. Apparently, being tired of drawing a lot of points on charts, he decided that it would be more convenient to show the price change over the time interval. So, what he came up with.
Let's take a time frame equal to one hour and plot a 1-hour candle on the basis of the following tape:
FB $110 20 lots 12/12/22 12-34-59
FB $115 25 lots 12/12/22 12-56-01
FB $100 10 lots 12/12/22 12-59-12
FB $105 30 lots 12/12/22 12-59-48
A candle consists of a body and upper and lower shadows. Like a float. The body is formed from the open and close prices of a certain time frame. In our case the hour interval is from 12-00-00 till 12-59-59. Only 4 deals were concluded in this time interval. The price of the first deal is $110, which is the opening price of the period or the so-called " open ". The price of the last deal was $105, which is the period closing price or " close ". These two prices are enough to form the body of the candle.
Now let us move on to the shadows . The upper shadow is drawn at the maximum price of the interval (115$) and is called " high ". The lower shadow is drawn at the minimum price of the interval ($100) and is called " low ".
The shape of our candle is ready. However, it should also have a content, namely the color. What is it for? Let's take a look at another candle.
Here we can see where is the high and where is the low. But how do we know which is the open or the close? After all, the open is not always at the bottom of the candlestick body, as in the previous example, it can be at the top.
To understand where is the open and where is the close, Homma has invented to paint the body of a candlestick in black, if close is lower than the open, i.e. if the price in the interval is falling (falling candle or bearish candle ).
But if close is higher than open, the body of the candle remains white, it will indicate the growth of price during the interval (rising candle or bullish candle ).
Sometimes a candlestick has shadows, and the close price is equal to the open price. Then it will look like a cross. This candlestick is called a doji .
White and black are the classic colors for the bodies of Japanese candles. However, you can come up with your own colors. If you want the rising candles, for example, to be blue, and the falling orange - you're welcome. The main thing is to make it convenient and understandable for you.
So, one candlestick allows us to understand where we had the first trade, the last trade, the price maximum and minimum in a given time frame. But it does not allow us to understand how the price changed within the interval: when the maximum or minimum was reached and what was happening within this price range.
But the problem can be easily solved if we switch to a smaller time frame. If we look at the daily candlesticks (this is when the time frame of one candle is equal to one day), and we want to see what was during the day - we switch to the hourly time frame. If we want to see even more details - we switch to 15-minute candles and so on down to the seconds. But you and I will most often use daily timeframes, so as not to be distracted by the fluctuations that occur during the day.
To be continued :)

How to Interpret levels in trendline and Horizontal resistanceHow to Interpret levels in trendline and Horizontal resistance. How to draw correct horizontal line from hidden levels.

Pullback Trading Strategy - RulesPullback Trading Strategy over 80% Success Rate
Rules
Moving Average - Price should above 200 Period Moving Average
Entry - 10 Period RSI Below 30
Exit - 10 Period RSI Above 50
Stop Loss - Recent Swing Low
I hope you understood the pullback trading rules.
Chart 1 : Reliance 9.68% Up
The price was clearly above the 200 Period Moving Average in the chart below, and the RSI 10 period was below 30, indicating that the pullback rule was satisfied.
Chart 2 : SBIN 9.4% Up
The price was clearly above the 200 Period Moving Average in the chart below, and the RSI 10 period was below 30, indicating that the pullback rule was satisfied.
Chart 3 : TCS 3.13% UP
Pullback rule satisfied
Chart 4 : Bank Nifty 2.51 % UP
Chart 5 : Wipro 3.76 % UP
I hope you enjoyed it. Please share and comment if you found this content useful.

Wyckoff Phases in PracticeWe all know that market moves in Phases. The four most popular phases are –
1️⃣Accumulation
2️⃣Markup
3️⃣Distribution and
4️⃣Markdown
Mr. Wyckoff analyzed these phases further, esp. Accumulation and Distribution, to understand the price behavior for potential opportunities to trade/invest in the market.
In this tutorial I am going to have a brief discussion about Accumulation-sub-phases of the market with the help of an example that I came across today.
✅ Phase A
🚩Starts after a major downtrend.
🚩Begins with a selling climax (SC) - Large down bars with abnormally high volume (see B).
🚩SC is followed by the largest rally in the major downtrend, associated with good buying volume. This Automatic Rally (AR) represents the change in character (ChoC) of the market - buyers taking over.
🚩Market retest the level B with a lower volume (supply) – Secondary Test (see D).
✅ Phase B
🚩Usually the longest phase.
🚩High volume during rallies (eg. E) and lesser during retracements.
🚩Even if volume is high during retracements, price fails to make new lows.
🚩More secondary tests (see F) held at the support zone (B and D).
🚩Market consolidates testing supply and demand with no particular direction – Consolidation.
✅ Phase C
🚩The smallest but most important.
🚩Usually ends with a Spring (not in the above case).
🚩You would see final shakeout of weak buyers. Price dips underneath the support zone (B, D and F) and reverse sharply back above support.
🚩Perhaps the best time enter for those who like to take low risk high probability trades.
🚩In the above case G was just another test of support Zone.
✅ Phase D
🚩You would see swift action in this phase. Wide up bars (with high volume) and small down bars (with low volume).
🚩This also represents the change in character which now differs from the consolidation phase.
🚩ChoC - Notice two blue rectangles and the price action in them.
🚩Price breaks the resistance zone (mostly the high of automatic rally).
🚩It again retests this resistance which now starts acting as support. This is called the Backup action.
🚩This is perhaps the best time for those who like to enter after confirmation.
✅ Phase E
🚀Accumulation is over and a trend is established.
Not all bear markets end with these accumulation-sub-phases. You may often see V-shaped recoveries just like what we experienced after March 2020 lows. But you will surely find some stocks or markets that moved in line with Wyckoff phases.
Thanks for reading.
Do like and comment.
📣Disclaimer: The views are personal and theoretical. Apply your own due diligence before making your investment decisions.

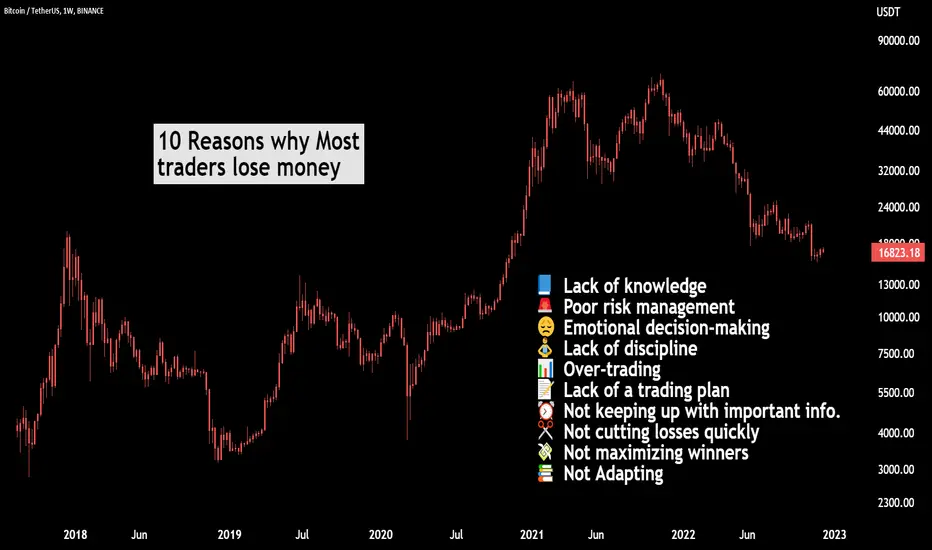
10 Reasons why Most traders lose moneyHey everyone!👋
Trading & investing is not easy. If it were, everyone would be rich.
Here are a couple of time-honored tips to help you get back to basics.
Lack of knowledge 📘
Many traders jump into the market without a thorough understanding of how it works and what it takes to be successful. As a result, they make costly mistakes and quickly lose money.
Poor risk management 🚨
Risk is an inherent part of trading, and it's important to manage it effectively in order to protect your capital and maximize your chances of success. However, many traders don't have a clear risk management strategy in place, and as a result, they are more vulnerable to outsized losses.
Emotional decision-making 😞
It's easy to feel strong emotions while trading. However, making decisions based on emotions rather than rational analysis can be a recipe for disaster. Many traders make poor decisions when they are feeling overwhelmed, greedy, or fearful and this can lead to significant losses.
Lack of discipline 🧘♂️
Successful trading requires discipline, but many traders struggle to stick to their plan. This can be especially challenging when the market is volatile or when a trader is going through a drawdown. Create a system for yourself that's easy to stay compliant with!
Over-trading 📊
Many traders make the mistake of over-trading, which means they take on too many trades and don't allow their trades to play out properly. This leads to increased risk, higher brokerage costs, and a greater likelihood of making losses. Clearly articulating setups you like can help separate good opportunities from the chaff.
Lack of a trading plan 📝
A trading plan provides a clear set of rules and guidelines to follow when taking trades. Without a plan, traders may make impulsive decisions, which can be dangerous and often lead to losses.
Not keeping up with important data and information ⏰
The market and its common narratives are constantly evolving, and it's important for traders to stay up-to-date with the latest developments in order to make informed decisions.
Not cutting losses quickly ✂️
No trader can avoid making losses completely, but the key is to minimize their impact on your account. One of the best ways to do this is to cut your losses quickly when a trade goes against you. However, many traders hold onto losing trades for too long, hoping that they will recover, and this can lead to larger-than-expected losses.
Not maximizing winners 💸
Just as it's important to cut your losses quickly, it's also important to maximize your winners. Many traders fail to do this, either because they don’t have a plan in place, telling them when and how to exit a trade. As a result, they may leave money on the table and miss out on potential profits.
Not Adapting 📚
Adapting to changing market conditions is paramount to success in the financial markets. Regimes change, trading edge disappears and reappears, and the systems underpinning everything are constantly in flux. One day a trading strategy is producing consistent profits, the next, it isn't. Traders need to adapt in order to make money over the long term, or they risk getting phased out of the market.
Overall, the majority of traders make losses because they fail to prepare for the challenges of the market. By educating themselves, developing a solid trading plan, and planning out decisions beforehand, traders can improve their chances of success and avoid common pitfalls.
We hope you enjoyed this post. Please feel free to write any additional tips or pieces of advice in the comments section below!
See you all next week. 🙂
– Team TradingView
Do check us out on YouTube and Instagram for more awesome content!
Investors' Holy Grail - The Business/Economic CycleThe business cycle describes how the economy expands and contracts over time. It is an upward and downward movement of the gross domestic product along with its long-term growth rate.
The business cycle consists of 6 phases/stages :
1. Expansion
2. Peak
3. Recession
4. Depression
5. Trough
6. Recovery
1) Expansion :
Sectors Affected: Technology, Consumer discretion
Expansion is the first stage of the business cycle. The economy moves slowly upward, and the cycle begins.
The government strengthens the economy:
Lowering taxes
Boost in spending.
- When the growth slows, the central bank reduces rates to encourage businesses to borrow.
- As the economy expands, economic indicators are likely to show positive signals, such as employment, income, wages, profits, demand, and supply.
- A rise in employment increases consumer confidence increasing activity in the housing markets, and growth turns positive. A high level of demand and insufficient supply lead to an increase in the price of production. Investors take a loan with high rates to fill the demand pressure. This process continues until the economy becomes favorable for expansion.
2) Peak :
Sector Affected : Financial, energy, materials
- The second stage of the business cycle is the peak which shows the maximum growth of the economy. Identifying the end point of an expansion is the most complex task because it can last for serval years.
- This phase shows a reduction in unemployment rates. The market continues its positive outlook. During expansion, the central bank looks for signs of building price pressures, and increased rates can contribute to this peak. The central bank also tries to protect the economy against inflation in this stage.
- Since employment rates, income, wages, profits, demand & supply are already high, there is no further increase.
- The investor will produce more and more to fill the demand pressure. Thus, the investment and product will become expensive. At this time point, the investor will not get a return due to inflation. Prices are way higher for buyers to buy. From this situation, a recession takes place. The economy reverses from this stage.
3) Recession :
Sector Affected : Utilities, healthcare, consumer staples
- Two consecutive quarters of back-to-back declines in gross domestic product constitute a recession.
- The recession is followed by a peak phase. In this phase economic indicators start melting down. The demand for the goods decreased due to expensive prices. Supply will keep increasing, and on the other hand, demand will begin to decline. That causes an "excess of supply" and will lead to falling in prices.
4) Depression :
- In more prolonged downturns, the economy enters into a depression phase. The period of malaise is called depression. Depression doesn't happen often, but when they do, there seems to be no amount of policy stimulus that can lift consumers and businesses out of their slumps. When The economy is declining and falling below steady growth, this stage is called depression.
- Consumers don't borrow or spend because they are pessimistic about the economic outlook. As the central bank cuts interest rates, loans become cheap, but businesses fail to take advantage of loans because they can't see a clear picture of when demand will start picking up. There will be less demand for loans. The business ends up sitting on inventories & pare back production, which they already produced.
- Companies lay off more and more employees, and the unemployment rate soars and confidence flatters.
5) Trough :
- When economic growth becomes negative, the outlook looks hopeless. Further decline in demand and supply of goods and services will lead to more fall in prices.
- It shows the maximum negative situation as the economy reached its lowest point. All economic indicators will be worse. Ex. The highest rate of unemployment, and No demand for goods and services(lowest), etc. After the completion, good time starts with the recovery phase.
6) Recovery :
Affected sectors: Industrials, materials, real estate
- As a result of low prices, the economy begins to rebound from a negative growth rate, and demand and production are both starting to increase.
- Companies stop shedding employees and start finding to meet the current level of demand. As a result, they are compelled to hire. As the months pass, the economy is once in expansion.
- The business cycle is important because investors attempt to concentrate their investments on those that are expected to do well at a certain time of the cycle.
- Government and the central bank also take action to establish a healthy economy. The government will increase expenditure and also take steps to increase production.
After the recovery phases, the economy again enters the expansion phase.
Safe heaven/Defensive Stocks - It maintains or anticipates its values over the crisis, then does well. We can even expect good returns in these asset classes. Ex. utilities, health care, consumer staples, etc. ("WE WILL DISCUSS MORE IN OUR UPCOMING ARTICLE DUE TO ARTICLE LENGTH.")
It's a depression condition for me that I couldn't complete my discussion after spending many days in writing this article. However, I will upload the second part of this article that will help investors and traders in real life. This article took me a long time to write. I'm not expecting likes or followers, but I hope you will read it.
Have a great day :)
@Money_Dictators

'RESUME' the trend journey with a 'PAUSE' candleDefinition:- As the name suggests pause candle is the candle formed in between the trend, the change is usually opposite the trend
i.e. if the underlined script is moving in an uptrend then the pause candle will be of negative change and the color will be red and vice-versa.
The pause candle indicates a pause in fresh positions by market participants and an entry chance for players expecting reversals.
Also, it's an opportunity for new players to enter the trend i.e. for those who have missed the initial trend.
Rules or Characteristics of a pause candle:-
1. Prior candles should be aggressive i.e. large candles of the opposite color.
2. It is generally of very small size as compared to the previous one and of the opposite color.
3. Volume is considerably low as compared to previous candles.
4. The RSI level of the spot where this candle originates is usually between the band of 35-75.
The psychology behind the pause candle:- In the market everything has a cause and a reason similar pause candle also conveys its message to the market players.
The generation of the pause candle signifies that there is fatigue among the participants who were driving the stock or are taking some break.
Also, it alerts that new hands have entered into the trend and are trying to offer resistance. Those who are looking for reversals spot this candle and enter into
trade with the hope of reversals, they are generally weaker hands.
Bigger hands those who were the driving force of the trend also want the new player to enter the trend so that they hunt them down and resume the
rally at a lower price.
How to trade pause candle:- Now, as small players, we don't know what goes inside but try to predict the message through the candle. If a pause candle
is formed it doesn't mean the exhaustion of trend or reversal rather indicates a pause in fresh market position.
But, here the aggressive trader enters with trades opposite to the trend. At this stage, two cases arise, note talking for an uptrend:-
-> The next candle's high crosses above the high of the pause candle:
Maximum times this is the case that arises, here the candle after the pause candle crosses the high of the pause candle now what does this indicate?
The indication is that the trend drivers or bigger hands are active again and those who have taken a position against the trend are trapped and will
try to escape hence, the move will be much sharper as compared to the initial trend.
How to benefit in this case? When you spot such a pause candle that is formed after a continuous trend set it to alert candle and wait for the next candle
to form. If the next candle crosses the high of the pause candle take the position along the trend and your stop would be the low of the pause candle which is generally
too small and ride the sharper trend which is usually equal to the initial one.
-> The next candle's low crosses below the low of the pause candle:
Though not arises usually sometimes it does occur, here the candle after the pause candle crosses the high of the pause candle now what does this
indicate?
The indication is that the trend drivers or bigger hands are in the backseat and are not seeing further upside also there is a chance that they can book
profits at this level.
How to benefit in this case? When you spot such a pause candle that is formed after a continuous trend set it to alert candle and wait for the next candle
to form. If the next candle crosses below the low of the pause candle take the position against the trend and your stop would be the high of the pause candle which is generally
too small and ride the reversal trend which is usually half of the initial one. This case comes under the reversal candlestick patterns on which earlier an article was published
by me but here we are concerned about a pause candle after which rally resumes.
Here, is an example of a different scenario though it doesn't match the above said cases but still the background is of a pause candle.
HIL was trading above a rising trendline and suddenly breakdown the line after which we see continue 2-3 red candles following the candles a pause candle is
formed with all the above-discussed properties but rather than showing the sharp downfall it again forms a pause candle but note stop loss is not triggered.
Here 3-4 pause candles are formed and finally it breakdown all the low with a big red candle and then afterward we saw a huge, sharp downfall.
The motive to explain the above example was that though sometimes we don't see rapid action but if your stop is not triggered and the candles are with
the low volume then you can assure that a sharp move is pending and sooner or later it will happen.
Note: The only constraint is to identify the correct pause candle for which you can refer to the above-said rules are very important. Sometimes the candle after the pause candle
crosses both the high and low of the pause candle in that circumstance you have to check the color of the candle, for uptrend it should be green then you can
take the position else if it's red then wait for the next candle, and vice-versa for the downtrend.

Find a perfect Trend Line With this check listThere are many traders out there who trade trend lines. Mastering trend lines is not easy as it seems, with experience things changes with your perception about Trend Lines. What I learned from my experience is that it is important to find a trend line, but it is more important to filter it so that, we can trade only the potential opportunities. Here I do not say that those trades which we filter out will not work or we efficiently filter out those less profitable trades, because adding a filter in your system not only filter trades which are unprofitable but also filter out profitable trades.
You have to accept that you are leaving better for best.
So, what are the check points I follow to filter out Trend Lines,
1) Touches, I prefer more than three touches and I strictly follow it. See what happens with two touch the number of trades increases too much; I am not saying trend line with two touches does not work but that trend line cannot be of higher profit potential than 3 or four touches.
2) Distance between touches, it is stated that if touches have equal distance between them the trend line is considered as a good Trend Line, but i do not strictly apply if the touches are places at enough spacing and the distance between then approximately equal that it is a good Trend Line. I do check distances but not strict on it.
3) Apply your own logic, this is a very subjective thing, person to person it will vary. Every trader looks the same setup differently, setups will only work when his psychology matches with those setups otherwise it will not work. Build your own logic.
At last, I want to end this post by a quote I have in my mind.
"True Knowledge cannot be taught, it can only be caught."

Correlations between Nifty and DXY studyHello Friends, here we had shared just an observation on correlation between NIFTY and DXY which are clearly showing opposite directional runs from last couple of months, also we are assuming the wave counts on both, which are suggesting same patterns ahead along with good support by this correlation, this increases good chances of winning probabilities of our forecasting and analysis, this whole scenario helps in view building and analyzing charts.
I'll mention that this is for educational purpose only, and this is not for trading purpose . Thanks
Most investors treat trading as a hobby because they have a full-time job doing something else.
However, If you treat trading like a business, it will pay you like a business. If you treat like a hobby, hobbies don't pay, they cost you...!
Disclaimer.
I am not sebi registered analyst.
My studies are for educational purpose only.
Please Consult your financial advisor before trading or investing.
I am not responsible for any kinds of your profits and your losses.

Divergence Cheat Sheet / Types of DivergenceWhat is divergence?
Divergence is a method used in technical analysis when the direction of a technical indicator, usually some form of oscillator ‘diverges’ from the overall price trend. In other words, the indicator starts moving in the opposite direction to the price and the trading oscillator signals a possible trend reversal.
Once divergence appears, there is a higher chance of a reversal, especially if divergence appears on a higher time frame.
Oscillator indicator for divergence patterns is Weis Wave Volume, macd, the RSI, CCI, or stochastic OBV.
Types of divergences
There are 4 types of divergence, which are broadly classified into two categories:
1) Regular or Classic Divergence
2) Hidden Divergence
With each of these two categories, you have a bullish or a bearish divergence. Therefore, the four types of divergences are summarized as:
1) Regular Bullish Divergence
2) Regular Bearish Divergence
3) Hidden Bullish Divergence
4) Hidden Bearish Divergence
Divergence patterns indicate that a reversal is coming soon and becoming more likely but this is not an instant change. The more divergence there is visible, the more likely a reversal does become. Here are some guidelines:
The entry can not be taken on the basis of divergence indicator alone.
It’s best if a trader mixes the divergence indicator pattern with their strategy.
Use Higher time Frames.

Alerts: 3 reasons they can make you a better traderHey Everyone! 👋
We hope you’re enjoying Black Friday week and have helped yourself to some of the great discounts we are offering. We only do this once a year, so it really is the best time to get a plan!
Now, let’s jump into today’s topic: Alerts.
While alerts have a ton of potential applications when it comes to trading, they are often underutilized because it can take some time and ingenuity to build a system where they can work well. Let's take a look at some reasons why that investment is well worth it.
1. They can help build good habits 💪
Stop us if this sounds familiar: you hear an awesome investment story, and then immediately go out into the market and purchase the asset, with no plan in place.
While this can work, it’s not a great strategy for long-term success, because in reality, it can be extremely hard to sit in that position without a plan and trade it efficiently. You may choose to exit the position based on nothing more than momentary greed or fear, and moves like that can prevent consistency and long-term profitability.
Alerts are great because they can take out the guesswork of entering and exiting a position. Simply set alerts for the prices you would like, then place a trade if, and only if, the conditions are met. Then, let the market do its thing and let the probabilities work in your favor.
Alerts can turn the experience of trading from a constant search for ideas - and always feeling behind - into a relaxing job of waiting for your own pre-approved conditions to trigger before taking action. In short, alerts can make you much more well-prepared for the market’s ups and downs.
2. They increase freedom and reduce anxiety 🧘
There is a well-known maxim in trading and in life that states that negative emotions are felt twice as strongly as positive emotions. This factoid has lots of applications, but it can be especially useful to understand as a trader.
Consider the following investors:
- A dentist who checks quarterly reports from his brokerage
- A position trader who checks his positions once a month
- A swing trader who checks his positions once a week
- A Day trader who checks his positions once a day, if not more
Given the natural volatility that markets experience, which market participant is least likely to be mad or upset? The dentist. Why? Because he is receiving fewer data points from the market. Even world-class day traders are exposed to tens or hundreds of negative situations in their positions on a day-to-day basis as a result of volatility, which they cannot control. This level of negative stimulation can reduce mental health and trading effectiveness.
Alerts allow well-prepared traders with some edge to step back from the markets and allow the trades to come to them.
3. Our alerts don’t let anything fall through the cracks ✅
While the previous two points are benefits when it comes to price alerts, our alerts also step the game up considerably when it comes to user utility. Once you have setups that you like to trade, you can set alerts on trendlines, technical indicators, customizable scripts, and so much more, so you can ensure that your favorite setups aren’t being missed.
This can be as simple as a long-term investor setting RSI alerts on Dow 30 stocks, in order to buy dips in strong names, to as complex as an intraday futures spread scalper setting alerts for pricing inefficiencies within his top 40 contracts.
Our customizable alerts can really allow well-organized traders to capture every opportunity as they see it.
And there you have it! 3 reasons to take advantage of alerts, and all of the awesome benefits they bring.
Thanks for reading and stay well!
Love,
Team TradingView ❤️❤️
Do check us out on YouTube and Instagram for more awesome content!

Raising initial capital: 4 approaches, of which one is not goodLet's break down the thought from the previous post in more detail. Obviously, to buy stocks, you have to have money, and if you are determined to become an investor, get ready to open your piggy bank. If you don't have savings, however, don't despair, there are other options.
I suggest you look at the following 4 options for acquiring the finances to buy stocks:
- Reduce your current expenses
- Sell unnecessary assets
- Increase your regular income
- And the option I don't recommend using at the start is to borrow.
I immediately stipulate that it is your, and only your responsibility how to apply the knowledge gained - to use something of the proposed or to go another way. I do not insist on anything. Rather, I am sharing information, but the decision is up to you in any case.
My opinion - always start with reducing your current costs, because the funds you save now give you a chance to increase your wealth in the future through investing. Make it a rule to plan your purchases in advance and buy only what is on your list. Don't go to the store without a list, otherwise you will buy more than you really need.
Next. Look at your possessions. Make a list of what you can sell without compromising your financial and mental well-being. Let what you don't need now serve to increase your wealth in the future.
Increasing your regular income is probably the most time-consuming but feasible way to accumulate funds for investment. Many people are often faced with the problem of choosing between a job they love where they don't earn enough and a job they hate with a higher income or, even worse, a job they hate with a paltry income. In the latter two cases, I recommend becoming an active user of services that will help you find the job you want (but don't act in haste, don't quit a job you don't like right away). Remember our goal is to keep and increase our income, not lose it altogether. In the case of a job you love and don't make much money, think about how you can increase your income in your current job. Sometimes all you have to do is make up your mind and ask your employer for it. Even a small increase will help you start saving. And if you have both a job you love and a desired level of income, I congratulate you, you are truly lucky.
Moving on. Borrowing for investments is the riskiest option. I highly do not recommend it, especially at the beginning of your investing journey. You definitely should not take a loan from a bank or other financial institutions. The credit rate will only increase your costs, and the need to repay the loan every month will break your entire investment strategy.
If family, friends or acquaintances are willing to lend you money long-term and without interest, think about whether your lender is aware of the risks and whether you are aware of the risks associated with investing in stocks, and whether this person will demand the money back before the agreed upon deadline. Even if you have agreed on everything, write down all of the terms of such a private loan on paper, so it is easier to resolve any disputes.
I always insist that the investment is conscious, that you understand and are ready to bear the responsibility and risks. So if you have even the slightest doubt about the borrowing option - don't take it! Consider another option. Ideally - work out a step-by-step plan and accumulate the necessary amount of money gradually.

Introduction to Volume profile If you have been in the market for some time, you may have heard of a study called the “Volume profile” . Today we are going to take a deeper look at volume profile, along with a few example strategies. This post will also lay the groundwork for future posts about more advanced volume profile topics.
Please remember this is an educational post to help all of our members better understand concepts used in trading or investing. This in no way promotes a particular style of trading!
The post will shed some light on the following topics:
→ What is volume profile?
→ Difference between traditional volume indicator and volume profile
→ Volume profile terminology
→ Different types of volume profiles
→ Example strategy
👉 What is Volume profile?
Volume Profile is an advanced charting study that displays trading activity at specific price levels over a specified time period. On the chart, it plots a horizontal histogram to reveal significant price levels based on volume.
Volume Profile, in essence, takes the total volume traded at a specific price level during the specified time period and divides it into either buy volume or sell volume, making that information easily visible to the trader.
👉 Difference between volume profile and traditional volume indicator
The core difference between the traditional volume indicator and the volume profile is how they consider volume with respect to time and price.
The traditional volume indicator plots histograms at specific times, without giving any relevance to the price levels. On the other hand, the volume profile gives importance to price levels without emphasizing on the time scale.
👉 Volume profile terminology
■ Point of Control (POC) – The price level for the time period with the highest traded volume.
■ Profile High – The highest reached price level during the specified time period.
■ Profile Low – The lowest reached price level during the specified time period.
■ Value Area (VA) – The range of price levels in which a specified percentage of all volume was traded during the time period. Typically, this percentage is set to 70% however it is up to the trader’s discretion.
■ Value Area High (VAH) – The highest price level within the value area.
■ Value Area Low (VAL) – The lowest price level within the value area.
■ High Volume Nodes (HVN) – Peaks in volume around a price level.
■ Low Volume Nodes (HVN) – Valleys in volume around a price level.
👉 Different types of volume profiles
TradingView currently provides 5 types of volume profiles. These are:
1. Auto anchored - Specifies the anchor of the volume profile calculation, i.e. how often the volume profile recalculates and where it starts.
2. Fixed range - Builds a profile using the custom anchors provided by the user.
3. Periodic - Sets the period for which the indicator builds volume profile, one profile for each new period.
4. Session (Normal and HD) - SVP displays a profile for all the market action that occurs within a session. If set to "All" (default), the indicator will consider the pre-market, main trading session and post-market as one session.
5. Visible range - Builds a profile considering all the visible data on the screen.
Please note that the Volume Profile is a paid-only feature that can be accessed by subscribing to one of our paid plans. If you need to upgrade your account, be sure to check out our Black Friday sale . You can get up to 60% off on subscriptions.
Example strategy
Just like with most other tools or studies, Volume Profile has a number of uses. There are many trading strategies out there using Volume Profile as a key component. Below are the basics of one such strategy which is based on comparing the current day’s opening price to the previous day’s Volume Profile.
👉 If the current day opens above the previous day’s value area (but still below the Profile High)
A sample setup is to look for the price to retrace back toward the Point of Control and then proceed to rise (the direction of the day’s open). Therefore during the retracement to the Point of Control, there is a buying opportunity.
👉 If the current day opens below the previous day’s value area (but still above the Profile Low)
Some traders may look for price to retrace back towards the Point of Control and then proceed to fall (the direction of the day’s open). Therefore during the retracement to the Point of Control, there is a selling opportunity.
👉 If the current day’s opening price is completely outside of the previous day’s profile (above the Profile High or below the Profile Low)
In general, this is seen as a possible runner in the direction of the opening price relative to the previous day’s profile range but different traders may look at it differently.
Thanks for reading! As we mentioned before, this isn't trading advice, but rather information about a tool that many traders use. Hope this was helpful!
See you all next week. 🙂
– Team TradingView
Feel free to check us out on Twitter and Instagram for more awesome content! 💘

How to Study Price and Wave volume RelationshipHi 👋
In this post I would try to throw some light on the Price & Wave Volume relationship (popularized by late David Weis).
This method may help trades in two ways:
1️⃣Ride the trend
2️⃣Picking the end of a rally
I came across this chart randomly and found that there are a few principles that I can discuss with the help of this chart.
Before reading any further I want to disclose that this technique was not originally developed by me. However, different authors may have different interpretations when it comes to some techniques of discretionary trading. This is a small piece of what I have learnt as a big follower of price action trading.
I don’t want to go for bar by bar analysis here due to time and space constraints, so I have marked a few important places (as numbers in green rectangles) that are important and need to be discussed.
The numbers in white are the cumulative wave volume in crores. This means just keep on adding the volume of each up bar until there is a reversal. I have taken the reversal a 2points on closing basis. Which means I keep on adding the volume until the price closes 2points below the close of the previous bar. The opposite is true for down waves.
🚀 Point1
If you look at the upwave preceding the downwave at point1, it is the sharpest of the rallies from March 2020 lows (scroll back the chart a bit). Also wave volume is the highest (37cr) compared to 10,19 and 18cr on previous upwaves.
At point 1 there is 10cr volume on the downwave, which is the highest on any downwave in the rally from Mar2020 lows. This is an alarming signal that sellers are getting active. But this may not impress us to liquidate our trades as we need further evidence to confirm this weakness.
🚀 Point2
Here we have very high volume accompanied by the widest bar (in the rally) but closing in the middle. These three things confirm here that sellers have stepped in and the stock is weakening.
🚀 Point3
There is a rally back to the highs but this time with lesser volume (29cr compared to 37cr) than preceding rallies. This is our second confirmation that buyers are turning there back at this level, at least for now. This is a sure exit opportunity for investors who bought at the lows.
🚀 Point4
There was a sharp reaction with huge volume of 31cr and very wide bar, closing off of its lows. At this point there is still confusion that the trend has reversed or not. If it was a reversal then there would have been a follow through of 31cr volume on the downside but it is not so. For the next 3 days price sustained above the low of this wide downbar.
🚀 Point5
The sellers again tried to push to the stock down but look at the volume in this wave. Are you getting it now? Its just 13cr instead of 31cr on the last downwave. This infers here that seller are not interested. So if seller are not interested then what will happen? Buyers will take over.
🚀 Point6
The sellers tested the level of 1, 4 and 5 a few more times, buyers holds it and that develops a support. There was a very strong rally (compared to rallies in the last one year) back to the highs and volume is again 23cr which is lesser than volume at previous highs.
Lesser volume could have 2 interpretations – there are less sellers this time and/or buyers are not interested.
🚀 Point7
The stock is back to the support again. But volume on downwaves is much lesser in relative terms. In fact, it decreasing from 13 to 4 and then 2cr (see chart). Where have the sellers gone? They don’t want to sell at the support.
🚀 Point8
Lack of selling leads to buying and eventually to new highs. Notice that there in very less volume at point 8 (only 4cr). This time sellers attempt (5cr) was failed quickly (without hitting support) and new highs were made outside resistance (developed at 2, 3 and 6).
At this stage, when the price is closing outside the resistance, I would expect more volume to come in. More volume at this stage would indicate that buyers are interested but that is not the case here.
🚀 Point9
Point 8 looked like a failed breakout attempt. The price fell back into the trading range (between support and resistance). If I look at volume here, it is 15cr on this downwave. In the immediately preceding fall with 17cr it touched the bottom end of the range but this time with 15cr it is just at the middle of the range. This signifies re-accumulation at point 9.
🚀 Point10
Re-accumulation lead to a rally back into resistance. We have 13cr as of now. Its too early to say, before this upwave ends, but 13cr is less (for me at this point) to push it any further. It seems holding back in the range.
🚀🚀 Final thoughts
This is a very nice and rare example showing both distribution (by the seller at resistance level) and accumulation (by the buyers at support level). Normally the price peeps outside the range on both sides and fails to follow through, until there is a decisive break on either side.
I hope you learnt something new in this post.
Now you can do one thing, press 🚀 to encourage me to write more educational stuff.
Thanks for reading.
