Impulse or Correction? One Line DecidesOne of the most common challenges in Elliott Wave analysis is deciding whether a strong rally is an impulse or just a corrective move . This chart of Bharat Forge serves as a practical example of how Elliott Wave rules help remove that ambiguity.
From the ₹919.10 low, price staged a sharp rally that appears to be unfolding as five waves advance. At first glance, this can easily be mistaken for the start of a new impulsive trend. However, Elliott Wave analysis is not based on appearances — it is based on rules .
The key rule illustrated here is straightforward:
In an impulse, Wave 4 must not overlap Wave 1 .
To apply this rule objectively, the chart highlights a Trend Qualification Line at ₹1362.10 . This level represents the termination of the initial advance from the lows to form Wave (1/A) at 1362.10 and acts as a structural divider.
If price moves below ₹1362.10, the overlap rule is violated. In that case, the entire advance from ₹919.10 should be treated as a corrective ABC structure, rather than an impulse. This would imply that the market is still in a broader corrective phase.
If, instead, price holds above ₹1362.10 and later moves above ₹1506.50, the overlap rule remains intact. This keeps the impulsive interpretation valid and allows the move from ₹919.10 to be viewed as a complete five-wave advance, potentially of a higher degree.
Momentum indicators provide useful context but do not define structure. In this case, the RSI dropping below 50 leans toward a corrective interpretation, but it does not override Elliott Wave rules.
Momentum can hint. Structure decides.
This example highlights why clearly defined levels like the Trend Qualification Line are so valuable in Elliott Wave analysis. They shift the focus from prediction to qualification, helping analysts stay aligned with price behavior rather than bias.
Elliott Wave

Part 1 Ride The Big Moves 1. Introduction to Option Trading
Option trading is one of the most versatile and dynamic segments of financial markets. Unlike traditional equity trading, where investors directly buy or sell shares, options give the right, but not the obligation, to buy or sell an underlying asset at a predetermined price on or before a specific date. This flexibility allows traders to hedge risks, speculate on market movements, and design strategies for income generation or protection against adverse price movements.
Options are derivative instruments, meaning their value derives from an underlying asset, which can be stocks, indices, commodities, currencies, or ETFs. The global options market has grown exponentially over the last few decades due to its ability to provide leverage, risk management tools, and strategic investment opportunities for both retail and institutional traders.
2. Basic Concepts of Options
To understand options trading, it’s essential to grasp some foundational concepts:
2.1 What is an Option?
An option is a contract that grants the holder the right, but not the obligation, to buy or sell a specific asset at a predetermined price (called the strike price) within a defined period (expiry date).
Call Option: Gives the holder the right to buy the underlying asset at the strike price.
Put Option: Gives the holder the right to sell the underlying asset at the strike price.
2.2 Key Terminology
Underlying Asset: The security on which the option is based.
Strike Price / Exercise Price: The price at which the underlying asset can be bought or sold.
Expiry Date: The date on which the option contract expires.
Premium: The price paid by the buyer to the seller for the option.
In-the-Money (ITM): Option has intrinsic value (e.g., a call option where strike price < current market price).
Out-of-the-Money (OTM): Option has no intrinsic value (e.g., a call option where strike price > current market price).
At-the-Money (ATM): Option strike price is approximately equal to the market price.
3. Types of Options
Options can be broadly categorized based on style, market, and underlying asset.
3.1 Based on Style
American Options: Can be exercised anytime before expiry.
European Options: Can only be exercised on the expiry date.
Bermuda Options: Can be exercised on specific dates prior to expiry.
3.2 Based on Market
Exchange-Traded Options (ETOs): Standardized contracts traded on regulated exchanges.
Over-The-Counter Options (OTC): Customized contracts traded directly between parties.
3.3 Based on Underlying Asset
Equity Options: Based on individual stocks.
Index Options: Based on market indices like Nifty, Sensex, S&P 500.
Commodity Options: Based on commodities such as gold, oil, or agricultural products.
Currency Options: Based on foreign exchange rates.
ETF Options: Based on exchange-traded funds.
4. How Options Work
Option trading involves two parties: the buyer and the seller (writer).
Buyer (Holder): Pays the premium and holds the right to exercise the option.
Seller (Writer): Receives the premium and has the obligation to fulfill the contract if the option is exercised.
For example:
Buying a call option gives the potential to profit if the underlying asset's price rises.
Buying a put option profits if the underlying asset's price falls.
Selling options can generate premium income but carries higher risk.

Invest With My NeoWave ChartsNamaskaram Everyone
This is an educational post in which i will describe how to read and trade with my wave Charts.
So first lets start by seeing a wave Chart.
First you will be seeing a S1 series called Short Term Trend.
Than a group of S1 is denoted by M1 series called Medium Term Trend.
Than a group of M series is marked by L series called Long term trend.
All this means is that smaller trend makes a bigger trend and than more bigger trend and than more.
This is how a wave structure become.
All these Short, medium and long term trend are called Degree.
You can think of them as a car gear like bigger the gear greater the speed of price and consolidation.
In my charts i used total 10 gears but i am showing you 9 degree.
See the below 3 images.
Degree List 1
Degree List 2
Degree List 3
Now there are few more things left-
Like you will be seeing some coding with C keyword like MC1,LC1, and a,AA,BB.
These are consolidation or correction counting.
Mean after a rally market rest or consolidate before resume another rally. We represent these consolidation period with LC1,AA,BB Like this.
Now see some examples by which you can judge how much time and price a particular degree or gear can consume-
Multiyear Trend
This is an Bank Nifty chart, if you see that multiyear cycle is running for past 25 years.
Each leg cover around 10 years.
Super Trend
Complete Cycle take 8 year, from 2012 to 2020
just imagine if you can think of an possibility in advance that next 8 years are going to bullish or bearish.
Namaskaram
Trading Psychology & DisciplineIntroduction
In the world of financial markets, traders often focus on technical analysis, fundamental research, algorithms, and news-driven events to make decisions. While these tools are essential, there is one element that is frequently underestimated yet plays a much bigger role in success: trading psychology and discipline.
Trading is not just about numbers, charts, or strategies—it is a game of emotions, mindset, and self-control. Even the most sophisticated strategies fail if the trader cannot control fear, greed, and impulsive behavior. On the other hand, an average trading system can become profitable in the hands of a disciplined and emotionally balanced trader.
This discussion will explore the psychological aspects of trading, the emotional challenges, common behavioral biases, and how discipline can transform a trader’s performance. We’ll also look at techniques and practices to build a resilient trading mindset.
1. The Role of Psychology in Trading
Trading psychology refers to the emotions and mental state that influence how traders make decisions in the market. Unlike professions where skills and experience directly translate into results, trading is unique because psychological factors often override logic.
For example:
A trader may have a solid strategy to exit a position at a 10% profit. But when the time comes, greed makes them hold longer, hoping for more, and the market reverses.
Another trader may see a perfect setup but doesn’t enter the trade because of fear after a previous loss.
This illustrates that psychology can either support or sabotage trading success. Research shows that 80–90% of retail traders lose money consistently—not always because of poor strategies, but due to a lack of discipline and emotional control.
2. Key Emotional Challenges in Trading
Let’s examine the major psychological challenges that traders face.
a) Fear
Fear is the most dominant emotion in trading. It manifests in different ways:
Fear of losing money (not taking a trade).
Fear of missing out (FOMO—jumping into a trade too late).
Fear of being wrong (holding on to losing positions).
Fear often leads to hesitation, early exits, or missed opportunities.
b) Greed
Greed drives traders to:
Overstay in profitable trades.
Over-leverage positions.
Overtrade (taking too many trades in a day).
While the market rewards patience, greed often blinds judgment.
c) Hope
Many traders fall into the trap of hope, especially with losing trades. Instead of cutting losses, they keep hoping the market will reverse in their favor. Hope replaces rational decision-making.
d) Revenge Trading
After a loss, traders sometimes feel the need to recover money immediately. This leads to impulsive trades without proper setups—often resulting in bigger losses.
e) Overconfidence
Success can be as dangerous as failure. After a winning streak, traders may become overconfident, take unnecessary risks, or abandon risk management—leading to devastating drawdowns.
3. Behavioral Biases in Trading
Trading psychology overlaps with behavioral finance, where human biases cloud rational thinking. Some common biases include:
Loss Aversion Bias – The pain of loss is psychologically stronger than the pleasure of gain. Traders avoid booking small losses, leading to bigger ones.
Confirmation Bias – Traders look only for information that supports their trade idea, ignoring opposing signals.
Anchoring Bias – Traders anchor to a certain price level (like the price they bought at) and refuse to sell below it.
Herd Mentality – Following the crowd without analysis, often during market bubbles.
Recency Bias – Giving more weight to recent outcomes rather than long-term performance.
These biases affect judgment and lead to poor decision-making.
4. The Importance of Discipline in Trading
If psychology is the foundation, discipline is the structure that holds a trader’s career together. Discipline in trading means sticking to rules, risk management, and strategies regardless of emotions.
A disciplined trader:
Enters trades only when rules align.
Exits trades at predefined stop-loss or target levels.
Maintains position sizing regardless of emotions.
Accepts losses as part of the business.
Avoids impulsive and revenge trading.
Discipline converts trading from gambling into a professional business.
5. The Mindset of a Successful Trader
Professional traders think differently from amateurs. They focus on process over outcome. Their mindset includes:
Probability Thinking
No trade is guaranteed. Each trade is just one outcome in a series of probabilities. Accepting this reduces emotional pressure.
Detachment from Money
Professionals see money as a tool, not an emotional anchor. They measure success in terms of following their plan, not short-term profits.
Adaptability
Markets change constantly. Disciplined traders adapt rather than stubbornly sticking to failing strategies.
Patience
They wait for high-probability setups rather than forcing trades.
Long-term Focus
Success is measured in months and years, not a single trade.
6. Building Trading Discipline
Discipline is not automatic—it requires conscious practice. Here’s how traders can develop it:
a) Create a Trading Plan
A trading plan defines:
Entry and exit rules.
Position sizing.
Risk-reward ratios.
Markets and timeframes to trade.
Maximum daily/weekly losses.
Without a plan, emotions take over.
b) Use Risk Management
Risk per trade should never exceed 1–2% of capital. Stop-loss orders should be predefined. This ensures survival even during losing streaks.
c) Keep a Trading Journal
A journal helps track:
Why you entered a trade.
Emotions felt during the trade.
What went right/wrong.
Over time, patterns emerge, revealing weaknesses in psychology and strategy.
d) Practice Mindfulness
Mindfulness techniques such as meditation, deep breathing, or visualization help traders stay calm during stressful market conditions.
e) Accept Losses as Normal
Even the best traders lose frequently. What matters is keeping losses small and letting winners run. Accepting losses removes emotional baggage.
f) Avoid Overtrading
Set daily/weekly limits on trades. This prevents emotional exhaustion and impulsive decisions.
7. Practical Techniques to Improve Trading Psychology
Here are actionable steps:
Pre-Market Routine – Spend 10–15 minutes visualizing scenarios, checking news, and calming the mind.
Set Daily Goals – Focus on execution (e.g., “Follow my plan”) rather than monetary goals.
Take Breaks – Step away after a loss or win streak to reset emotionally.
Limit Screen Time – Over-monitoring leads to anxiety. Check setups at predefined times.
Simulation/Backtesting – Helps build confidence in a system before using real money.
Accountability Partner – Sharing trades with another trader builds discipline.
8. Case Studies: Trading Psychology in Action
Case 1: The Fearful Trader
A new trader avoids trades after a big loss. Despite seeing good setups, fear paralyzes action. Over time, opportunities are missed, and frustration builds.
Lesson: Risk management and small position sizing reduce fear.
Case 2: The Greedy Trader
Another trader doubles account quickly during a bull run, but refuses to book profits. Overconfidence leads to leverage, and one market crash wipes out everything.
Lesson: Discipline and humility are essential.
Case 3: The Disciplined Trader
A professional trader takes 40% win rate trades but manages risk with 1:3 reward ratios. Despite losing more trades than winning, account grows steadily.
Lesson: Discipline beats emotions.
9. The Role of Technology and Psychology
Modern trading platforms provide tools like:
Automated trading systems – Reduce emotional interference.
Alerts and stop-loss automation – Enforce discipline.
Analytics dashboards – Help track performance.
But even with technology, psychology remains the deciding factor, since traders often override systems when emotions take over.
10. Long-Term Development of Trading Mindset
Trading psychology is not built overnight. It requires years of consistent practice. Key long-term practices include:
Reading trading psychology books (e.g., Trading in the Zone by Mark Douglas).
Engaging in regular self-reflection.
Accepting that markets are uncertain.
Developing resilience to handle both drawdowns and success.
The goal is to become a trader who is calm in chaos, rational under stress, and disciplined under temptation.
Conclusion
Trading psychology and discipline are the invisible forces behind every successful trader. Strategies and indicators provide the “how,” but psychology answers the “why” and “when.”
Fear, greed, and biases sabotage results.
Discipline enforces consistency and professionalism.
A strong trading mindset focuses on probabilities, risk management, and patience.
Ultimately, trading is not a battle with the market—it is a battle with oneself. Mastering psychology and discipline transforms trading from an emotional rollercoaster into a structured, profitable business.
As the saying goes:
“In trading, your mind is your greatest asset—or your biggest enemy. The choice is yours.”

Trading Master Class With ExpertsReal-Life Applications of Options
Options are not just trading tools; they have practical uses:
Insurance companies use options to hedge portfolios.
Exporters/Importers hedge currency risks using options.
Banks use interest rate options to manage risk.
Investors use protective puts to safeguard their stock portfolios.
Psychology of Options Trading
Trading options requires discipline. Many beginners blow up accounts because:
They buy cheap OTM options hoping for jackpots.
They ignore time decay.
They overtrade due to low cost of entry.
A successful option trader thinks like a risk manager first, profit seeker second.

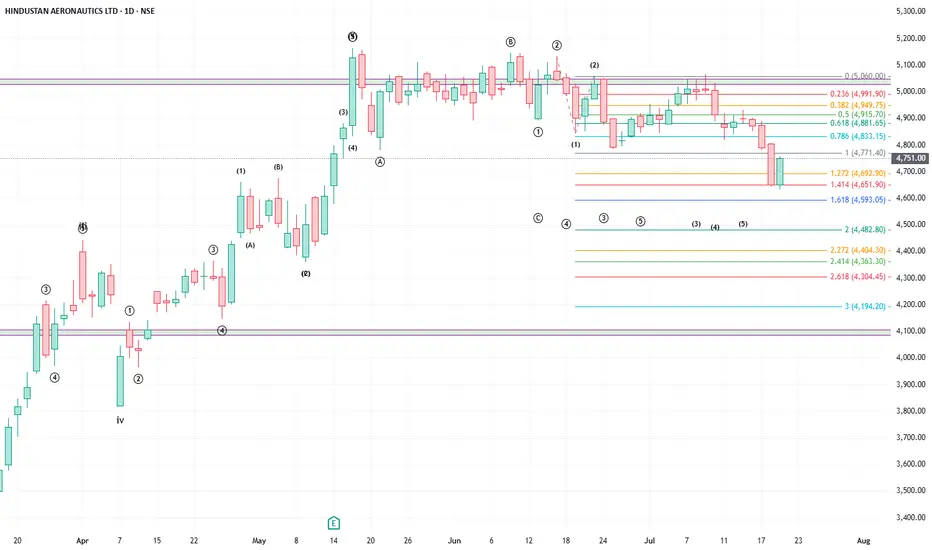
What Is Consolidation? How Can Wave Theory Help You Trade it?
Let’s take HAL as a live example to understand a concept many traders struggle with — "Consolidation".
HAL has been moving sideways ("consolidation") since May 19 and gave a downward breakout on June 24. Yesterday, it formed a strong green candle, which left many traders wondering:
“Is this a buying opportunity or a sell-on-rise setup?”
The conflicting signals during consolidation are exactly what make it confusing. But Elliott Wave Theory can bring clarity.
Wave Perspective: Not Just Sideways — It is a "Flat Correction"
The current price action resembles a Flat corrective structure, one of the three classic Elliott corrective patterns (the others being Zigzag and Triangle). A Flat follows a 3-3-5 structure:
Wave A: Three waves down (corrective)
Wave B: Three waves up (can go above the start of A)
Wave C: Five-wave impulse down — sometimes with an extended wave (i.e. one of the waves shall have 5-sub waves).
Until Wave C fully unfolds, the correction is not complete. Any upside move in between is likely to be a counter-trend wave, not the start of a new trend.
So, What Is Consolidation?
From a wave perspective, consolidation is not random. It’s a structural necessity — the market is completing a complex correction before the next impulsive leg begins.
In strong stocks like HAL, you’ll often see:
A temporary bounce from Fibonacci extension levels which leads to price re-entering Wave 1 territory, which would invalidate an impulse but still fits a corrective structure. A new wave count has to happen again which prolongs the impulse formation. A prolonged sideways to downward move, not because of indecision, but because Wave C hasn’t finished.
How This Helps You Make Better Trading Decisions
The recent green candle may seem bullish, but if it's part of Wave C, it’s just a counter-wave bounce. Elliott Wave structure warns against early entries during such bounces. It suggests a more informed approach: “Sell on rise” until the full correction plays out
Key Takeaway
Consolidation isn’t noise — it’s structure.
When you understand the wave context, you stop guessing and start anticipating.
What’s your view? Are you trading this move or waiting for Wave C to complete? Leave your comments.
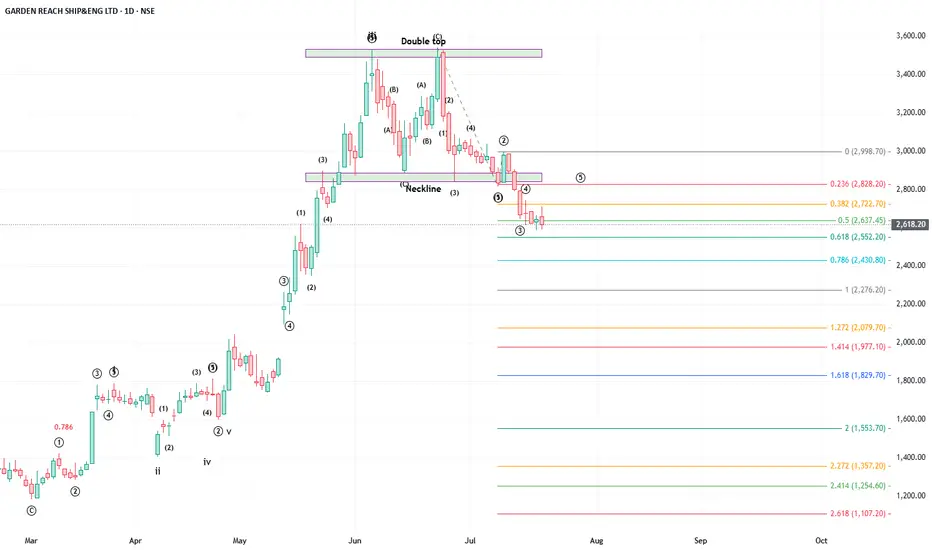
The “M” Pattern: A Swing Trading vs. Wave Trading PerspectiveSwing Trading View
In swing trading, the M pattern is a widely recognized and frequently traded formation. It typically signals a potential trend reversal and is considered the opposite of the W pattern, which indicates bullish setups.
The M pattern presents two main trading opportunities for swing traders:
Short at the Double Top:
When the price forms a double top, traders often enter a short position targeting the neckline as the profit zone. This setup banks on the failure of the price to break previous highs, indicating exhaustion in bullish momentum.
Long at the Neckline Bounce:
If the price reaches the neckline and bounces upwards, traders may initiate a long position, aiming for the previous swing high. This move anticipates a potential failed breakdown or a continuation of the broader trend.
In both cases, trailing stop-losses can be employed to ride the trade further if momentum continues. However, swing traders must rely on discretion and market context to decide when to exit, as there's no deeper structural guide beyond the pattern.
Wave Trading View
From an Elliott Wave perspective, patterns resembling the letter “M” often arise during a Flat correction, one of the three core corrective structures—Zigzag, Flat, and Triangle.
Flat corrections unfold in a 3-3-5 wave structure, labeled as waves A-B-C:
In a bullish market correction,
Wave A: Downward move (3 waves)
Wave B: Upward retracement (3 waves)
Wave C: Final downward move (5 waves)
Flats occur in three variations:
Regular Flat: Waves A and B are nearly equal in length, with Wave C slightly longer.
Expanded (Extended) Flat: Wave B travels beyond the start of Wave A, often reaching up to 1.33x Wave A. If Wave B exceeds 1.33x, it is no longer considered a valid flat.
Running Flat: Wave C does not surpass the end of Wave A, creating a skewed M-like shape.
In this structure:
The “M” appearance is most prominent when plotted visually, especially in regular or extended flats (as found in the accompanied chart of GRSE).
The unique edge for a wave trader lies in contextual awareness—knowing where flats are likely to form based on the wave formation.
Unlike swing traders who trade patterns in isolation, wave traders operate within a broader map, allowing them to:
Anticipate the pattern in advance
Position precisely within the structure
Manage trades with greater confidence based on Fibonacci relationships and wave counts
Wave C is particularly important:
It must consist of 5 sub-waves. Its minimum length should be equal to the distance from the start of Wave A to the end of Wave B. Even if this ratio is only marginally exceeded, the presence of a clear 5-wave subdivision confirms the end of the correction, subject to end of sub-wave 5.
In essence, while both swing and wave traders may trade the same “M” pattern, the wave trader approaches it with far deeper context, structure, and predictive insight—enabling more precise and confident trading decisions.
Classic Double Correction PatternThis is a classic example of Double correction (Double three) in HDFCLIFE.
Marked in the first box, we can see Flat Correction where wave B is retraced to the 81% level. We are fulfilling the minimum requirement (61.8%) of wave B. Here in wave C, we see three waves. This is the first hint of an upcoming complex correction. The whole wave is marked as W here.
In the second box, there is a perfect Zig-zag pattern. Wave B is retraced to 50% here. Also, we can see three waves in wave C, which gives us wave Y.
These two waves are connected by wave X which is retraced to 111%.
This is the best example of Double correction.
This analysis is for educational purposes only.
This analysis is based on Elliott Wave theory and Fibonacci analysis.

Classical example of Elliott waveClassical example of Elliott wave.
Wave 2 retraced to 61.8% forming Flat correction.
Wave 3 extended to 161.8% forming a normal or trending impulse.
Then wave 4 retraced to 23.6% in Zig-zag form. (This fulfilled the Rule of Alternation)
Wave 5 retraced exactly to its minimum target of 127% retracement. Where cluster of 200% extension was also there. Wave 5 formed in typical Ending diagonal format.
Here bigger wave 1 completed.
Now fall will come in NUVAMA forming bigger wave 2.

Stay Ahead: Essential Tips to Avoid Trading PitfallsHello TradingView Community!
I'm excited to share some valuable insights on trading pitfalls and how to navigate them effectively. Trading in financial markets can be a challenging journey, but understanding common pitfalls and methods to avoid them can significantly enhance your success. Here are 10 pitfalls traders often encounter and actionable strategies to help you steer clear of them:
Having No Trading Plan:
Entering trades without a plan can lead to impulsive decisions. Develop a clear trading plan outlining your goals, strategies, entry and exit points, and risk management.
Using Strategies That Don't Match Your Personality:
Align your trading strategies with your personality, risk tolerance, and lifestyle. A good match helps you stay consistent and focused.
Having Unrealistic Expectations:
Set realistic goals based on your initial capital and risk tolerance. Trading is not a quick path to wealth, so be patient and persistent.
Taking Too Much Risk:
Avoid over-leveraging and using excessive position sizes. Implement risk management techniques like stop-loss orders and diversification.
Not Having Rules to Follow:
Create a set of trading rules to guide your decisions. These rules provide structure and help you stay disciplined.
Not Being Flexible to Market Conditions:
Adaptability is key in trading. Monitor the markets and adjust your strategies as conditions change.
Failing to Take Responsibility for Your Results:
Own your successes and mistakes. This mindset empowers you to learn, grow, and improve your trading.
Being Addicted to Volatility:
While volatility can be exciting, avoid chasing it for thrills. Focus on making well-reasoned decisions based on your plan.
Not Having a Process to Keep Track of Your Performance:
Maintain detailed records of your trades and their outcomes. Analyze this data to identify patterns and refine your strategies.
Not Dealing with Your Emotional Risk:
Emotions can cloud your judgment in trading. Practice emotional intelligence and techniques like meditation or journaling to stay composed.
Neglecting Proper Research and Due Diligence:
Relying solely on tips or rumors can lead to poor decisions. Conduct thorough research and due diligence on potential trades and investments.
Overcomplicating Your Trading Strategy:
Complex strategies may not always lead to better results. Simplify your approach to focus on proven methods and avoid overanalyzing the market.
Ignoring the Importance of Continuous Learning:
The markets evolve, and so should your knowledge and strategies. Stay updated on market trends and continuously educate yourself to stay ahead.
There is no trade without a stop-loss:
This point emphasizes the importance of having a stop-loss in place before entering any trade. It highlights risk management as a fundamental part of trading, ensuring that you have a clear exit strategy to limit potential losses.
If you have to re-analyze charts after being in a trade, you might be going in the wrong direction:
This point underscores the importance of trusting your initial analysis and trading plan. It warns against second-guessing or changing your plan mid-trade, which could indicate you may be heading in the wrong direction.
By implementing these strategies, you can enhance your trading experience and improve your performance over time. Remember, successful trading is a journey that requires discipline, patience, and continuous learning.
I hope you find these insights helpful. Feel free to share your thoughts and experiences in the comments. Let's continue to support each other and grow as a community!
Happy trading!
RK💕
I am not Sebi registered analyst.
My studies are for educational purpose only.
Please Consult your financial advisor before trading or investing.
I am not responsible for any kinds of your profits and your losses.
Most investors treat trading as a hobby because they have a full-time job doing something else.
However, If you treat trading like a business, it will pay you like a business.
If you treat like a hobby, hobbies don't pay, they cost you...!
Disclaimer and Risk Warning.
The analysis and discussion provided on in.tradingview.com/u/RK_Charts/ is intended for educational purposes only and should not be relied upon for trading decisions. RK_Charts is not an investment adviser and the information provided here should not be taken as professional investment advice. Before buying or selling any investments, securities, or precious metals, it is recommended that you conduct your own due diligence. RK_Charts does not share in your profits and will not take responsibility for any losses you may incur. So Please Consult your financial advisor before trading or investing.

Adani PowerRules Of Elliott Wave Theory:
#1.Wave 2 never retraces more than 100% of wave 1.
#2.Wave 3 cannot be the shortest of the three impulse waves, namely waves 1, 3 and 5.
#3.Wave 4 never enters the price territory of wave 1.

XAUUSD Elliot Wave LabelingLet’s take this labelling as a case study.
The red ABC pattern is a 3-wave pattern. It’s a correction.
Corrections happen in waves 2 and 4.
This entire correction happened in wave 2. After wave 2 comes wave 3. That sharp upward spike on the right is wave 3. Wave 3 will help price to resume its upward trend.
Now, inside that ABC correction is another correction. It’s a 5-wave pattern called a triangle. A triangle is a wave that is always before the last impulse in a given cycle.
In this case it happened as wave B which was before the last impulse (wave C). It can also happen as wave 4 which is before the last impulse called wave 5.

How To Trade with Neowave Trading IdeaHello Everyone,
Welcome to you all, this is an educational post in which you will learn how to trade with our neowave trading chart. For better understanding also watch the video which will be available soon.
See the below image
## This is how a Neowave structure looks in which a stock price goes up and down.
##These no 12345, I called them motive waves mean trending direction. As you can see these are in diffrent colors. Each color represent a trend cycle mean for how many days this particular stocks is going up or down.
See the below example
## As you can see in below examples , group of smaller cycles made bigger cycles and bigger cycles made more bigger cycles and so on
Example 1
Example 2
## But this hard to understand for ordinary eyes and neowave coding style is always differ between neowave analyst also. For one neowave analyst one trend is short and for other it can be intraday.it just there perspective. For every other person 12345 is create confusion, hard to tell how long this trend will go up. you just dont know this 12345 is short term cycle or longterm cycle.
To solve this i am changing coding style
##As name represent itself its cycles s for short cycles, m for medium cycles and l for longterm cycles.
see the below chart
Now see the below image for another part of neowave which is called correction
## As you know every trending cycles, there comes an consolidation period in which price gives some retracement but never retraced 100 percent of previous trend. This consolidation is represent as correction in neowave.
## This correction comes in same cycles in which the cycles was trend. As you can see short cycles trend in the image, after s5 there comes a flat pattern which is labbeld as SC1, this c stand for correction.same for ther cycles.
These are the list of the cycles which will be labbled in my chart.
See the below chart for complete list.
Now next part is important for you. These are the expected time frame for the repected cycles.
If you love the post than give it a boost and keep following us for more trading idea.
Thank You

How To Trade with Neowave Trading IdeaHello Everyone,
Welcome to you all, this is an educational post in which you will learn how to trade with our neowave trading chart. I also made an post of it for quick learning.
If you like it than give us boost and share the content.
Thank You

Zig Zag corrective pattern and the Case study of Natural GasHello Friends,
Here we had shared some major points and characteristics of Zigzag Correction pattern of Elliott waves.
Also we had shared real example chart study of zigzag pattern as a case study of NaturalGas, in which their are some principles and guidelines, which are perfectly going through in chart of NaturalGas.
Principles and Guidelines of Zigzag correction pattern
1) Zigzag correction pattern is a 3 waves structure which is labelled as A-B-C
3) Subdivision of wave A and C is 5 waves, either impulse or diagonal
4) Wave B can be any corrective structure as 3 subdivisions
5) Zigzag is a 5-3-5 correction structure
Fibonacci measurements
Wave B is always contra trend which generally retraces near 50% or 61.8% of wave A, and can also retraces up to 85.4% to 90% of wave A
Wave C can generally be expected near 100% of wave A, but sometimes if it is extended then it can show 123.6%, 138.2% or up to 161.8% also.
Sometimes if wave C is truncated then it can be near 61.8% of wave A.
But ,If wave C is going more than 161.8% of wave A, then we should be cautious, because it can also be some kind of impulse wave instead of corrective wave.
Case Study of Natural Gas
Natural Gas almost done as expected till now as per zigzag corrective pattern, it would not be wonder if it looks to be doing a double correction higher in wave (ii) bounce & can see 2.786 level sometimes in next week before turning down as a wave (iii) of 5 of (C), On lower time frame if it doesn't crosses high of March 2023, then it can show some down moves to complete wave (iii), (iv) and (v) of 5 of bigger degree wave (C).
After big correction as zigzag pattern which had already reached extreme levels in wave (C) which is more then 123.6% of wave (A), so now anytime it can start fresh impulse moves towards north directions, so instead of finding selling opportunities, one should try to find buying opportunities only after confirmation, and confirmation is price crossing high of march 2023, once its crossed peak point of march 2023 then no selling is recommended, then its only buy on dips with invalidation levels of Low of April 2023 as a stoploss, because it must be ending the bigger correction from last year peak, and can be taken as fresh impulse is started.
I am not Sebi registered analyst.
My studies are for educational purpose only.
Please Consult your financial advisor before trading or investing.
I am not responsible for any kinds of your profits and your losses.
Most investors treat trading as a hobby because they have a full-time job doing something else.
However, If you treat trading like a business, it will pay you like a business.
If you treat like a hobby, hobbies don't pay, they cost you...!
Hope this post is helpful to community
Thanks
RK💕
Disclaimer and Risk Warning.
The analysis and discussion provided on in.tradingview.com/u/RK_Charts/ is intended for educational purposes only and should not be relied upon for trading decisions. RK_Charts is not an investment adviser and the information provided here should not be taken as professional investment advice. Before buying or selling any investments, securities, or precious metals, it is recommended that you conduct your own due diligence. RK_Charts does not share in your profits and will not take responsibility for any losses you may incur. So Please Consult your financial advisor before trading or investing.
NEducation

EXPANDED / IRREGULAR FLAT CORRECTIONHello Friends,
Here we had shared some major points and characteristics of Expanded Flat Correction also known as Irregular Flat Correction in Elliott waves.
Principles of Irregular / Expanded Flat correction pattern
1) 3 waves corrective pattern which is labelled as A-B-C
2) Subdivision of wave A and B are in 3-3 waves
3) Subdivision of wave C is in 5 waves
4) Wave B of the 3-3-5 pattern completes beyond the starting level of wave A
5) Wave C completes beyond the ending level of wave A
Fibonacci measurements
Wave B is always 123.6% to 138.2% of measurement of wave A
Wave C completes at least 123.6% to 161.8% of wave A which starts from end of wave B
I am not sebi registered analyst.
My studies are for educational purpose only.
Please Consult your financial advisor before trading or investing.
I am not responsible for any kinds of your profits and your losses.
Hope this post is helpful to community
Thanks
RK💕
Most investors treat trading as a hobby because they have a full-time job doing something else.
However, If you treat trading like a business, it will pay you like a business.
If you treat like a hobby, hobbies don't pay, they cost you...!
Disclaimer and Risk Warning.
The analysis and discussion provided on in.tradingview.com is intended for educational purposes only and should not be relied upon for trading decisions. RK_Charts is not an investment adviser and the information provided here should not be taken as professional investment advice. Before buying or selling any investments, securities, or precious metals, it is recommended that you conduct your own due diligence. RK_Charts does not share in your profits and will not take responsibility for any losses you may incur. So Please Consult your financial advisor before trading or investing.

Basics of Elliot Waves.Hello Traders!
1. Today, we will discuss the basic market movement structure, elliotically . A recent comment on one of my ideas published pointed (indirectly) towards the need for a basic understanding of Elliot Waves for the general trading public.
2. The market moves in consistent impulsive and corrective structures . Waves 1, 2, 3, 4, and 5 together form the 1st Impulsive structure of the market. Waves A, B, and C together form the next Corrective structure of the market.
What is an Impulsive Structure ? These are patterns that occur in the direction of the trend. A movement consisting of 5 smaller cycle waves and following certain set rules/guidelines set by Elliot; Wave 2 never retraces more than 100%, Wave 3 is never the shortest, & Wave 4 does not enter the price territory of Wave 1. The 3rd rule is at times compromised and that should be up for discussion some other day. More rules exist but are not required for the basic understanding of the markets.
What is a Corrective Structure ? We will put this very vaguely. Whatever is not impulsive, is corrective, in laymen's terms.
3. Let's address the Impulsive structure .
Waves 1, 3, and 5 are impulsive waves within the impulsive structure. Waves 2 and 4 of this impulsive structure stand to be corrective. Waves 1, 3, and 5 consist of 5 waves each. Waves 2 and 4 consist of 3 waves each.
4. Now we'll address the next Corrective structure . Wave A and C of this structure are impulsive whereas Wave B is of corrective nature.
Waves in the corrective structure are very interesting. Wave A can at times consist of 5 waves as well as 3, even though impulsive, and can also be a diagonal. Wave B can sometimes contain 5 waves, when in a form of a triangle, even though corrective. Wave C always has only 5 waves and can be a diagonal as well. The corrective waves are a whole lot more complicated and require a vigorous understanding of the structures.
5. Every wave structure is part of a larger wave structure on a larger timeframe. 5 impulsive, 3 corrective waves of the smallest cycle; which will form Waves 1 and 2 of a larger cycle. Then these two waves along with 3, 4, 5, and the next correction set, will form the 1st and 2nd waves of an even larger cycle. This is how our final wave structure (basic) would look like.
The world moves in harmony with progression and recession. And so do the markets. All they need is an observer. Be one.
Happy observing!
Profits,
Market's Mechanic.

NIFTY.. ELLIOT WAVES AND RSI Nifty corrected in a downward Elliot 5-wave pattern. The impulse waves 1, 3, and 5 are equal in length.
The Elliot waves are complete only at the end of the 5th wave of the 5th major wave.
This is also confirmed by the divergence in RSI.
The market is likely to continue its original uptrend after the completion of the downward correction.

Basic patterns of Elliott Wave Theory ExplainedTHE INTRODUCTION
As you all know the waves always moves in zig zag fashion, either it moves up or it moves down, but the pattern always remains same i.e. Zig zag.
So, the most important question is, with which method one can define the trend or some meaningful pattern, which can help anyone to plan his trade & other opportunities.
There are multiple technical indicators available which can help to identify the patterns. However, the method which I use is The great Elliott Wave Theory.
In this post I would like to summarize all of the basic Elliott Wave patterns.
Here, in the Elliott Wave world, waves are always of two types.
1- Impulsive
2- Corrective
CYCLE
Whenever one impulse and corrective waves get combined one cycle is formed.
Here, I have drawn the graphical representation of same.
IMPULSIVE WAVES
A Impulse is the combination of five wave structure, where all five waves are termed as: wave: 1,2,3,4 & 5
SUB STRUCTURE:
Here, wave 1, 3 & 5 always sub divides into five smaller waves (*)
(•)Waves 1 & 5 sometimes also gets converted into leading diagonal & ending diagonal.
And, waves 2 & 4 always gets completed into a combination of three wave s structure. (structures could be simple or complex) (A separate topic) (also called as the corrective waves)
CORRECTIVE WAVES
ZIG ZAG
Zig Zags are the pattern having the combination of three waves. (Wave a, b & c) Where, Wave A, subdivides into five waves , Wave B, sub divides into three waves and, Wave C, sub divides into five waves
Here, I have drawn graphical representation of same.
FLAT
FLATS are the pattern having the combination of three waves. (Wave a, b & c)
Where, Wave A, subdivides into three waves Wave B, sub divides into three waves And, Wave C, sub divides into five waves
Here, I have drawn graphical representation of same.
TRIANGLES
A Triangle is the side ways price moves, bounded by converging trend lines. Internal wave in a triangle sub divides into 5 sub waves, named as A,B,C,D & E which further sub divides into 3 sub waves.
Triangle often called as the terminating waves patterns, as it always terminates the big wave structure.
LEADING DIAGONAL
It consists of five sub-waves, labeled 1-2-3-4-5, Here, waves 1 & 4 always overlaps (exception) & Here, wave 1,3,5 sub divides into 5 sub waves & waves 2,4 sub divides into 3 sub waves.
ENDING DIAGONAL
It also, consists of five sub-waves, labeled 1-2-3-4-5, Here, waves 1 & 4 always overlaps (exception) & Here, wave 1,2,3,4,5 sub divides into 3 sub waves
The patterns explained above are some of the basic patterns of " The Elliott Wave Theory" In future I would to cover separate topic in great detail..
Stay Tuned....

Bank Nifty:Bow-Tie Diametric pattern nearing it's completion#Characteristics of Bow-Tie Diametric pattern
*It's a seven legged Elliot / Neo wave corrective pattern
*Wave A=G,B=F,C=E.wave D is connector.
*Wave B takes less time then wave A took to form,and can correct wave A by more then 61.8%.
#Reasons for not considering this entire swing as an impulse/triangle move
*Wave B has retraced wave A more then 61.8%(In an impulse as per Neo wave , wave 2 does not retrace wave 1 by more then 61.8%)
*Wave B took less time then wave A took to form.(In an impulse as per Neo wave , wave 2 takes more time then wave 1 took to form)
*Wave C has not extended wave A by 161.8%.(In an impulse as per Neo wave ,either wave 3 or wave 5 extend's wave 1 by 161.8%)
*Wave D enter's wave A territory.(Here it doesn't)
#Findings/Analysis of this pattern
*currently we are in 5th leg of this 7 leg's pattern.Price wise pattern has achieved wave E has achieved it's 100% extention target of wave C,hence going forward we can expect a downward movement of price in the form of wave F till 35900(100% extention target of wave B).Post wave F we can expect another move on the upside in the form of wave G(final leg of the pattern) which can take price in between 36850-37400,post which we can expect price to drop till 34250-350 depending upon where wave G ends as per post pattern implication of Diametric pattern.
#Possible Action that can be taken as a trader as per current scenario.
*One should start exiting long's in part's if not fully exiting there long's.
*Should wait for wave G to complete post which one can go short on the faster retracement of wave F's low.
PS:Price path discribed here is an ideal path discribed in books as per Neo wave .Reality can defer.
Disclaimer:Trade should not be taken solely on the basis of this analysis.Posting this just for my future reference.

How To Read Neowave Charts by Neowave ForecastHello Traders and Investors
My Name is Manish Singh and i am an expert in Neowave. In this chart i have describe the coding method to read my charts.
In Neowave Charts Degree labels used as intermediate, primary and cycle degree which is hard to understand by new user. Actually they understand 1 to 5 labels but they dont get the quiet idea in one look in which trend is this count is given. Thats why i came up with something simpler. So i am publishing this in the hope they everyone new trader easily understand the chart that it is in corection or in motive wave and for what time frame.
As they follow my charts, than with time they will understand which degree takes how much amount of time approximately to complete its structure and it surely does in learning the neowave.
Anyway friend kindly tell how you like the idea of this kind of coding.
I am also puting some examples of chart here.
1) This is the chart of nifty in which long term wave is in correction and you can judge with the help of medium wave degree that where is long term wave correction can end or actually new trend is going to start now or it become a failure. you can judge the chart pattern with is also as you can see this is an flat structure.
2) This is another chart of USD/JPY
In this chart i have used the old style of coding so that you can compare which one is easier to understand trend. As you can clearly understand with the help of count that it is going up but you were unable to catch that in which degree it is up or how long it will sustain there. Is there much bigger degree from the current one i am seeing.

EDUCATION- GRAPHICAL DIAGONAL PATTERN IN DETAIL_ELLIOTT WAVEThis is the educational post regarding the types of diagonal patterns-
SUMMERY :
LEADING DIAGONAL
ENDING DIAGONAL
LEADING DIAGONAL
Always form in inner wave of wave (1), so one can expect wave(2,3,4 & 5) within main impulse wave to complete the pattern.
PATTERN:
1- Comprises of (5-3-5-3-5 (inner waves)) or (3-3-3-3-3) (inner waves)
2- wave (4) always overlaps wave (1), but can't go beyond origin of wave (1)
3- wave (3) > wave (1) & wave (5) could be >than wave(1)
4- wave (3) max projection 161.8% (fib ratio) and it can't be shortest wave among all waves
5- wave (5) can't truncate
6- wave (5) max projection 61.% of wave (1) and wave (3), but can't go beyond line joining wave (1) and wave (3)
7- LD can either be expanding(ED), converging (CD) or parallel wedge
To enter in this pattern one should wait for the complete formation of LD and enter after completion of wave (2) after completion of LD !
ENDING DIAGONAL
Always form in inner wave of wave 5 of any impulse. Whenever you are observing, something like ED, one should make sure wave (1), wave (2), wave (3) and wave (4) has been completed so far.
PATTERN
1- Inner structure (3-3-3-3-3) (5 sub waves in total)
2- wave (1), (2) &(3) is always a simple zig-zag
3- wave (2) & (4)could be anything within (a-b-c) pattern
4- Here also, wave (1) and wave (4) overlaps as of LD
5- Wave (3) can't go beyond 161.8% (fib level), as of LD
6- wave (5)can be > = 61.8% of wave (1) and (3) but can't go beyond line joining wave (1) and wave (3)
To enter in this pattern one should wait for the complete formation of ED and enter after completion of wave (5) after completion of ED !

Running triangle Leading and Ending Diagonals
Comparison between Running triangle-Leading and Ending Diagonals
Chart 1 depicts a theoretical structure of Running triangle and an ending diagonal in a down trend.
As mentioned the comparison is in a downtrend. Accordingly downward move is termed as directional move and move to the upside is termed as non-directional.
A running triangle has non-directional momentum ie faster moves to the upside (wave A, C and E) than the downward moves (Waves B and D). These non-directional moves donot retrace the previous move completely.
On the contrary, Ending diagonal has directional momentum ie faster moves to the downside (waves 1, 3 and 5) in the direction of trend and these downward moves completely retrace the previous non-directional corrective moves (wave 2 and 4).
Chart 2 depicts a theoretical structure of Running triangle and an ending diagonal in an uptrend.
Differences in a running triangle and leading diagonal is opposite to that mentioned for downtrend.
As mentioned the comparison is in an uptrend. Accordingly upward move is termed as directional move and move to the downside is termed as non-directional.
A running triangle has non-directional momentum ie faster moves to the downside (wave A, C and E) than the upward moves (Waves B and D). These non-directional moves donot retrace the previous move completely.
On the contrary, Ending diagonal has directional momentum ie faster moves to the upside (waves 1, 3 and 5) in the direction of trend and these upward moves completely retrace the previous non-directional corrective moves (wave 2 and 4).
