Trade Rate Sensitive Assets: A Comprehensive OverviewIntroduction
In the global financial markets, assets are often influenced by fluctuations in trade rates, currency values, and interest rates. Trade rate sensitive assets are those whose valuations, returns, or profitability are significantly affected by changes in trade rates or related economic variables. Understanding these assets is crucial for investors, traders, and policymakers, as shifts in trade rates can impact everything from corporate earnings to sovereign debt sustainability. In this discussion, we will explore what trade rate sensitive assets are, the types of assets affected, the mechanisms of sensitivity, and practical strategies for managing associated risks.
Definition of Trade Rate Sensitive Assets
Trade rate sensitive assets are financial or physical assets whose value is directly or indirectly influenced by trade rates, exchange rates, or global trade dynamics. In this context, “trade rate” refers to the cost of importing or exporting goods and services, often mediated by currency exchange rates and tariffs. When trade rates fluctuate due to changes in currency valuations, trade policies, or global demand, the cash flows and profitability of these assets can be materially affected.
For example, a company that exports electronics from India to the United States may find that its revenue in Indian Rupees rises or falls depending on the USD/INR exchange rate. Similarly, bonds issued in foreign currency, commodities, or equity of export-driven companies are considered trade rate sensitive.
Categories of Trade Rate Sensitive Assets
Equities of Export-Oriented Companies
Companies engaged in global trade, particularly exporters, are highly sensitive to changes in trade rates. For instance:
Exporters: Revenue depends on foreign currency inflows. A stronger domestic currency reduces the local-currency value of foreign revenue, negatively impacting profits.
Importers: Firms reliant on imported raw materials may face higher costs if the domestic currency weakens, squeezing profit margins.
Examples include:
Technology companies exporting software or hardware.
Commodity companies exporting metals, agricultural products, or chemicals.
Foreign Currency Bonds
Bonds issued in foreign currency expose investors to trade rate and currency risk. When trade rates impact currency valuations:
The local-currency value of coupon payments and principal changes.
Investors holding USD-denominated bonds in emerging markets may gain or lose value depending on the USD exchange rate relative to their home currency.
Commodities
Many commodities are globally traded, so trade rate fluctuations directly influence pricing. For instance:
Oil and gas prices are denominated in USD globally; any currency depreciation in importing countries increases local costs.
Agricultural products, metals, and rare earth minerals are affected similarly, with global trade dynamics impacting supply and demand.
Derivative Instruments
Derivatives such as futures, options, and swaps on foreign currencies, commodities, and trade-sensitive indices also qualify as trade rate sensitive assets. They are particularly useful for hedging or speculating on trade rate movements. For example:
Currency futures can hedge export revenue against domestic currency appreciation.
Commodity futures allow exporters and importers to manage cost volatility.
Real Assets with Trade Exposure
Some physical assets, like factories, warehouses, or ships, are indirectly trade rate sensitive. For example, a shipping company’s revenue is tied to freight rates, which are influenced by global trade activity and currency movements.
Mechanisms of Sensitivity
Trade rate sensitivity arises from several interconnected mechanisms:
Exchange Rate Fluctuations
Exchange rates are a primary determinant of trade rate sensitivity. Assets that generate foreign revenue or require foreign inputs experience profit volatility when exchange rates shift.
A depreciation of the domestic currency improves export competitiveness, potentially increasing revenue.
Conversely, it raises the cost of imported inputs, affecting margins.
Tariffs and Trade Policies
Changes in trade tariffs, quotas, and regulations can directly impact asset value:
Increased tariffs on imported components may raise production costs for domestic manufacturers.
Export restrictions in foreign markets can limit revenue potential.
Global Economic Cycles
Trade-sensitive assets react to changes in global economic growth, as demand for exports fluctuates with industrial production, consumer spending, and investment cycles.
Commodity Prices
Many trade-sensitive assets, especially in resource-driven economies, are influenced by global commodity prices. For example:
Oil exporters benefit from rising crude prices in USD terms.
Agricultural exporters face revenue shifts based on international demand and currency-adjusted prices.
Interest Rate Differentials
Trade-sensitive assets in foreign currency can be indirectly affected by interest rate differentials. Higher domestic interest rates may strengthen the currency, impacting export competitiveness and asset valuations.
Risk and Volatility
Trade rate sensitive assets carry inherent risks due to their exposure to multiple dynamic factors:
Currency Risk: Volatile exchange rates can significantly alter asset values.
Trade Policy Risk: Sudden policy changes, sanctions, or tariffs can disrupt revenue streams.
Commodity Price Risk: Export-driven commodity firms face fluctuations in global prices.
Liquidity Risk: Assets with concentrated trade exposure may be harder to sell during economic shocks.
Investors must recognize that trade rate sensitivity introduces higher volatility compared to domestic-only assets, making risk management essential.
Investment and Hedging Strategies
Investing in trade rate sensitive assets requires careful assessment of global trade trends, currency movements, and economic indicators. Some practical strategies include:
Diversification
Spread investments across regions, sectors, and asset classes to reduce exposure to a single trade-sensitive factor.
Currency Hedging
Use forward contracts, options, or swaps to mitigate currency risk in foreign revenue or bonds.
Commodity Hedging
Exporters and importers can lock in prices via commodity futures or swaps to reduce volatility from global market fluctuations.
Monitoring Policy Developments
Stay informed on tariffs, trade agreements, and geopolitical developments that may affect asset valuations.
Active Portfolio Management
Adjust allocations dynamically based on macroeconomic indicators, exchange rate forecasts, and trade volume trends.
Examples in Real-World Markets
Apple Inc.: Generates significant revenue from exports; USD appreciation can affect international earnings.
Reliance Industries: Exposed to crude oil prices and global trade flows; currency and commodity risks are significant.
Emerging Market Bonds: Sensitive to USD movements and global interest rate changes, affecting repayment in local currencies.
Shipping Companies (e.g., Maersk): Revenue depends on global trade volumes and freight rates, which fluctuate with global economic conditions.
Conclusion
Trade rate sensitive assets form a crucial component of global financial markets, linking macroeconomic trends, currency movements, and international trade dynamics. These assets—ranging from equities, bonds, commodities, derivatives, to physical trade-linked assets—require careful monitoring due to their susceptibility to exchange rates, trade policies, and global demand cycles. Successful investment and risk management in these assets involve a combination of hedging, diversification, and close attention to macroeconomic and geopolitical indicators. Understanding the mechanisms and strategies related to trade rate sensitivity enables investors and policymakers to navigate volatility, optimize returns, and mitigate potential losses in a highly interconnected global economy.
Triangle
Symmetrical Triangle breakdown 🔎 Overview
The Symmetrical Triangle is a contraction pattern formed when the market prints Lower Highs (LH) and Higher Lows (HL) inside two converging trendlines.
After a strong impulsive bullish move (flagpole), price enters consolidation as volatility shrinks — this creates the triangle.
Momentum shifts only when price breaks out of the structure.
A Symmetrical Triangle is a neutral pattern that can break in either direction, allowing momentum to expand upward or downward once price closes beyond the trendline.
In this chart, price breaks the lower trendline and touching the HL-Swing, confirming a bearish continuation.
⸻⸻⸻⸻⸻⸻⸻⸻⸻⸻⸻⸻⸻⸻⸻
📊 Chart Explanation
1️⃣ Strong Uptrend ( Flagpole )
Price starts with a sharp impulsive rally, forming the base structure before the triangle.
2️⃣ Initial Pullback → First LH + HL
After the rally, price begins contracting, creating alternating Lower Highs (LH) and Higher Lows (HL).
3️⃣ Lower High Swings
Multiple LH points show that buyers are losing strength on every upward attempt.
4️⃣ Higher Low Swings
HL points indicate buyers defending the lower boundary, but with weaker force as the structure tightens.
5️⃣ Converging Trendlines (Triangle Structure)
Upper trendline: Drawn by connecting successive LHs.
Lower trendline: Drawn by connecting successive HLs.
Both lines converge toward the apex, indicating decreasing volatility and market indecision.
6️⃣ Price Consolidation Zone
Inside the highlighted box, candles remain tight and range-bound — a classic compression zone before breakout.
7️⃣ Breakout Confirmation Rule
A valid breakout is confirmed only when a full candle closes beyond the upper or lower trendline and interacts with the nearest LH (for bullish break) or HL (for bearish break).
This shows that the breakout is strong enough to violate the previous swing structure, confirming directional momentum.
A full candle close below the lower trendline confirms bearish continuation.
This signals sellers have regained control and trend continuation is likely.
8️⃣ Bias After Breakdown
Since the prior move was strong bullish but the structure broke downwards, the pattern resolves as a bearish reversal of the short-term structure and continuation of immediate downside momentum.
⸻⸻⸻⸻⸻⸻⸻⸻⸻⸻⸻⸻⸻⸻⸻
🟢 Summary
Symmetrical Triangle is confirmed by alternating LH + HL swings.
Trendlines converge → volatility compression.
A confirmed breakdown close below the lower trendline = bearish continuation signal.
Price structure and swings are correctly identified as per textbook pattern rules
⸻⸻⸻⸻⸻⸻⸻⸻⸻⸻⸻⸻⸻⸻⸻
⚠️ Disclaimer
📘 For educational purposes only.
🙅 Not SEBI registered.
❌ Not a buy/sell recommendation.
🧠 Purely a learning resource.
📊 Not Financial Advice.

Bharat Dynamics Ltd – Symmetrical Triangle Breakout on Watch (D)Bharat Dynamics is currently trading near a key breakout point of a symmetrical triangle pattern on the daily chart. After a prolonged downtrend, the stock has entered a consolidation phase, forming higher lows and compressing price action — a setup that often leads to a strong directional move.
Bharat Dynamics Q2 Results
✅ Net Profit: ₹216 Cr vs ₹123 Cr (YoY) — 🔼 up 75.5%
✅ Revenue: ₹1,147 Cr vs ₹545 Cr (YoY) — 🚀 strong growth
✅ EBITDA: ₹188 Cr vs ₹98.8 Cr (YoY) — 🔼 up 89.4%
✅ EBITDA Margin: 16.4% vs 18.1% (YoY) — 🔽 slight dip
The price has reclaimed the ₹1,500–₹1,530 zone, and a sustained close above ₹1,550 could confirm a breakout, opening the path for a quick momentum rally toward ₹1,650 and beyond.
🎯 Key Levels:
CMP: ₹1,525.70 (−0.95%)
Breakout Zone: ₹1,550 – ₹1,560
Target 1: ₹1,650 – ₹1,670
Target 2: ₹1,710 – ₹1,740
Resistance: ₹1,950 – ₹2,000
Stop-Loss: ₹1,470 (on daily close basis)
📊 Technical View:
Symmetrical triangle pattern forming after a prolonged correction.
Price compression with reduced volume indicates breakout buildup.
Breakout confirmation expected above ₹1,560 with increasing volume.
If sustained, the move could extend toward the higher resistance zone around ₹1,950+.
🧠 View:
Bharat Dynamics is at a decisive point — a breakout above ₹1,550–₹1,560 with volume can mark the start of a short-term uptrend. Keep an eye on price action near this level for confirmation.

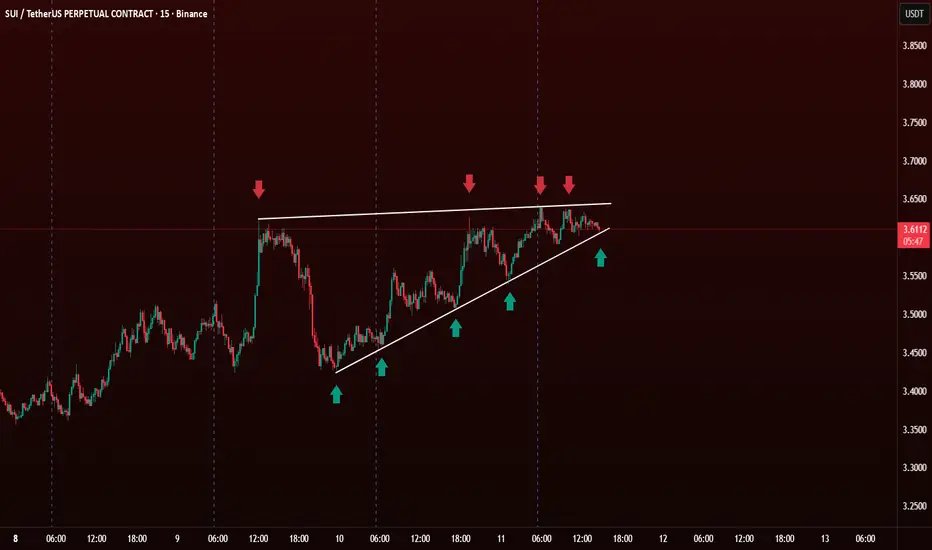
Ascending Triangle Pattern in Technical Analysis The Ascending Triangle is a bullish continuation pattern. It forms when the price creates higher lows (🔼) while facing consistent resistance at the same horizontal level (🔴).
🧐 How to Identify It
Flat Resistance Line 🔴
Price hits the same level multiple times and gets rejected.
This creates a horizontal line on top.
Rising Support Trendline 🔼
Each dip forms a higher low, indicating buying pressure.
Connect the swing lows with a rising trendline 📈.
📊 How to Trade It
Entry : Breakout Entry: Enter when price breaks and closes above the resistance line with high volume 💥.Conservative traders wait for a retest of the breakout zone (resistance becomes support).
Target : Measure the height of the triangle and project it upward from the breakout point.
Example: If triangle height = $0.30, add $0.30 above breakout.
Stop Loss : Below the last higher low 🔽 Or slightly below the triangle support trendline 📉
BINANCE:SUIUSDT.P
The Ascending Triangle Pattern: A Bullish Continuation GuideHello Traders!
In today's post, we’ll explore the Ascending Triangle Pattern , one of the most reliable bullish continuation patterns that traders look for during uptrends . It’s an important tool for identifying potential breakout points in trending markets. If you want to learn how to trade these breakouts effectively, mastering the Ascending Triangle is essential.
Chart Pattern: The Ascending Triangle is a strong bullish continuation pattern. In the case of ASIAN PAINTS LTD , we see the price action forming a flat resistance at the top and a rising upward sloping support at the bottom, indicating that the bulls are gradually taking control of the stock.
Key Points to Note:
The stock is respecting the flat resistance , which has been tested multiple times (marked by the red circles).
The upward sloping support is strengthening with each new low, showing growing buying pressure.
The price has recently broken out above the resistance , confirming the breakout pattern.
Trading Strategy:
Entry Point : Once the price breaks the resistance level, consider entering at 1,172.45 .
Stop Loss : Set your stop loss just below the upward sloping support at 1,151.25 to manage risk.
Profit Target : The ideal target after the breakout is approximately 1,261.65 , which is calculated by measuring the height of the triangle and projecting it upward from the breakout point.
Real-World Application:
This is a bullish setup , and traders should keep an eye on volume confirmation post-breakout. A breakout with increased volume would make the setup even stronger. A price move towards the target of 1,261.65 would indicate a successful breakout trade.
Risk Management:
Ensure that you follow your stop loss at 1,151.25 to avoid unnecessary losses in case the breakout fails.
Position size properly to align with your risk tolerance and the potential reward.
What This Means for Traders:
Bullish Setup : The ascending triangle signals that the bulls have control, and we expect the stock to continue higher.
Watch for confirmation of the breakout and enter with confidence, but always be prepared with your stop loss.
Conclusion:
This ascending triangle is a classic pattern, and it offers a great opportunity for long traders . Keep an eye on the breakout, manage your risk, and this trade could potentially yield solid returns.

Unlocking Breakouts with the Symmetrical Triangle PatternUnderstanding the Symmetrical Triangle Chart Pattern
Hello Traders!
Today, we’ll discuss one of the most powerful chart patterns used to predict breakout opportunities — the Symmetrical Triangle . This pattern is a sign of market consolidation, where price is moving within a narrowing range, and a breakout is expected once the price escapes from this converging trend.
The Symmetrical Triangle consists of two trendlines:
Ascending Trendline : Connecting the rising lows.
Descending Trendline : Connecting the falling highs.
Key Characteristics of the Symmetrical Triangle Pattern:
Consolidation Period : The price moves between the two trendlines, showing decreasing volatility.
Breakout : Once the price breaks above the upper trendline (ascending trendline) or below the lower trendline (descending trendline), it signals a strong trend continuation or reversal.
Volume Analysis : Volume usually decreases during the consolidation phase, followed by a surge in volume during the breakout, confirming the direction.
How to Trade the Symmetrical Triangle?
Entry Point : After the breakout occurs (above the ascending trendline or below the descending trendline), enter the trade in the direction of the breakout.
Stop Loss : Place a stop loss just below the breakout level to protect your position from false breakouts.
Target : The target can be estimated by measuring the height of the triangle from the base and projecting that distance from the breakout point.
Example of Symmetrical Triangle in Action
In the Godfrey Phillips India chart , we can see a Symmetrical Triangle forming between 2021 and 2023. The price broke out of the pattern in late 2022, giving traders a strong upward momentum. Based on the measured move, the target was met after a clear breakout above the ascending trendline , which resulted in a price rise of 42.37%.
Conclusion
The Symmetrical Triangle is a reliable continuation pattern that provides great trading opportunities. Make sure to watch for volume confirmation during the breakout, and always use a stop loss to protect yourself from unexpected reversals.
Happy Trading! 🚀📈

The Symmetrical Triangle: Real Success Rates + Breakout.The Symmetrical Triangle: Real Success Rates + Breakout.
The symmetrical triangle is an important chart pattern in technical analysis, deserving special attention from professional traders.
This formation is characterized by a convergence of prices between two trendlines, one descending and the other ascending, creating a consolidation zone where indecision between buyers and sellers is palpable.
Statistical Analysis
Empirical data reveals that the success rate of the symmetrical triangle for a trend continuation is approximately 54%. This percentage, although higher than 50%, underlines the importance of a cautious approach and rigorous risk management in using this pattern.
Breakout Point
The breakout of the symmetrical triangle usually occurs when the price has traveled approximately 75% of the distance to the apex. This point is crucial for traders, as it often represents the moment when volatility increases and a new trend can be established.
Risks and False Exits
It is essential to note that the symmetrical triangle has a relatively high rate of false exits. Statistics indicate that approximately 13% of cases in a bear market can result in a false exit to the bottom. This phenomenon underlines the need for additional confirmation before entering a position.
Strategy of use
To effectively exploit the symmetrical triangle, professional traders must:
-Identify the formation accurately.
-Wait for the breakout near the point of convergence of the trendlines.
-Confirm the breakout with other technical indicators or an increase in volume.
-Put in place strict risk management to protect against false exits.
In conclusion, the symmetrical triangle, although being a valuable tool in the trader's arsenal, requires a methodical approach and a thorough understanding of its characteristics to be used effectively in a trading strategy.

Actual Success Rates of Ascending and Descending TrianglesActual Success Rates of Ascending and Descending Triangles
Here is an analysis of the actual success rates of ascending and descending triangles in trading, based on the information provided:
Success Rates
Ascending and descending triangles generally have fairly high success rates as continuation patterns:
-The ascending triangle has a success rate of approximately 72.77%.
-The descending triangle has a slightly higher success rate of 72.93%.
These numbers come from a study that tested over 200,000 price patterns over a 10-year period.
Factors Influencing Success
Several factors can influence the success rate of these patterns:
-The trader's ability to execute the strategy correctly
-Market conditions at the time the triangle formed
-Market liquidity
-Overall market sentiment
Important Points to Consider
-Triangles are considered reliable continuation patterns, especially in trending markets.
-The ascending triangle in an uptrend is statistically more reliable than the descending triangle.
-To validate the pattern, the price must touch at least twice each of the upper and lower lines.
-An increase in volume during the breakout is an important confirmation sign.
Strategies to improve the chances of success
-Wait for the triangle to fully form before entering a position1.
-Confirm the breakout with a close above/below the resistance/support level.
-Use additional technical indicators to confirm the signal.
-Pay attention to the volume, which should increase during the breakout.
Conclusion
Although ascending and descending triangles have relatively high success rates, it is important to use them in conjunction with other technical analysis tools and to take into account the overall market context to maximize the chances of success.

Ascending Triangle Pattern breakoutThe stock has recently broken out of an ascending triangle pattern on the weekly chart. The breakout candle, which represents the moment the stock broke out, is a powerful bullish candle, and the breakout was accompanied by substantial trading volume. This indicates a strong upward movement and suggests potential further gains. Traders and investors may find this breakout compelling, especially with the confirmation of a strong bullish candle and good trading volume.
Tutorial :
Certainly! Let's break down the importance of each signal in the context of technical analysis:
1. **Ascending Triangle Pattern Breakout:**
- *Description:* An ascending triangle pattern typically indicates a bullish continuation pattern, where the stock's price makes higher lows and approaches a resistance level.
- *Importance:* The breakout from this pattern suggests a potential acceleration in the uptrend, and it's considered a bullish signal. Traders often look for such patterns to identify potential buying opportunities.
2. **Breakout Candle Strength:**
- *Description:* The strength of the breakout candle refers to the size and decisiveness of the candle that marks the breakout from a pattern.
- *Importance:* A strong bullish breakout candle signifies robust buying momentum, supporting the validity of the breakout. It can instill confidence in traders and investors, indicating a potential shift in market sentiment.
3. **Good Volume During Breakout:**
- *Description:* Trading volume reflects the number of shares traded during a specific period. Good volume during a breakout means a significant number of shares were exchanged.
- *Importance:* High volume during a breakout adds credibility to the move. It suggests increased market participation and conviction, confirming that the breakout is not just a random fluctuation but a well-supported price movement.
4. **Retest of Breakout Levels:**
- *Description:* After a breakout, the stock may retest the levels it broke out from, checking the validity of the breakout.
- *Importance:* A successful retest reinforces the significance of the breakout. It demonstrates that the newfound support or resistance level is holding, providing additional confirmation to traders.
5. **Bounce with Good Volume:**
- *Description:* After retesting breakout levels, a bounce refers to a subsequent upward movement. Good volume during this bounce indicates continued strong market interest.
- *Importance:* A bounce with good volume suggests that market participants are actively buying at these levels, further supporting the bullish sentiment. It strengthens the case for a sustained upward move.
In summary, each signal plays a crucial role in confirming and strengthening the bullish scenario. The ascending triangle pattern breakout sets the stage, the strength of the breakout candle and good volume confirm the validity, and the retest followed by a bounce with good volume reinforces the bullish momentum. Traders often use these signals in combination to make informed decisions and manage risk effectively.

NIFTY DESCENDING triangle formationHere is my overview of descending triangle forming in the price levels.
WHAT IS DESCENDING TRIANGLE??
Formation: A descending triangle pattern begins to take shape after a prolonged downtrend. Traders and analysts notice a series of lower highs forming as the price of an asset consistently makes lower peaks. These lower highs are often seen as a sign of weakening bullish momentum.
Support Level: Simultaneously, a horizontal support level emerges as the price bounces off a particular price point multiple times, creating a horizontal line. This support level represents a significant area of demand, where buyers are willing to step in and prevent the price from falling below that level.
Triangle Shape: The pattern takes the form of a triangle as the descending trendline connecting the lower highs and the horizontal support line intersect. The descending trendline acts as a resistance level that keeps pushing the price down.
Bearish Bias: The descending triangle pattern suggests a strong bearish bias. As the price continues to make lower highs, it indicates that sellers are in control, and buyers are less willing to bid the price up. The horizontal support level becomes increasingly crucial as a decisive point where traders expect the price to either break down or reverse.
Volume Analysis: Volume analysis is essential when considering a descending triangle pattern. Typically, during the formation of this pattern, the trading volume tends to decrease. Lower volume indicates decreased interest in the asset and often precedes a significant price move. Traders often look for an increase in volume when the price breaks below the horizontal support, signaling a stronger confirmation of the bearish trend.
Confirmation and Entry Points: The descending triangle pattern is confirmed when the price breaks below the horizontal support level. This breakdown is a bearish signal, and traders often look for this event to initiate short positions or to exit long positions. Entry points are typically just below the support level, and stop-loss orders are usually set just above the horizontal support or the descending trendline.
Price Target: To estimate the potential price target after a breakdown, measure the height of the triangle from the highest point (the first lower high) to the horizontal support. Then, subtract this measurement from the breakdown point. This gives you an approximate price target for the downward move.

XAUUSD Elliot Wave LabelingLet’s take this labelling as a case study.
The red ABC pattern is a 3-wave pattern. It’s a correction.
Corrections happen in waves 2 and 4.
This entire correction happened in wave 2. After wave 2 comes wave 3. That sharp upward spike on the right is wave 3. Wave 3 will help price to resume its upward trend.
Now, inside that ABC correction is another correction. It’s a 5-wave pattern called a triangle. A triangle is a wave that is always before the last impulse in a given cycle.
In this case it happened as wave B which was before the last impulse (wave C). It can also happen as wave 4 which is before the last impulse called wave 5.

Mastering the Symmetrical Triangle chart patternHello Friends,
Here we had shared Educational purpose post to understand & to master the Symmetrical Triangle chart pattern with real example on chart of the stock MARUTI.
Symmetrical Triangle Chart Pattern
A symmetrical triangle is a common chart pattern used by traders and investors to predict where the price of a stock or asset might go next.
What It Looks Like
Imagine two lines on a chart. One line is sloping up, and the other is sloping down. These lines meet at a point at the top of the chart. It looks like a triangle, where the lines squeeze together.
What It Means
Symmetrical triangles show that traders are unsure about where the price will go. It's like a coiled spring, ready to bounce in one direction.
Why It's Important
When the price breaks out of the triangle, either going up or down, it can be a signal of a big move. If it goes up, it's considered bullish (good for buyers). If it goes down, it's bearish (not so good for buyers).
Trading Tips
Wait for a clear breakout before making a trade. Don't rush.
Watch the volume (how many shares are traded). A big volume increase during the breakout is a good sign.
Be cautious of false breakouts – sometimes the price goes out of the triangle but then comes back in.
If you already own the stock, hold onto it until you see which way the breakout goes.
If you don't own the stock, consider buying after a reliable breakout in the direction of the major trend.
In simple terms, a symmetrical triangle is like a pause in the market where everyone is waiting to see which way it will go next. Traders use it to make decisions about buying or selling stocks or assets.
Setting Stop-Loss and Targets
Stop-Loss
A stop-loss is a predetermined price level at which you decide to sell your position to limit potential losses. When trading a symmetrical triangle pattern:
Place your stop-loss just below the lower trendline if you're buying (bullish breakout).
Place your stop-loss just above the upper trendline if you're selling short (bearish breakout).
The stop-loss helps protect your capital if the breakout goes against your trade.
Price Targets
Price targets help you determine where the price may move after the breakout. You can calculate potential price targets using the triangle's height:
Measure the height of the triangle (the vertical distance from the lowest low to the highest high within the triangle).
After a bullish breakout, add the height to the breakout point for an upside target.
After a bearish breakout, subtract the height from the breakout point for a downside target.
These targets can help you set realistic profit objectives. Keep in mind that they are not guarantees, but rather potential price levels where the asset might move.
Remember that trading involves Risk, and it's important to use risk management tools like stop-loss orders to protect your investments. Additionally, price targets provide guidance but don't guarantee specific outcomes, so it's essential to monitor the market's actual performance after a breakout and adjust your strategy as needed.
I am not sebi registered analyst. My studies are for educational purpose only. Please Consult your financial advisor before trading or investing. I am not responsible for any kinds of your profits and your losses.
Most investors treat trading as a hobby because they have a full-time job doing something else.
However, If you treat trading like a business, it will pay you like a business.
If you treat like a hobby, hobbies don't pay, they cost you...!
Hope this post is helpful to community
Thanks
RK💕
Disclaimer and Risk Warning.
The analysis and discussion provided on in.tradingview.com is intended for educational purposes only and should not be relied upon for trading decisions. RK_Charts is not an investment adviser and the information provided here should not be taken as professional investment advice. Before buying or selling any investments, securities, or precious metals, it is recommended that you conduct your own due diligence. RK_Charts does not share in your profits and will not take responsibility for any losses you may incur. So Please Consult your financial advisor before trading or investing.

Ascending Triangle and it's meaning - understand using HALHow to identify an Ascending Triangle on chart and what does it mean?
Let’s understand this with current chart of NSE:HAL (dated 21-Aug-2023).
• Ascending Triangle is a bullish formation that generally gets formed during the uptrend and confirms the continuation of uptrend.
• Ascending Triangle pattern indicates the accumulation and gives bullish buy indication before breakout.
• NSE:HAL during its uptrend journey created break out from its uptrend channel on 7-Jun-2023.
• However, post that it has gone sideways and started forming an Ascending Triangle.
• Ascending triangle is created when price consolidates in the uptrend direction for some time by facing resistance at same level on the upper side of the triangle. Whereas the bottoms keep increasing.
• Volume starts getting decreasing from the starting point of the triangle.
• At one point, we will get Break Out from triangle with huge volume and uptrend will continue.

Symmetrical Triangle Example using Adani EnterpriseNSE:ADANIENT has created a symmetrical triangle on the chart. Most of the time symmetrical triangle is created when stock is moving side ways (neither moving in up trend nor in down trend). Stock can move to any direction once it comes out of triangle hence it requires caution before placing trade. If stock breaks out (on upper side) than we may see up trend from that point. If stock breaks down (on lower side) than we may see down trend from that point.

Classic breakout failure of triangle patternBank nifty hourly time frame.
A good triangle pattern formed but broke down like brittle glass just after giving an hourly close above the breakout level. This is a classic study opportunity to understand how breakouts fail. Even a positive close doesn't mean anything unless price action supports it.
PS: One can always go short from the low of hourly candle with a very tight SL as major trend is up.

A Comprehensive Guide to Descending Triangle.NSE:AMBUJACEM
A reliable bearish trend continuation pattern is known as Descending Triangle.
This post will cover these questions:
1. What is Descending pattern?
2. How to identify Descending Triangle?
3. Pre-requisite of pattern formation.
4. Trading Tactics.
1.What is Descending pattern?
#The descending triangle is a bearish formation that usually forms a continuation pattern during a downtrend.
#Descending triangles also sometimes function as reversal patterns at the end of an up trend, but typically they
are continuation patterns.
#Descending triangles are bearish in nature.
The descending triangle pattern here indicates that the buyers are not as aggressive as the sellers, so the price continues to generate lower highs. This shows that the demand for related security is falling.
2. How to identify Descending Triangle?
(a.) Drawing trendlines.
The bottom horizontal line (support line) is formed by two or more almost equal price lows, while the descending
trend line (resistance line) is formed by two or more declining highs.
(b.) what are Base and apex?
-The base is the vertical line drawn from the flat support trendline to the starting point (Resistance line) of the descending trend.
-The point at which both converging lines meet is called the apex point.
-The breakout should happen around 2/3 size of the whole pattern.
3. Pre-requisite of pattern formation.
(a.) Existence of prior trend.
It is very important to identify the previous trend, an established prior trend should
exist cause it's a continuation pattern. look for the pattern in a downtrend with a forecast of breakdown
from the horizontal line.
(b.)Volume pattern
While the pattern is forming the volume diminishes.
volume declines as the pattern develop and the price swings back and forth between an increasingly narrow range of
lower highs and similar lows.
However, there is a noticeable expansion in volume when the downside break occurs.
(c.) Retracement Moves.
The chances of a retracement move are very less in this pattern.
After the breakout the price can move again towards the breakdown zone to test the validity of the breakout,
on breakout the support is broken and when the price retraces the support becomes resistance and the price start moving
in the breakout direction.
4. Trading Tactics.
The entry will be below the support level and use protective stop loss above important resistance level,
or it can be above 50% of pattern range.
Minimum Take profit is the projected Base Line.
Use position sizing according to your stoploss level.
Like this idea if you find it useful and please share with your friends.
Keep learning,
Happy trading.
Thankyou.

Symmetrical TriangleA symmetrical triangle is a chart pattern characterized by two converging trend lines connecting a series of sequential peaks and troughs. These trend lines should be converging at a roughly equal slope.
How to identify a Symmetrical Triangle correctly
1.The sides of the triangle slope equally (that's why it's symmetrical)
2.The triangle has lower highs AND higher lows – at least two of each.
3.It looks like a funnel, with the price “squeezing” from the left towards the right.

Three Genuine Triangle EntriesTriangles are very common and promising patterns. Normally they are considered as continuation patterns in the direction of prevailing trend. I am presenting here three useful entry techniques. None is better than the other and each one has its own strengths and weaknesses.
ANTICIPATION SETUP
As the name suggests, the trade is taken before the triangle breakout. It is in anticipation of a continuation breakout. Entry is taken at the third touch of the uptrendline.
Stoploss is fairly smaller, below previous swing low A, compared to other setups. Stop can be brought up to breakeven as soon as breakout happens.
As entry is taken before breakout, the chances of hitting the smaller stop are fairly high.
BREAKOUT SETUP
Entry is taken above the prior swing high B with stop below the recent swing low C as shown in the chart. The stoploss is relatively large but chances of hitting the stop is also relatively less.
CONFIRMATION SETUP
Many a times, after the breakout, price pulls back to the triangle for a retest. The entry is taken above the swing high E formed after the breakout as shown in the chart. Stop is kept below the recent retest swing low F or the last swing low D inside the triangle.
Stop may be large in this case but it comes with higher chances of a successful trade.
TARGETS
Target in all the three cases should be the height of the triangle, shown in the chart, as measured from the breakout point of the triangle.
PRO TIP
♦ The triangle breakout should occur within 1/3rd to 3/4th the length of the triangle (see chart). The late breakouts are not considered as valid continuations and may end up as a trading range.
♦ Ideally volume dries up as the price consolidates in a triangle. Volume starts picking up as the breakout occurs which is a good sign.
♦ Triangles setups are valid in both uptrend and downtrend.
I hope the above information would be helpful.
Thanks for reading 😉

Ascending Channel Pattern 1. What is the Ascending channel pattern?
- Price trade within the range in an up trend, it forms a higher high and higher
low.
- The channel provides support and resistance
- Until prices continue to advance trade within the channel
- Volume Activity turns stagnant
2. How to trade it?
- If it breaks above the resistance line, extrapolate the channel range from point of the breakout point.
- If it breaks down the support line, extrapolate the channel range from point of breakdown point.

Running triangle Leading and Ending Diagonals
Comparison between Running triangle-Leading and Ending Diagonals
Chart 1 depicts a theoretical structure of Running triangle and an ending diagonal in a down trend.
As mentioned the comparison is in a downtrend. Accordingly downward move is termed as directional move and move to the upside is termed as non-directional.
A running triangle has non-directional momentum ie faster moves to the upside (wave A, C and E) than the downward moves (Waves B and D). These non-directional moves donot retrace the previous move completely.
On the contrary, Ending diagonal has directional momentum ie faster moves to the downside (waves 1, 3 and 5) in the direction of trend and these downward moves completely retrace the previous non-directional corrective moves (wave 2 and 4).
Chart 2 depicts a theoretical structure of Running triangle and an ending diagonal in an uptrend.
Differences in a running triangle and leading diagonal is opposite to that mentioned for downtrend.
As mentioned the comparison is in an uptrend. Accordingly upward move is termed as directional move and move to the downside is termed as non-directional.
A running triangle has non-directional momentum ie faster moves to the downside (wave A, C and E) than the upward moves (Waves B and D). These non-directional moves donot retrace the previous move completely.
On the contrary, Ending diagonal has directional momentum ie faster moves to the upside (waves 1, 3 and 5) in the direction of trend and these upward moves completely retrace the previous non-directional corrective moves (wave 2 and 4).

How to Trade an ASCENDING TRIANGLE BREAKOUTSTRUCTURE
--> ASCENDING TRIANGLE is a type of consolidation pattern formed after an Uptrend ( Markup Phase).
--> ASCENDING TRIANGLE is a triangular pattern with a flat horizontal Resistance on the top and a Trendline that connects atleast two Higher Low swings from the bottom to the top of the Triangle.
--> ASCENDING TRIANGLE is considered to be a Bullish Pattern because the Swing Lows are getting shifted Higher signifiying the Sellers loosing the strength .
LOGICAL REASON BEHIND THE PATTERN
--> As the ASCENDING TRIANGLE is having the flat horizontal Resistance on the top , There are stack of STOP-LOSS-ORDERS just above the horizontal Resistance. When some Strong Buyer punches a heavy buying order, The order Triggers all the STOP-LOSS-ORDERS which were placed above the horizontal Resistance turning the sellers as buyers.
--> Seeing the Breakout various New Traders and Algo's place more buying orders and the price tend to move higher.
Example
--> Take the example of the crypto GMTUSDT .
--> Initially the crypto was in the Mark-Up phase.
--> Later this crypto entered into the Consolidation phase by making ASCENDING TRIANGLE as the consolidation pattern.
--> $0.82 was the horizontal resistance established by this stock.
--> The Lows started shifting up from $0.5 to $0.7 to $0.75 showing loss in seller strength .
--> The Price started sustaining above the POC (Point of Control) showing buyers strength.
--> When Price Breached $0.82 all SL orders were Trigerred and the crypto gave the breakout with volume .
--> The price moved higher as new Traders and Algo's placed more buying orders .
Target and Stoploss
--> Target would be the Depth of the Ascending Triangle, Projected above the Resistance Breakout as mentioned in the Example Screenshot.
--> Stoploss would be placed below the Breakout Candle LOW .

Symmetrical Triangle - Full ExplanationA Symmetrical Triangle is considered a bullish signal, indicating that the current uptrend may continue. It is a bullish continuation pattern. It is a volatility contraction pattern. This means volatility in the market is shrinking and a sign the market is likely to breakout, soon. A Symmetrical Triangle shows two converging trendlines, the lower one is ascending, the upper one is descending. The formation occurs because prices are reaching both lower highs and higher lows. The pattern will display minimum two highs touching the upper (descending) trendline and minimum two lows touching the lower (ascending) trendline. This pattern indicates a phase of consolidation before the prices breakout.
The symmetrical triangle pattern is different from a descending or ascending triangle pattern as both triangles’ lower and upper trend lines slope towards the center point.
A horizontal upper trendline is formed in ascending triangles that predict a higher breakout. With a descending triangle, a horizontal lower trendline is formed that predicts a lower breakout.
Formation Of Symmetrical Triangle
Below is the formation of symmetrical triangle
Identification a Symmetrical Triangle
i) The sides of the triangle slope equally (that’s why it’s symmetrical)
ii) The triangle has lower highs and higher lows – at least two of each
iii) It looks like a funnel, with the price “squeezing” from the left towards the right
iv)The bullish symmetrical triangle should be formed in an ongoing uptrend and the prices should breakout from the upper trend line.
Below is the example of the bullish symmetrical triangle formed on the 15 Min chart of NIFTY.
We can see how it is formed in an ongoing uptrend and prices breakout from the upper trend line in the direction of the prior trend.
Entry
Entry can be done after the breakout.
Sometime, when the price breaks out of the Symmetrical Triangle, it might re-test the previous market structure. So, traders can enter on the pullback also. You should also look for any reversal candlestick pattern like Hammer , Bullish Engulfing in the pullback.
pullback here is very small as it is in a small Time Frame (15 Min)
Stop Loss :-
The stop loss is placed right before the breakout point in a symmetrical triangle chart pattern. Previous low before the breakout is the stop loss.
Trailing Stop Loss :-
No one knows how high or low the market can go. And by trailing your stop loss, you allow the market to reward you as it moves in your favor. You can use the Exponential Moving Average (EMA) or Moving Average (MA) to trail your stop loss. You can use the 50 EMA to trail your stop loss. If the price closes below it, then you’ll exit the trade.
Target :-
The price target is equal to the distance from the high and low of the earliest part of the pattern applied to the breakout price point.
i)Take the distance between the high and the low of the Symmetrical Triangle — the widest point of the pattern.
ii)“Copy and paste it” at the breakout point
iii)Exit your trade at the price projection level
There is also a bearish symmetrical triangle which is a bearish trend continuation chart pattern. The bearish symmetrical triangle should be formed in an ongoing downtrend and the prices should breakout from the lower trend line.
Hope you all learnt from this post. Share with the community if you liked it.
Regards
Omahto

Descending Triangle - Full ExpanationWhat is descending triangle ??
The descending triangle is one of the top continuation patterns that appears mid-trend. Traders anticipate the market to continue in the direction of the larger trend and develop trading setups accordingly.
The descending triangle is a bearish pattern that is characterized by a descending upper trendline and a flat lower trendline that acts as support. This pattern indicates that sellers are more aggressive than buyers as price continues to make lower highs. The pattern completes itself when price breaks out of the triangle in the direction of the overall trend.
Element Of Descending Triangle
The descending triangle is fairly easy to spot once traders know what to look for. The below method can be applied to all financial markets.
1.)Downtrend: The market must be in a downtrend before the descending triangle pattern appears. This is important and emphasises that traders should not simply trade the pattern whenever the descending triangle appears.
2.)Consolidation: The descending triangle then appears while the market enters the consolidation phase.
3.Flat Lows Or Flat Line Lower trendline: The lower trendline acts as support. Price often approaches this level and bounces off until the breakout eventually occurs.
4.)Decsending or Lower Highs: While the market is consolidating, a downward sloping trendline can be drawn by connecting the highs. This downward sloping trendline shows that sellers are slowly pulling the price down – which provides further support for a bearish trading bias.
5.)Breakdown & Trend Continuation: After price posts a strong break below the lower trendline, traders will look for confirmation of the pattern via continued downward momentum.
Calculating Target
The descending triangle, often referred to as the ‘falling triangle’, has an inherent measuring technique that can be applied to the pattern to gauge likely take profit targets.
For the descending triangle, traders can measure the distance from the start of the pattern, at the highest point of the descending triangle to the flat support line. That same distance can be transposed later on, starting from the breakout point and ending at the potential take profit level.
The illustration below shows the distance from A to B can be transferred lower down, from C to D, in order to project a possible take profit level.
How to trade Descending triangle
When trading the descending triangle, traders need to identify the downtrend and this can be seen in the BANKNIFTY 15 Min chart below. Thereafter, the descending triangle appears as the candlesticks start to consolidate. The measuring technique can be applied once the triangle forms, as traders anticipate the breakout.
After viewing a strong break below support, traders can enter a short position, setting a stop at the recent swing high and take profit target in line with the measuring technique.
