MATIC Network Continues Strong | Challenges EMA100 Next!MATIC Network (MATICBTC) continues strong after our analysis shared on the 7-August. The low has been maintained, we are seeing slow and steady growth.
Previous analysis:
Now, we are getting signals that MATICBTC can move higher, let's take a look at those:
We are seeing a bounce after a potential higher low.
MATICBTC moved above EMA5 and EMA10, the daily candle is still active and needs to close for this signal to be confirmed.
Challenging EMA50 (0.00000139).
Volume starting to increase.
RSI strong and bullish above 50.
Next target is EMA100 (0.00000158) if EMA50 can be broken.
The chart is bullish and bullish potential is dominant with MATICBTC trading above EMA10 (0.00000133).
Conditions for change: If MATIC's price moves lower and closes below 0.00000120, the above signals are invalidated and we are very likely to test the next support. A new analysis is needed.
Any questions?
Use the comments section below.
Namaste.
Alanmasters

Bitcoin Still Aiming At $7,700 | Hit Or Bounce To $9.2K?Bitcoin (BTCUSD) is still aiming lower. We have a short since $8200 and we think our remaining two targets will hit...
Bitcoin is trading below EMA300 on the daily time frame, so another leg down might happen before testing resistance back up... Here is the chart:
Below you can find the full details of our trade, remember that this is HIGH-RISK and not financial advice .
Leveraged trades are intended for advanced/experienced traders only. If you are a beginner, stick to the altcoins on Binance, Bittrex, Huobi, Poloniex, HitBTC, etc.
Thanks a lot for your support.
______________
Trade: SHORT XBTUSD (Bitcoin)
Leverage: 6X
Buy-in: $8,050 - $8,150
Targets:
(1) $7,900 |Hit (+14.58%)
(2) $7,800
(3) $7,700
Stop-loss: Close 4h candle above $8,195.
Liq. price: $9,652
(Buy-in calculated at $8,092)
Potential profits: 30.5%
Capital allocation: 6%.
______________
Make sure to hit like for more and to show your support.
Use the comments section below for questions and to share your charts.
Namaste.
_____________
Previous analysis | Bitcoin's Next Move Short-Term ($7,700 or $9,200?)

Bitcoin Bullish vs Bearish Long-Term | $5,065 - $5,400 BottomBitcoin (BTCUSD) remains bullish on the monthly timeframe.
We are not used to seeing a "long-term" bearish Bitcoin.
We are not used to seeing Bitcoin consolidate/go lower for months.
There was only one occasion where Bitcoin went negative for six months straight. That was between August 2018 and January 2019... What followed was the BTC 2019 bull-run which produced over 340% in growth.
Right now we see Bitcoin consolidating. 3 Bearish/red consecutive monthly candlestick closed, yet Bitcoin remains trading above EMA10.
Above EMA10 = Bullish
Below EMA10 = Bearish
So Bitcoin can easily move higher long-term if it can remain above this level.
If EMA10 breaks with good strength and volume, now sitting at $7843. We can expect Bitcoin to test the $5065 level or EMA50.
I am looking at two scenarios mainly and they go as follow:
1) Bitcoin remains above EMA10. Here we follow the green arrow. In this scenario, EMA10 holds as support and Bitcoin does a slow and steady long-term climb towards new All-Time High.
2) Bitcoin breaks below EMA10. Here we follow the red arrow if support is broken. If Bitcoin (BTCUSD) breaks and closes below EMA10, it is very likely to test EMA50 at $5065-$5400. If this scenario becomes true this is the lowest we believe Bitcoin can go. In this case, we follow the red+purple arrows.
FEELING THE MARKET
We believe that EMA50 ($5000 - $5400) will be tested before a new all-time high is produced.
Share your thoughts in the comments section below.
Thanks a lot for reading.
Namaste.

Bitcoin Short-Term (1h) Drop | $8,000 or $8,122?Bitcoin (BTCUSD) is trading below EMA10 and gaining momentum on the 1h timeframe.
EMA50 is also being broken now and we marked the next target.
Support is found next at $8218, which is the 0.382 Fib. retracement level from the last bullish wave.
The next support that follows if the above breaks are $8122 and finally $8027.
On the way up, Bitcoin needs to break $8293 in order to be able to move higher.
Right now it is moving lower... Hit LIKE if you like the short-term analysis.
Namaste.

Bitcoin 9K Not Yet Confirmed? From Bullish To NeutralBitcoin (BTCUSD) isn't out of the bear hands yet short-term, the move to $9000-$9200 isn't confirmed, but why?
As you can see in the chart above, Bitcoin is still trading below EMA10, which is now sitting at $8547.
For Bitcoin (BTCUSD) to signal bullish potential short-term, we need a close above this level. Since Bitcoin is trading below it, it has the potential to continue dropping or consolidate some more before its next move.
$7,700 Is now the main support that needs to hold short-term for Bitcoin to bounce on a drop.
If Bitcoin starts to move down, this is the level to watch...
If this level holds on a drop, you can expect a quick bounce and move up.
If Bitcoin drops and $7,700 breaks, we can expect it to move lower.
The RSI hit its lowest since November 2018 and is hovering near the weak/oversold range.
Volume is weak and favoring the bears.
Bitcoin is now consolidating its last drop... And what happens while Bitcoin consolidates?
...The altcoins continue to grow...
Conclusion
We are now neutral on Bitcoin short-term with sideways-bearish tendencies. After EMA10 has been conquered, we look at Bitcoin from a bullish perspective on this timeframe.
Where do you think Bitcoin will go?
Visit my profile for many, many, many more trade ideas for you to enjoy...
Thanks a lot for reading.
Namaste.

Bitcoin Bounces To $9k, Likely Go Mid $6k Next Month + AltcoinsBitcoin (BTCUSD) is now moving within a descending channel, going lower.
Now I am seeing a potential bounce in place or further drop.
Bitcoin can easily move lower, according to the chart above, but a bounce is also very likely.
As for the mid $6,500 price (I am looking at the $6200 - $6500 range), I am looking at this level for Bitcoin (BTCUSD) to fully complete this retrace... Depending on how this level is handled, we can think about Bitcoins next move.
Here is what I see:
1) If Bitcoin can bounce at current levels with good strength and volume, it can resume its recent uptrend... But this is very unlikely as the chart is right now but there are always unexpected events that can happen... So just as we can see strong drops come out of nowhere, in the same way, "magical" reversals in price can happen... But we focus on the chart...
2) Bounce and then moves lower. Bitcoin (BTCUSD) can easily bounce at current levels... Why? The RSI is at its lowest it has been since November 2018... This where the RSI hit bottom for BTCUSD at that time and what followed was a long-term sustained growth period.
3) More drop can also follow, right away with no bounce... Such a drop would quickly be bought up leaving a long-wick. Less probable but completely possible right now.
Share your own perspective or view in the comments section...
Keep reading below!
Feeling the market
One more drop, bounce or drop, and then we are very likely to see this retrace over but, we remain open to see how the last drop will be handled by the market and update our view once this happens.
Bitcoin isn't likely to hurry... Whatever will happen next, it is very likely to be drawn out process, just like it took a while to break the descending triangle created when the last peak was hit back in June. So everything can take a while... While the altcoins grow...
Altcoins profits
Continue buying, collecting and accumulating altcoins.
Be smart, be patient, be active...
Know the risks involved, do your own research and take it!
Buy-in, learn, trade, read, study...
Hit like to show your support.
Give yourself some time... Patience...
And later come to collect your profits.
This is Alan Masters.
Thanks a lot for reading.
Namaste.

Bitcoin Weekly Important Support Levels | Fib. 0.786 ($5,441)Today's drop makes it clear that Bitcoin (BTCUSD) is going to retrace as we were expecting... But how much lower can it go?
Let's take a look at Fibonacci proportions for answers...
Bitcoin reached a peak in late June completing a move that started back February 2019... As it moved lower, it found at the 0.382 Fib. retracement level from the last bullish wave. Here we saw a bounce and consolidation that lasted for almost three months. With this level (~$9700 on average) holding the price.
This level has been broken and Bitcoin is now moving lower. First stop was 0.5 Fib (~$8,500).
Next is EMA50 or ~$7,900 as mentioned in my previous updated. If this level fails, then the next Fib. support that follows is $7,242, which is the 0.618 Fib. from the last bullish wave.
This move is still developing, but the momentum has now shifted completely towards the bears... We have been warning for weeks...
Feel free to leave a comment if you have anything to share...
Thanks a lot for reading.
Namaste.

Bitcoin Weekly Closes Below EMA10 | Bear Mode Is IN! | $7,929?Bitcoin (BTCUSD) just closed below EMA10 on the weekly timeframe, let's get back to the basics... Back to keeping it simple...
Above EMA10 = Bullish potential
Below EMA10 = Bearish potential
Bitcoin's bearish potential has been activated on this timeframe, if BTCUSD remains below EMA10, it is very likely to move lower and test EMA50, which is now sitting at $7929.
There is strong support at around ~$9,000 which needs to break first before EMA50 can be tested as the next support.
For Bitcoin to reverse, the first barrier to break is a close above EMA10 ($10,070). After this level is broken, we can consider higher targets on a bullish perspective.
Right now we are looking bearish.
Thanks a lot for your time.
Namaste.

Bitcoin In Bearish Mode | Chart Signals | Can Go Lower!In my last update for Bitcoin ( BTCUSD ) I mentioned "bearish tendency", because Bitcoin has been moving lower since it hit a peak on the 26-June, we can easily see lower highs being printed...
But since the 28-July, we are also seeing higher lows. This is all a period of consolidation but Bitcoin can still move lower before moving back up.
Now, the signals...
Bitcoin Bearish Signals
The RSI is clearly trending down.
The MACD had a bearish crossover.
BTCUSD price is trading below EMA10 and EMA50.
Bearish TD Sequential.
This is all pointing to another drop.
The drop can be quick big and recover fast just as it can be short-lived and small...
Whatever happens, we believe that Bitcoin will bounce regardless of how low it goes.
Move your focus to the altcoins and comeback when the Bitcoin consolidation period is done.
Thanks a lot for reading.
Thanks a lot for your continued support.
SUCCESS IS AVAILABLE FOR ALL
Success has nothing to do with luck, with your age, with your finances nor where you are from.
Success is not something that is saved for the few...
Or something that cannot be achieved by most...
Success is available for all of us.
You just need to figure out your true wishes, your true heart desires, your real-life goals...
Just this one simple thing makes success achievable by all.
Enjoy life...
Be smart...
Be happy working as you want...
Because success is already yours!
Namaste.

IN | Altcoins Market Update | Bitcoin Is Solid & StrongBitcoin Is Solid & Strong
Yes! Bitcoin sideways has been activated with a little bearish tendency. Bitcoin has been moving lower while consolidating since it hit a peak on the 26-June... Ufff, time does not fly...
So Bitcoin went from ~$3,200 all the way to ~$13,900 in 6 months...
Since June until today Bitcoin moved from a peak of $13,880 to a strong $10k... 3 months and Bitcoin is only showing a "normal" retrace, about 39%... Which is great compared to 329% growth (from $3,230 to $13,880 on BitStamp).
So we now know for sure that Bitcoin is solid and strong, so it is time for the altcoins run...
Altcoins Market Update
Yikes! The altcoins are already paying and paying big... The reason we go for altcoins vs Bitcoin is because of their size...
Bitcoin is small compared to conventional assets, but if you compare Bitcoin to the cryptocurrency market altcoins, Bitcoin is BIG while the altcoins are SMALL.
If you have a good eye, confidence, and trust, you can find many opportunities looking at the smaller projects that are coming up.
So we focus on the altcoins because they offer higher profits potential and endless opportunities for all of us.
The altcoins market is already producing great results... But we are only getting started... We are still trading near the bottom, for most pairs... We will be enjoying growth/profits for years to come.
Feel free to leave a comment and share your thoughts about Bitcoin, Altcoins and the Next Cryptocurrency Bull Market Run!
Namaste.
Bitcoin Breaks Support, Goes Lower (9.6K or Bounce Next?) | IN Bitcoin (BTCUSD) just broke with a big red candle below support... This is no surprise as we were expecting a drop.
On the chart above you can see the different support levels (blue) and resistance levels (magenta).
This breakdown just started so it needs time to develop...
Here you can see our full trade for this setup, here you can find specific details for your targets | Click on the image below
Thanks for the support.
Namaste.

Bitcoin Moving Lower | 70% ROE on 8X Lev. Full Trade | INIf you followed my recent trade ideas for Bitcoin (BTCUSD), you are aware that we were expecting this drop and went SHORT short-term. Multiple signals were pointing to a drop, namely:
BTC moving below EMA10.
Peak hit on the 6-Sept.
Bearish indicators.
Altcoins market time to move up.
You can see all the details by clicking on the image below:
Now, we are active with a high-leverage trade at 8X that can reach up to 70%+ ROE easily...
Feel free to hit like if you would like to see the full trade details. Will share at 111 likes.
This is for experienced/advanced traders only... This is not financial advice.
________________
Here you can see our recent leveraged trades
Ripple (XRPU19) Can Do 300% ROE on 7X (Bullish Chart Setup)
EOSU19]8X]LONG]314.% ROE] High Risk, High Profits Lev. Trade
Additional charts
Litecoin (BTCUSD)
TOTAL Cryptocurrency Market Capitalization | Keeping It Simple!
Market Cap BTC Dominance Breaks Support (Where To Next?)
Thanks a lot for reading and your continued support.
Namaste.

Bitcoin Can Easily Move Lower or True Bounce In Place? i|AltcoinBitcoin (BTCUSD) can easily move lower... According to the signals coming from the chart above.
My last analysis showed that the signals were weak and that Bitcoin could move down since it was rejected for the fourth time by strong resistance... You can see the full analysis here:
Now, we are going to have a shorter-term look at the chart.
Bitcoin (BTCUSD) on The 4H Time Frame / Scale
First we have what appears to be a bullish engulfing pattern, a strong one, to push BTCUSD back above EMA10. ()
If the red trendline can be conquered, Bitcoin can easily move higher... but if it remains below it, as it is now, we can expect additional retrace.
Trading back down below EMA10 (candle close is needed for confirmation).
Bearish MACD and trending lower.
RSI on the bearish zone and trending down.
Retrace has gone to 0.5 Fib. of the last wave, can easily go lower to 0.618, 0.786 or 1.
The GREEN trendline would support Bitcoins price if it turns upward.
Feeling the market: Bitcoin can easily go lower, that's the feeling right now... The signals are above.
Altcoins
I mentioned the altcoins market in my last update for Bitcoin, which can be seen here , and that the alts would start moving from this point forward... Now...
I am seeing more pairs on Binance producing very strong bullish setups that can produce massive impulse waves...
Just watch... You can check my profile for some of those...
Thanks a lot for the support.
Namaste.

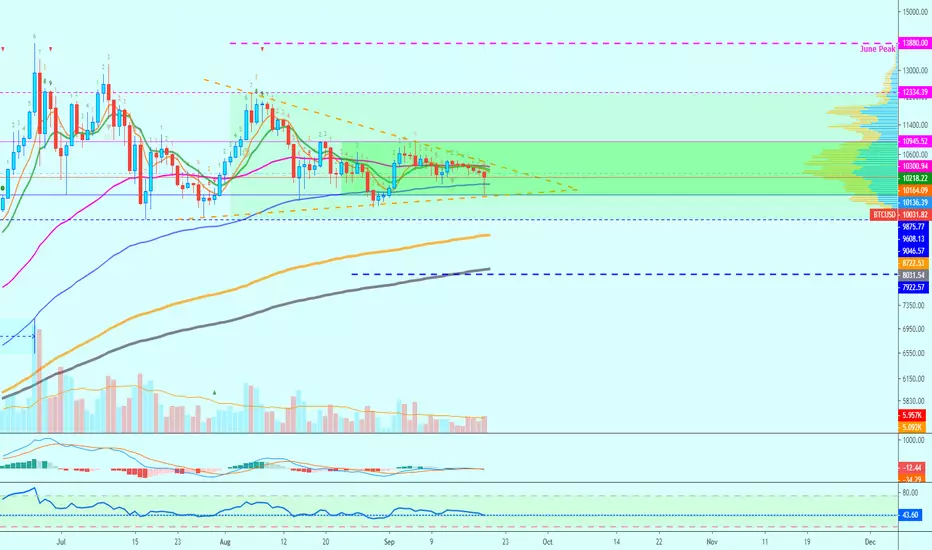
Bitcoin Faces Resistance | $9.6k or $11,3k? | Altcoins Market InBitcoin's rise to the top has been stopped by heavy resistance... Let's take a look at the chart together and see what will happen next and the different potential scenarios... Feel free to hit like to show some support.
Bitcoin Daily (1D) Chart Analysis by Alan Masters
Good Saturday, let's start by calling our attention to the "Purple trendline", notice how it stopped Bitcoin's growth multiple times, 4 total... This is an important resistance level. We can say that if Bitcoin manages to remain above this level, it can easily move higher (green arrows).
The "Brown trendline" at the bottom is working as our main support for the range trading/consolidation phase.
After BTCUSD was rejected for the fourth time from the purple trendline, it is likely to test lower support... But we trade based on candle close and we see Bitcoin staying above EMA10 and EMA50. If these levels hold, namely $10,300 - $10,350, Bitcoin can try and challenge the upside again... But if this level breaks, we are looking at around $9500 - $9650 next.
The RSI remains strong above 50.
Here we have to wait and see how the charts will develop. Our main bullish vs bearish potential indicator is the EMA10 line, so we remain bullish as long as BTCUSD is trading above this level.
On a break below EMA10, we look for support.
Overall, Bitcoin is likely to move lower since it already touched the purple trendline again and was rejected. In order to move any higher, this is the resistance that needs to break FIRST. If it can't be broken, Bitcoin moves lower...
Altcoins Market Update
I've been looking at many ALTSBTC charts and some did massive numbers in the past 2 weeks, numbers we haven't seen in months... But at the same time, many others went lower and hit new lows...
What is going on?
Now we see the strongest altcoins pairs (all top altcoins minus top 10) maintaining their last low and even moving higher. We see Bread (BRDBTC) which made a 100%+ move today...
In conclusion, the altcoins pairs vs Bitcoin will move strong starting now and after the 15-18 September.
We all had plenty of time to accumulate, buy and go long.
We all had plenty of time to see the market red going down more and more.
We only have a few days left and big change will come to us...
So get ready...
Be prepared...
The Altcoins Market will run like never before!
Feel free to share your charts and ask any questions, on the comments section below...
Namaste.

Crypto Total Market Cap Exclude BTC (TOTAL2) | Bulls IN BearsI am looking at TOTAL2, the index for the total cryptocurrency market capitalization excluding Bitcoin ... Calculated by Trading View...
Here we have some signals to look at that can reveal potential scenarios for the future of the altcoins market capitalization... Let's take a look:
First let's notice the "support trendline" which is now in play. If this trendline is broken we can expect TOTAL2 to move lower and test the 0.786 Fib. retracement support level from the last bullish wave. Staying above this trendline can lead to a bounce up and test of EMA10 (79) followed by EMA50 (88).
We also have a falling wedge pattern and a neutral RSI.
Our main scenarios are drawn on the chart.
We believe TOTAL2 will grow in the coming months with potentially only one last strong drop left.
What's your take on where this index is headed?
Share with us in the comments section below.
Namaste.

Bitcoin Strong Bounce, Going Higher? | $11,300INOur next target remains at $11,150 - $11,300 based on my previous analysis, which is playing it nice.
Right now we are seeing a strong bounce for Bitcoin (XBTUSD) after hitting EMA10. We can see good volume and momentum building up.
Above EMA10 we aim for our next target at $11k+. If Bitcoin moves lower, we look again for $10,500 (EMA10), followed by $10,100 - $10,200 as main support.
Feeling the market: Bitcoin can easily move higher.
Namaste.

Bitcoin Bounce INPlay | Can Hit $10,900 But Not There Yet!Bitcoin (BTCUSD) is showing a low volume bounce while trying to break slowly above EMA10.
We are seeing multiple signals that are pointing to move up but multiple resistance levels are to be taken out first.
The blue trendline is the main resistance that needs to be broken for Bitcoin (BTCUSD) to move higher. If this level breaks, we aim at EMA50 ($10278) followed by $10800-$10900.
Bitcoin's price is already moving above EMA10. (Bullish)
Moved below EMA100 (light blue rectangle) only to bounce back up. If Bitcoin can remain above EMA10, it becomes very likely that it moves higher...
Hidden bullish divergence can be spotted on the RSI. (Bullish)
Low volume. (Bearish)
The set up is already in play, the only thing needed now is for the bulls to follow up and we can see Bitcoin grow to $10,250 or higher all the way to $10,900... It all depends on the daily candle close.
Where do you think Bitcoin is headed?
Share with us in the comments section below!
Namaste.

Bitcoin (XBTUSD) Continues Aiming at $11.3k (100%+ ROE |8X | IN)Here is a quick chart for you guys, my beloved readers... I appreciate your support.
We are doing 8X on Bitcoin (XBTUSD) and we are aiming for $11,300 or higher.
Our last trade idea played out and we hit higher than our first target which was sitting at $10,650, Bitcoin went up all the way to $10,800 on BitMEX...
Looking at the action Bitcoin is having now, I believe it can go higher.
All the details are shared on the chart.
If you would like to see the full trade details for our BitMEX trade, make sure to hit like. If we get 222 likes, we will share our buy-in, targets, stop-loss, profits potential, leverage, and capital allocation.
This is not financial advice.
Thanks a lot for reading.
Namaste.
Previous analysis:

TOP 10 Strong Altcoins 4 LongTerm Bullish Potential @alanmastersGood Day & Life!
My fellow cryptocurrency lover, I would like to share a trade idea today with a completely different format, so this is something that is requested from me on a daily basis, so here you have it by popular requests.
Today I will be sharing a list of TOP Altcoins that are STRONG for LONG TERM holding and at the same time have good BULLISH potential.
So the key words here are TOP, STRONG, LONG TERM and BULLISH... This is what we will be looking at from major to minor altcoins.
I am hoping that you enjoy this post... Feel free to hit like if you want to now, to show your continued support.
Before we get started I need your help!
I am going to be writing a series of TOP 10 articles mentioning different categories of altcoins to consider for the top 10 list but we have many, many options, there are thousands of different altcoins... Here is where/how I need your help.
I need you to leave a comment choosing which of the following category you best prefer to read about next, as well as share your own variation for me to consider for the next post:
(1) TOP 10 Altcoins for Short Term Profits
(2) TOP 10 Altcoins with Highest Profits Potential
(3) TOP 10 Altcoins with Best Products
(4) TOP 10 Most Popular Altcoins (your choice)
(5) TOP 10 Altcoins with The Biggest Gains
So pick one, or multiple choices, and add your own to the bottom of the list. You can leave a comment and I will share next the list that gets more requests...
Remember to mention your favorite altcoins or the one you want me to look at in case #4 wins.
Now... Let's get started!
Thanks a lot for the support.
TOP 10 Strong Altcoins for Long Term Bullish Potential
Binance Coin (BNB)
I believe Binance Coin (BNB) to be one of the strongest altcoins which you can buy and hold for long term growth, stability and profits potential.
Binance is the biggest cryptocurrency exchange by volume and lists some of the best altcoins in the market for us to trade.
Binance implemented credit card purchase to buy cryptocurrency and its own altcoin, BNB, can be used to pay trading fees.
Here is the quick conclusion, the more the cryptocurrency space grows the bigger and better that Binance Coin becomes. And since the market is really young, this altcoin has the potential to keep on growing more and more.
Trade ideas:
BNBUSDT
BNBBTC
Ethereum (ETH)
We continue with Ethereum (ETH), which is a " decentralized platform that runs smart contracts: applications that run exactly as programmed without any possibility of downtime, censorship, fraud or third-party interference."
Ethereum is the second biggest cryptocurrency by market capitalization, second only to Bitcoin.
Ethereum has its own "reality" in the crypto space and most exchanges offer trading against ETH.
This is a very strong project with huge long term bullish potential.
When you look at the long term chart, ETHUSD is basically at its bottom:
Let's continue.
Litecoin (LTC)
Litecoin is the first Bitcoin copycat and has established a reputation as being a very stable altcoin project.
Chart:
Even though my charts are showing profits potential compared to all-time highs, altcoins can create new highs just as they can create new lows.
A new all-high can push the price of any altcoin project dozens of times higher than the last high. All that is needed is a bull run.
Cardano (ADA)
Cardano is one of the best and most trusted projects out there and it is already being used in different types of commercial establishments in Asia (Korea).
The last bull run back in late 2017/early 2018 pushed ADABTC to generate over 3,000% profits. With these altcoins projects being the ' companies of the future ', the potential here is hundreds of times of what we are seeing now.
Here is the chart:
Cardano is a great altcoin which is strong and can be held long term.
Siacoin (SC)
Now, we looked at big market cap and famous altcoins, here we will be looking at two smaller but older ones.
Siacoin (SC) is a project that has a real working product and has been around for long. It is said that Satoshi Nakamoto, one of Bitcoin creator, lend his to support to this project.
And old gem, Siacoin is massively stable and has lots of potential for future growth.
This is an altcoin that can grow 5-10X easily within this year, and up to 50X by the next cryptocurrency market bull run... Wait, wait... I know, this is huge, but this is how the amazing/crazy cryptocurrency market works.
DigiByte (DGB)
DigiByte is another old gem and I am sharing it here simply because of its long term potential and stability as an altcoin project.
DGB held its value better than most of the altcoins available throughout the bear market.
Chart:
BitTorrent (BTT)
From old to new, BitTorrent needs no introduction. BitTorrent is a file sharing system that now has its own altcoin which can be used to monetize content and traffic while sharing online.
This project is linked to TRON ( TRX ) and has huge massive growth and long term potential.
Here you can find our BitTorrent trade, this is for the medium term, long term potential is much, much higher:
Basic Attention Token (BAT)
This is a favorite for my friend and developer and for good reason. BAT has its own browser which can be used to monetize traffic on any website... The method of payment? BAT of course.
This project comes from the creators of Mozilla and is a must-have for any cryptocurrency lover.
Ripio Credit Network (RCN)
One simple feature got RCN into this list, which is the Ripio Credit Network New dApp.
Basically, Ripio Credit Network has a dApp now where you can loan them money and they give you a % back in 30 days with Ripio backing all the loans. This gives out a varied return, monthly/yearly, for RCN that you would be holding anyways if you are into crypto. At the same time this feature can promote long term slow steady growth for this altcoin.
This feature is active now and can be found here: rcn.loans
RCN has huge growth potential that can go beyond ATH long term:
Bitcoin (BTC)
Needless to say, BITCOIN IS THE NAME OF THE GAME.
BITCOIN IS THE BEST!
You can always buy and hold Bitcoin long term as this is the best cryptocurrency of all.
Namaste.
Conclusion
Here we have a mixed list of altcoins, I tried to put in new projects, old projects, known projects, not so known, with good profits, etc. Variety, so there is a little bit for each and every one of us.
Which TOP 10 Altcoins you want me to write about next?
Remember to hit like and leave a comment with the altcoins that you believe are best.
This is Alan Masters.
Thanks a lot for reading.
Namaste.

Bitcoin Bearish IN ShortTerm (Aims at $11000 or Lower) +AltcoinsBitcoin (BTCUSD) is showing multiple bearish signals on the 4H time frame.
We are looking at a bearish MACD, line, and signal.
The RSI is also on the bearish side but moving around support.
Before Bitcoin can move any lower, it first needs to break EMA100 ($11077), only if this level can be broken, BTCUSD is to move lower and test the $10,600 - $10,400 range.
We mention this support level in our previous long-term update:
Conditions for change: If Bitcoin (BTCUSD) moves up and closes above EMA10 ($11,405), it increases its bullish potential and chances to move higher, the above bearish signals would become invalid.
Feeling the market: The feeling I am getting from the market and Bitcoin is that it can take a few days before it makes its next move... Some sideways action is possible leaning more towards the bears. We easily see Bitcoin's price moving in the $11,100 to $11,600 range, before breaking any resistance or support level.
We can see it moving up but more consolidation before anything big comes... That's the market feeling at this point.
What about the Altcoins: After all the bleeding for the ALTSBTC pairs, they will start to move again but it will take a few weeks to see them move in full force. The summer, the big hit... it will take people sometime before confidence returns... But at this point, if you are smart, all you are doing is BUYING, REBUYING, MORE BUYING AND RELOAD.
Namaste.

Bitcoin Bounces In, Aims At 10.5k Or 11.3k? (#1 All-Time TOP)Bitcoin (BTCUSD) retraced strong... We caught the last peak, now we are seeing that a new low has been set...
-----
Before we get started we would like to thank all of our readers, supporters, and followers, and Trading View as a company, its staff, and support, for ranking Alan Masters now as the #1 All-Time Top Cryptocurrency trader and analysts... I am deeply honored...
Thanks a lot for continued the support.
-----
Feel free to hit LIKE and let's get started with the chart analysis...
Bitcoin 4H Time Frame
Bitcoin can surely move up from current levels, I've drawn the main scenario I see developing on the chart above.
Let's take a look at why and at some of the main signals below:
Looking at the RSI
We can see a huge decline, I mean massive after the top on the 5th of August, it reached oversold yesterday, massively oversold down to 13.88... Bitcoin tends to bounce when it reaches such levels on the RSI.
The purple arrow marks the hidden bullish divergence. This shows up when the trend is up (Higher lows)) while the indicator is down (Lower lows).
After the dashed red trendline is broken, you can expect the RSI to move higher and higher.
Looking at the Bollinger Bands and Bullish Candlestick
Here we can see that Bitcoin (BTCUSD) touched the outer part of the Bollinger Bands, to quickly bounce. The price always trades within these bands... This is a great indicator.
On the bounce a bullish candlestick formed. You can see it marked on the chart. The large wick at the bottom means the rejection of sellers.
High volume is good, supports the bounce. Also supports the bounce back into the Bollinger Bands as well as the bullish candlestick and break above EMA5.
So unless the bears do a massive push down and break the last low set, Bitcoin is very likely to move higher from here and challenge the next resistance levels.
Feeling the market: As you can see, multiple signals are pointing towards a bounce here but it is very likely we will see some range-trading or sideways action first. This sideways action will allow for the altcoins market to grow (ALTSBTC).
The last low can still be broken to shake out some more weak hands, but we can expect the $9100 support to be a very strong one if this happens.
After some decent consolidation, we can analyze the next move which right now feels up.
Altcoins Market Update: Yesterday's drop was massive for Bitcoin yet we can see that the Binance and Bittrex altcoins, the ones we mainly look at, remain consolidating on support and continue printing bullish charts. All of these will have a massive bullish explosion soon. The market sentiment needs less than 3 weeks right now to fully change.
We will see the altcoins market move from extremely bearish to extremely bullish... It will be a drastic change.
As for us...
Thanks a lot for your continued support.
This is Alan Masters.
Namaste.

Bitcoin Clearly Going For $10,551 If This Criterion Is Met (IN)Bitcoin (BTCUSD) has been aiming lower since reaching a top on the 6th of August. We warned about an imminent retrace and this is now happening... Let's take a look at the chart:
BTCUSD is now trading below EMA10 ($11,300). In my previous article, we mention that any trading above this level is bullish, but below this level, we go bearish. The daily candle is yet to close, but if BTCUSD closes below EMA100, it is very likely to move lower.
Our next target is sitting at EMA50 which is now $10,551. This is the level where Bitcoin will find support next if it closes bearish today.
MACD and RSI are leaning towards the bulls. The RSI is gaining momentum down and signals a strong drop incoming. Here is the chart:
You can see our previous analysis with altcoins market update below... Still valid:
Bitcoin Bearish Short-Term (Aims at $11,000 or Lower) + Altcoins
Bitcoin Looking To Retrace, $10,400 Possible, Full Analysis!
Bitcoin Weekly Update (Bullish vs Bearish Potential)
Feel free to hit like if you want to show us some support.
Thanks a lot for reading.
Namaste.

[XRPU19][LONG][7X][165.13% ROE] Ripple 7X Lev. (165% ROE)Here is our full trade for Ripple (XRPU19) on BitMEX.
We are using 7X (high leverage) for high ROE.
BitMEX (leveraged) trading is for experienced/advanced traders only.
This is not financial advice. We are sharing our views and opinion for learning and entertainment purposes only.
A trade setup can do good just as it can go bad. Some we win others we lose. If you decide to trade, you do so at your own risk.
We recommend trading altcoins pairs for beginners, margin trading should be done only after you have lots of experience and you have patience as well.
Patience is key.
Thanks a lot for your continued support.
Now, let's take a look at the numbers for our Ripple (XRPU19) trade:
_________________
Pair: LONG XRPU19 (Ripple)
Leverage: 7X
Entry: 0.00002550 – 0.00002670
Time frame: 4H
Targets:
(1) 0.00002700
(2) 0.00002820
(3) 0.00002900
(4) 0.00003110
(5) 0.00003300
Stop-loss: Close daily (1D) below 0.00002400.
Liq. price: 0.00002356
(Buy-in calculated at 0.00002670)
Potential profits: 165.13% ROE
Capital allocation: 6%.
_________________
If you have any questions, feel free to use the comments section below.
This is Alan Masters.
Namaste.
