APOLLOHOSP - Range-to-Reversal Attempt from Demand Zone💹 Apollo Hospitals Enterprise Ltd (NSE: APOLLOHOSP)
Sector: Healthcare | CMP: 7348
View: Range-to-Reversal Attempt from Demand Zone | Early Momentum Rebuild
Chart Pattern: Accumulation
Candlestick Pattern: Strong Bullish Marubozu | Bullish Engulfing
Price Action:
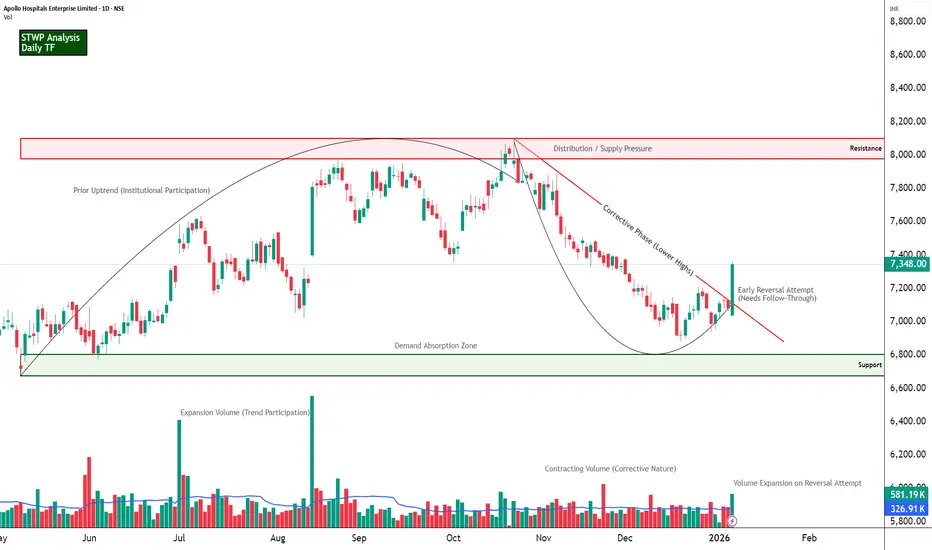
APOLLOHOSP has been in a corrective phase after a prior uptrend, trading within a descending structure marked by a clear trendline connecting lower highs. Price recently reacted strongly from a long-term support zone near the lower boundary of the range, forming a decisive bullish candle that signals demand absorption at lower levels. While the broader structure still carries corrective characteristics, the recent move reflects an early attempt at reversal and mean reversion, with price pushing back toward the mid-range as it approaches the declining supply line and overhead resistance zone.
Technical Analysis (Chart Readings):
The chart reflects a high-confluence bullish technical state where multiple indicators are aligning simultaneously. Price has printed a strong bullish Marubozu / engulfing candle, indicating clear buyer dominance with minimal intraday supply, and this move is accompanied by Bollinger Band expansion following a squeeze, pointing to a volatility release after a consolidation phase. Trend alignment is visible through the upward crossover of EMA 9–20 and price holding above the EMA 200, further supported by bullish SuperTrend and VWAP structure, suggesting acceptance of higher price levels. Momentum indicators reinforce this shift, with RSI at 60.52 signalling a breakout into strength territory, MACD remaining positive with an expanding histogram, ADX near 29.87 reflecting a strengthening trend environment, and ROC at 4.17 percent confirming positive rate-of-change momentum. Volume readings show active participation, with current volumes meaningfully above average, highlighting conviction behind the move rather than a low-liquidity spike. Relative strength versus NIFTY at 4.14 percent indicates short-term outperformance, while the mid-range 52-week positioning suggests the move is occurring within structure rather than at an extreme, together portraying a synchronized alignment of price, trend, momentum, volatility, and volume consistent with a developing directional expansion phase.
Key Levels (Chart Readings):
The chart highlights a well-defined demand–supply structure shaping price behaviour. On the downside, a strong demand zone is visible in the 6900–6800 region, from where price has repeatedly found support, indicating sustained buying interest and accumulation at lower levels. This zone is further reinforced by clearly marked support levels around 7138.67, 6929.33, and 6818.67, establishing a layered support base rather than a single-point level. On the upside, price has previously reacted sharply from the overhead resistance band near the 7800–8000 zone, marked as a possible supply area, suggesting distribution and selling pressure at higher levels. Intermediate resistance levels around 7458.67, 7569.33, and 7778.67 indicate zones where price has struggled to sustain upward momentum in the past. The recent bounce from the demand zone back toward the mid-range reflects a range-to-reversion move within structure, while the overhead resistance is still relatively weak but present, implying that acceptance above these zones would be required for sustained upside. Overall, the chart reads as a market transitioning from demand-led support toward a test of overhead supply, with price currently navigating between clearly defined structural boundaries rather than moving in an uncharted zone.
Demand & Supply Zones (Chart Readings)
The chart outlines a clearly defined demand–supply structure guiding near-term price behaviour. A possible swing demand zone is observed between 7091.50–7072.50, where price has previously attracted sustained buying interest, establishing a structural base within the broader range. Nested within this area, a possible intraday demand zone around 7091.50–7077.50 highlights immediate short-term demand, indicating active participation at these levels. On the upside, possible intraday supply zones are identified near 7282.00–7294.50 and 7321.00–7331.50, where prior price reactions suggest the presence of supply and potential short-term resistance. Collectively, these zones frame the current price environment, with price positioned between nearby demand and overhead supply, making them important reference areas for observing future price reactions.
STWP Trade Analysis:
APOLLOHOSP has triggered a decisive bullish expansion, marked by a wide-range green candle supported by high volume, indicating strong demand emergence after a prolonged corrective phase. From an intraday perspective, the stock holds a bullish bias above the 7360 zone, with the structure allowing for momentum continuation toward 7986.88 and 8404.8, while risk remains defined below 6837.6, making this setup suitable only for traders comfortable with volatility. From a swing (hybrid) standpoint, the same entry zone supports a broader mean-expansion framework over the next few sessions, where sustained participation can open upside potential toward 8927.2 and 10102.6, with structural invalidation placed near 6576.4. The STWP view remains constructively bullish, with the trend aligned upward, RSI at 60.52 reflecting healthy strength without exhaustion, and volume expansion (Vol X 2.01) confirming conviction behind the move. The learning takeaway from this setup is to prioritise structure, controlled risk per trade, and post-trade review over prediction, especially during high-momentum phases.
Final outlook remains positive with strong momentum and an upward trend, while risk is elevated due to volatility, making disciplined execution and risk management critical as long as volume support sustains.
⚠️ STWP Educational & Legal Disclaimer
This content is shared strictly for educational and informational purposes only. All discussions, illustrations, charts, price zones, and options structures are meant to explain market behaviour and do not constitute any buy, sell, or hold recommendation. STWP does not provide investment advice, trading calls, tips, or personalized financial guidance, and is not a SEBI-registered intermediary or research analyst.
The analysis is based on publicly available market data and observed price–derivatives behaviour, which is dynamic in nature and may change without notice. Financial markets involve inherent risk, and derivatives carry elevated risk, including the potential for significant capital loss. Factors such as option premiums, implied volatility, open interest, delta, and other Greeks can shift rapidly and unpredictably.
All trading and investment decisions, including position sizing and risk management, are solely the responsibility of the reader. Always consult a SEBI-registered investment advisor before taking any financial action. STWP, its associates, or affiliates shall not be liable for any direct or indirect loss arising from the use of this material. Past patterns, structures, or historical behaviour must never be treated as guarantees of future outcomes.
Position Status: No active position in this instrument at the time of analysis
Data Source: TradingView & NSE India
💬 Did this add value?
🔼 Boost to support structured learning
✍️ Share your views or questions in the comments
🔁 Forward to traders who value disciplined analysis
👉 Follow for clean, probability-driven STWP insights
🚀 Stay Calm. Stay Clean. Trade With Patience.
Trade Smart | Learn Zones | Be Self-Reliant 📊
Apollohospital
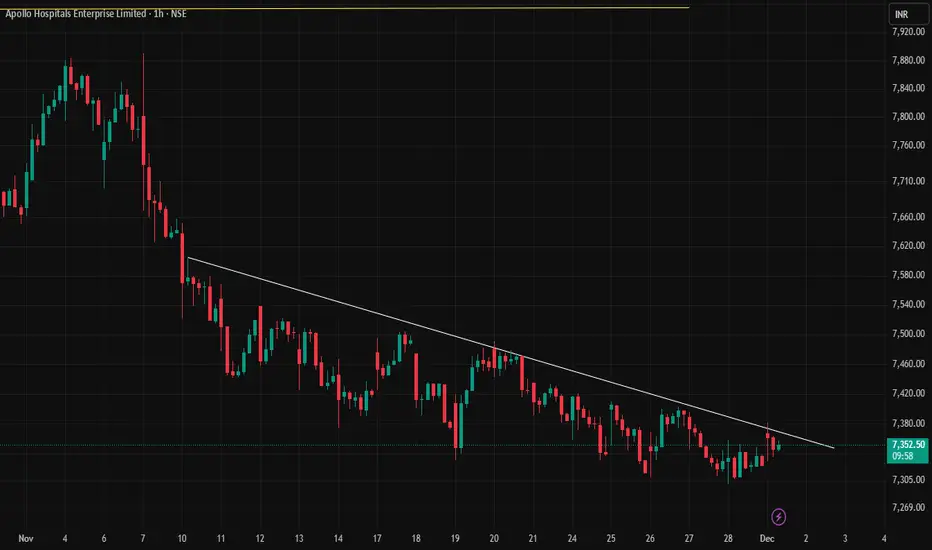
Apollo Hospital Trend Reversal Trading OpportunityApollo Hospital is providing a Trend reversal Trading oppoerunity on Hourly chart. Stock likely to reverse its 6 days down trending move is down trend line and breakout above trendline giving breakouts. Keep watch
Nifty Healthcare: Pressure Building for a Big MoveNSE:NIFTY_HEALTHCARE
Nifty Healthcare – Breakout Watch Near Multi-Year Resistance
Technical Setup
Index retesting the 14,800–15,000 resistance that has capped prices since 2024.
Tight weekly candles show supply absorption.
Higher lows indicate steady accumulation.
A weekly close above 15,000 can open a move toward 15,800–16,200.
Fundamental View
Defensive sector gaining interest in a volatile macro phase.
Earnings improving with better margins and stable domestic demand.
Pharma exports recovering; US generics cycle turning positive.
Sector valuations still reasonable after a long consolidation.
Idea
Bullish above: 15,000 (weekly close).
Targets: 15,800 / 16,200.
Invalidation: Below 14,300.
⚠️ Disclaimer:
This analysis is for educational and informational purposes only.
We are not SEBI-registered analysts or advisors.
This is our personal view based on available data and market trends.
Please consult your SEBI-registered investment advisor before making any investment or trading decisions.
You are solely responsible for any financial decisions you make based on this content.
========================
Trade Secrets By Pratik
========================

RELIANCE 1D Time framePrice Action
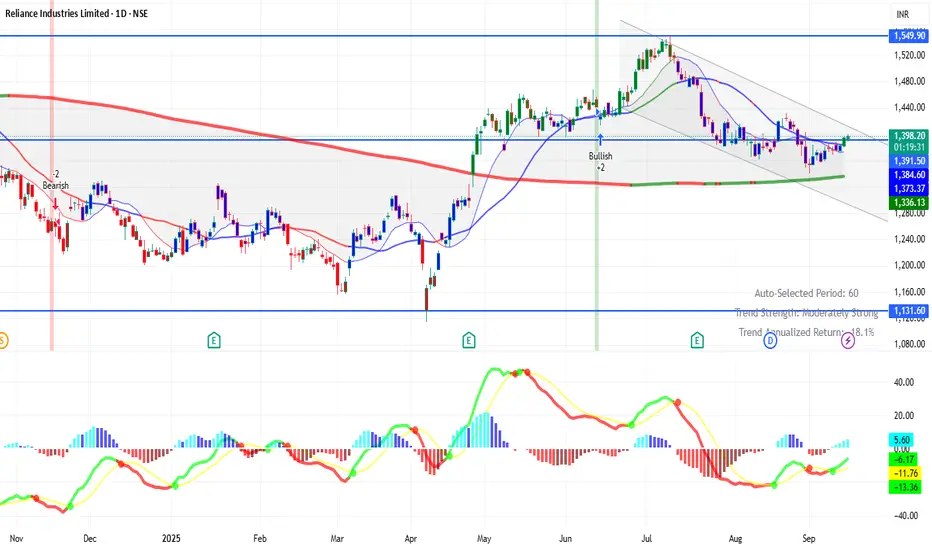
Current Price: ₹1,392 – ₹1,395 (approx)
Previous Close: ₹1,383.50
52-Week Range: ₹1,114.85 – ₹1,551.00
🔹 Support & Resistance
Immediate Support: ₹1,385 – ₹1,375
Next Support: ₹1,369
Immediate Resistance: ₹1,400 – ₹1,406
Next Resistance: ₹1,417
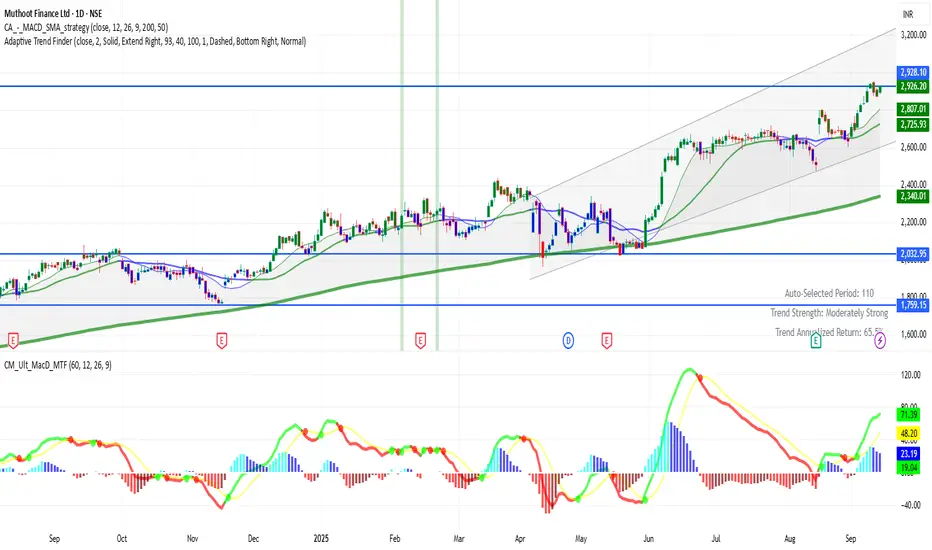
MUTHOOTFIN 1D Time framePrice is about ₹2,926
It's near its 52-week high region.
Price is trading well above most of its longer moving averages (50-day, 100-day, 200-day).
Bullish Scenario
Holding above ~ ₹2,900 is key. If that holds and price pushes past ~ ₹3,000, there’s potential to move up toward ~ ₹3,100-₹3,150.
Strength in broader market & favorable sector sentiment (gold prices, NBFC performance) would help.
APOLLOHOSP | Swing | Breakout APOLLO HOSPITAL – Elliott Wave Structure + Breakout Opportunity Ahead
Apollo Hospitals is showing a textbook Elliott Wave formation, and we might just be at the beginning of a fresh impulsive rally. If you’re a swing trader or positional investor, this setup is worth keeping a close eye on.
⸻
🧩 Elliott Wave Count Analysis
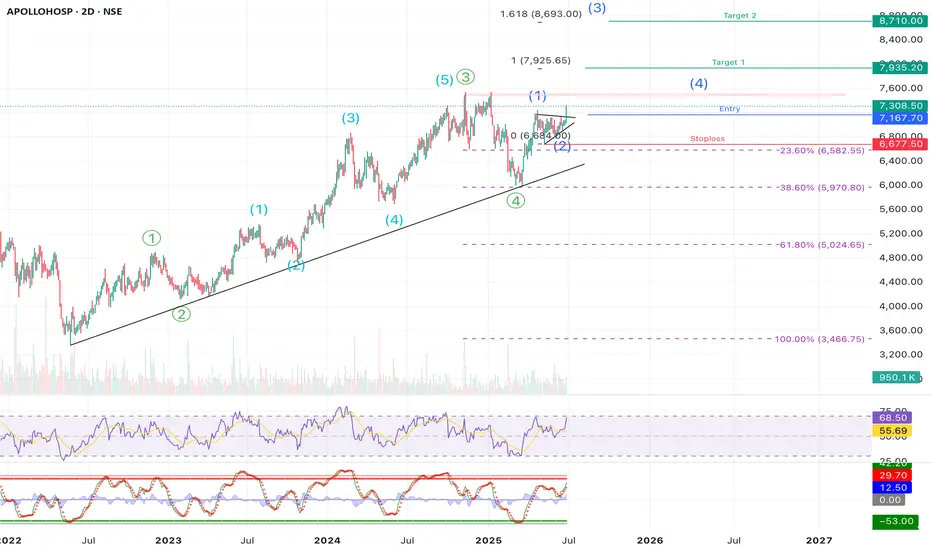
• The stock is in a larger degree 5-wave move (marked in green). Within that 1-4 completed and wave 5 in progress.
• Within that, we can also see a new 5-wave impulsive structure developing (in blue), and it seems like we just completed Wave (2) of this new leg.
• This means — Wave (3) could be starting now, which is usually the strongest and fastest wave.
⸻
📈 Trade Setup
• Entry Zone: Around ₹7,165–₹7,215
• Stoploss: ₹6,677 (just below recent swing low and invalidation of the current wave count, Around 7-8% )
• Target 1: ₹7,925 (around 10%+ )
• Target 2: ₹8,710 (around 25%)
• Extended Target (Wave 3 Fibonacci Extension): ₹9,167
The targets are based on Fibonacci extension levels from Wave (1) to Wave (2), which typically project the length of Wave (3).
⸻
🔍 Supporting Technicals
✅ Trendline Support
• Price has been respecting a long-term rising trendline since early 2022 — a strong sign of continued bullish momentum.
✅ RSI & Stochastics Turning Up
• RSI is rising but not overbought — suggesting more room for upside.
• Stochastic oscillator is also showing a bullish crossover, confirming early momentum for the next wave up.
⸻
⚠️ Risk Management Note
If price drops below ₹6,677 and breaks the trendline, that would invalidate this Elliott wave count. It’s wise to exit or reduce exposure in that case. This is key to avoid being caught in a deeper corrective phase.
⸻
📝 Summary:
Apollo Hospitals appears to be starting a fresh Wave (3) after completing a healthy correction. With a clean Elliott Wave structure, trendline support, and supportive indicators, the setup looks strong. Risk is clearly defined and the reward potential is high — a good case for a swing position.
⸻
💬 Are you tracking this Wave 3 setup too? Let’s hear your thoughts in the comments below!
Disclaimer:
This analysis is shared for educational and informational purposes only. It is not investment advice or a recommendation. Please consult a SEBI-registered financial advisor before making any investment decisions. The author is not responsible for any losses arising from trading or investing based on this analysis.
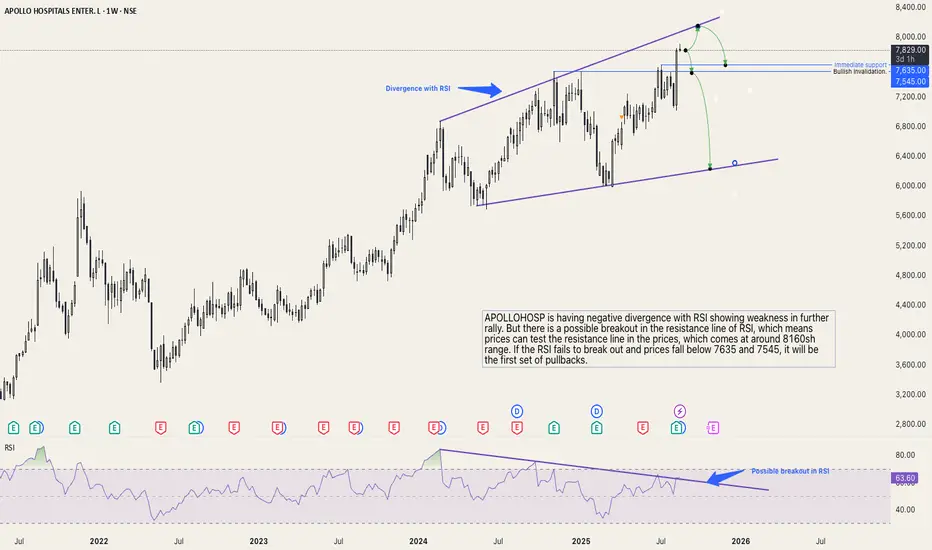
Analysis for ApollohospAPOLLOHOSP is having negative divergence with RSI showing weakness in further rally. But there is a possible breakout in the resistance line of RSI, which means prices can test the resistance line in the prices, which comes at around 8160sh range. If the RSI fails to break out and prices fall below 7635 and 7545, it will be the first set of pullbacks.
APOLLOHOSP – Ranging Channel Breakout Case Study (Educational)________________________________________
📊 APOLLOHOSP – Technical & Fundamental Educational Snapshot
Ticker: NSE: APOLLOHOSP | Sector: 🏥 Hospitals & Healthcare Services
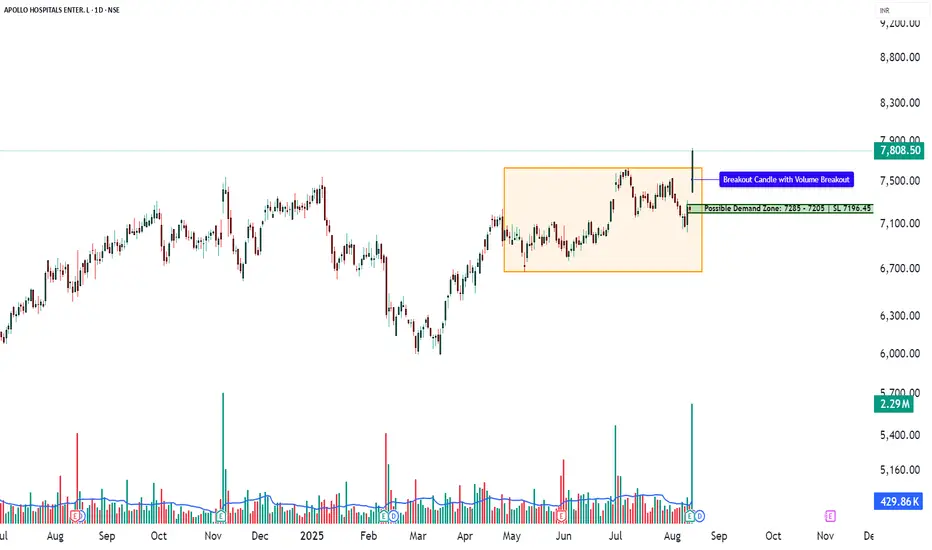
CMP: ₹7,808.50 ▲ (as of 13 Aug 2025)
Rating: ⭐⭐⭐⭐☆ (Moderately Bullish Setup – Educational Purposes Only)
Pattern Observed: 📈 Ranging Channel Breakout
________________________________________
“Apollo Hospitals is on fire! After reporting a stunning 42% rise in Q1 net profit, the stock zoomed nearly 8%, now hovering near its 52-week high. Technical charts are flashing a powerful ‘Strong Buy’ signal across multiple indicators—momentum is undeniable. With balanced options interest and analyst targets pegged around ₹8,100, the stock may still have room to run. A breakout past ₹7,800 could set the stage for the next leg higher!”
________________________________________
Chart Pattern & Technical Analysis:
Close: ₹7,808.5 — strong bullish momentum after Ranging Channel breakout.
Candle: Big bullish bar with multiple confirmations — 52-week breakout, RSI breakout, MACD crossover, Bollinger Band breakout, bullish SuperTrend.
Momentum: WVAP bullish; RSI 68, MACD Buy, CCI 235, Stochastic 96.
________________________________________
Volume Analysis:
Volume: 2.29M shares traded — 5× the 20-day average (429.86K).
Signal: Exceptional participation confirming a decisive 20-day volume breakout.
________________________________________
Support & Resistance:
Resistance: ₹7,969, ₹8,130, ₹8,420.
Support: ₹7,518, ₹7,228, ₹7,060.7.
Outlook: Possible breakout opportunity with swing trade potential.
________________________________________
Learnings:
Q1 FY26 Results: PAT ↑ ~42% YoY to ₹433 cr; revenue ↑ ~15% YoY to ₹5,842 cr; stock rallied 5–6% post-results.
AI Focus: Plans to double AI investments in 2–3 years to boost efficiency & patient outcomes.
Value Unlocking: Spin-off & listing of digital health & pharmacy unit in 18–21 months.
Share Swap: 195.2 shares in new entity for every 100 Apollo shares; Apollo to retain ~15% stake.
________________________________________
Investment Outlook & Conclusion:
📈 Bullish Case:
5th straight quarter of profit growth; Q1 beat estimates.
Expanding margins via premium care, diagnostics, and digital.
Demerger of digital health & pharmacy arm could unlock value.
AI investments to enhance efficiency & returns.
Rising insurance penetration & healthcare spending favor leaders.
________________________________________
📉 Bearish Case:
Premium valuation risks de-rating if growth slows.
Demerger success hinges on smooth execution.
Regulatory changes could impact margins.
Heavy capex & competition may delay returns.
________________________________________
📅 Short vs Long Term:
Short-term (1–3M): Possible follow-through gains from Q1 beat; track Q2 updates & demerger progress.
Long-term (12–24M): Growth from core hospitals + value creation via digital arm listing & AI-driven efficiency.
________________________________________
📊 STWP Trade Analysis:
Trend: Bullish continuation — price broke key range and sustained momentum.
Sample Trade Setup:
Entry: ₹7,840 | Stop: ₹7,011.95
Reference Levels: ₹8,668 (~1:1 RR), ₹9,496 (~1:2 RR)
💡 These prices are only for demonstrating risk–reward calculations and position planning — not for live execution.
________________________________________
Conservative Setup:
Entry Zone: ₹7,808.50–₹7,840 | Stop: ₹7,723.24
Reference Levels: ₹8,064, ₹8,235
(For learning position sizing and risk control)
________________________________________
Pullback Watch:
Zone: ₹7,717.56 | Stop: ₹7,594 | Potential retest area
Potential Use: Studying pullback retests in breakout structures.
________________________________________
Possible Demand Zone(on Daily Time Frame): 7285 - 7205 | SL 7196.45
This is for observing historical demand behaviour — not a call to buy.
________________________________________
Market View (Based on Current Data):
Overall Bias: Bullish positioning.
Trend: Uptrend likely if ₹7,800–₹7,850 holds as support.
Volatility: Moderate (IV ~22–26).
OI Insight: Strong call writing above spot & put writing below — bullish stance with support defense.
________________________________________
🔍 Option Structures – For Learning Purpose
(Prices, Greeks & OI data are from market snapshot on 13 Aug 2025)
________________________________________
7800 CE – LTP ₹155.60
📊 Delta: 0.54 | Theta: -6.27 | IV: 22.39%
💡 Breakeven: ₹7,955.60
Why it’s worth studying:
ATM strike with quick reaction to spot moves (Delta ~0.50)
Strong OI build-up (+1.52L) & high liquidity (37k contracts)
Positioned just above spot; could capture momentum on a 7,850+ breakout
________________________________________
7600 PE – LTP ₹66.60 | Contra View
📊 Delta: -0.27 | Theta: -4.19 | IV: 25.18%
💡 Breakeven: ₹7,533.40
Why study it:
Strong short build-up in Puts (+3.32L OI) shows confidence price stays above this level
~200 pts below spot, acting as a buffer support zone
Higher IV means time decay favours sellers if support holds
________________________________________
Bull Call Spread
🟢 Buy: 7800 CE @ ₹155.60
🔴 Sell: 8000 CE @ ₹72.20
💰 Net Debit: ₹83.40 | Breakeven: ₹7,883.40
Why study it:
Lowers cost vs. naked CE buy by pairing ATM buy with OTM sell
Positive delta for upside, with loss capped to net debit
8000 strike OI acts as a profit cap zone, helping define risk-reward
Reduces theta decay compared to a single long option
________________________________________
📘 My Trading Setup Rules
Avoid Gap Plays
→ Check pre-open price action to avoid trades influenced by gap-ups/gap-downs.
Breakout Entry Only
→ Enter trades only if price breaks previous day’s High (for bullish trades) or Low (for bearish trades).
Watch Volume for Confirmation
→ Monitor volume closely. No volume = No trade.
Enter on Strong Candle + Volume
→ Execute the trade only if a strong candle appears with increasing volume in the direction of the trade.
Defined Risk:Reward Only
→ Take trades only if R:R is favorable (ideally ≥ 1:2).
Premium Disclaimer
→ Option premiums shown are based on EOD prices — real-time premiums may vary during execution.
Time Frame Preference
→ Trade with your preferred time frame — this strategy works across intraday or positional setups.
________________________________________
⚠️ Disclaimer – Please Read Carefully
The information shared here is meant purely for learning and awareness. It is not a buy or sell recommendation and should not be taken as investment advice. I am not a SEBI-registered investment advisor, and all views expressed are based on personal study, chart patterns, and publicly available market data.
Trading — whether in stocks or options — carries risk. Markets can move unexpectedly, and losses can sometimes be larger than the money you have invested. Past performance or past setups do not guarantee future results.
If you are a beginner, treat this as a guide to understand how the market works — practice on paper trades before risking real money. If you are an experienced trader, remember to assess your own risk, position sizing, and strategy suitability before entering any trade.
Data, prices, and analysis are based on information available as of 12 August 2025, and market conditions can change at any time. Always verify with reliable sources and consult a SEBI-registered financial advisor before making any real trading decision.
By reading, watching, or engaging with this content, you acknowledge that you take full responsibility for your own trades and investments.
________________________________________
💬 Found this useful?
Drop your thoughts, questions, or setups in the comments — let’s grow together!
🔁 Share this post with fellow traders and beginners to spread clean, structure-based learning.
✅ Follow simpletradewithpatience for beginner-friendly setups, price action insights, and disciplined trading content.
🚀 Stay Calm. Stay Clean. Trade With Patience.
Trade Smart | Learn Zones | Be Self-Reliant 📊
________________________________________
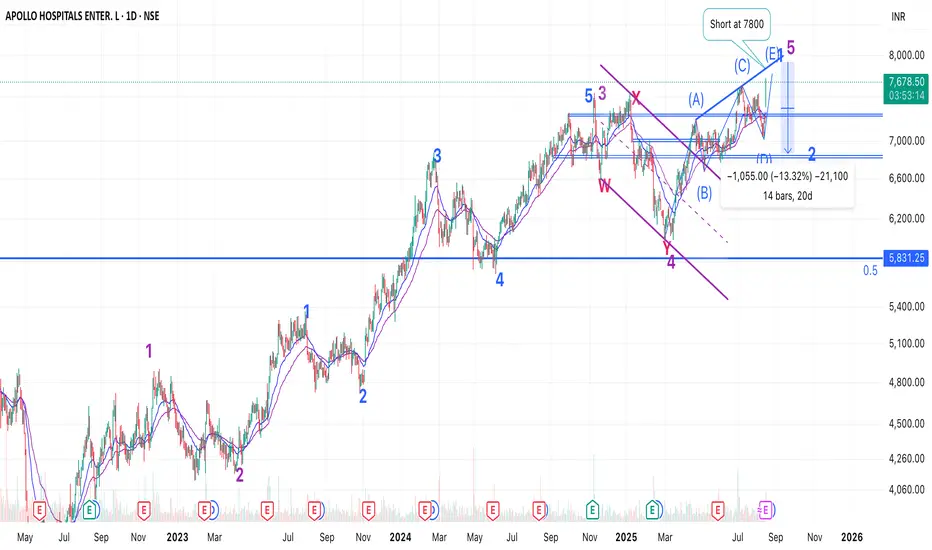
Apollo Hospital - Elliot Wave Counts - ShortApollo has been an out-performer in the entire correction phase.
However, just like many other Pharma stocks - which outperformed but are now topping out, Apollo Hospital is also about to complete 5 up in an ED.
Check Divis for reference:
Now, weather this 5 up completes just one more from the March 2025 lows or the entire upmove from May 2022 lows remains to be seen.
In both cases, we should get a decent 8-10% pullback.
APOLLOHOSP Soon to ATH??!!!Yessss!!!!!
Chart patterns looks prudent for the above titled opinion
Rounding bottom....with a Inverted H&S pattern awaiting a Breakout!!!!!!
Expecting a Breakout by this week or next.
We can make our entry after the breakout solid candle....
Just add it to your watchlist and keep an eye on it!!!!
will update once the breakout happens!!!!!
just my opinion....not an advice nor tip....
Thank you!!!!!!

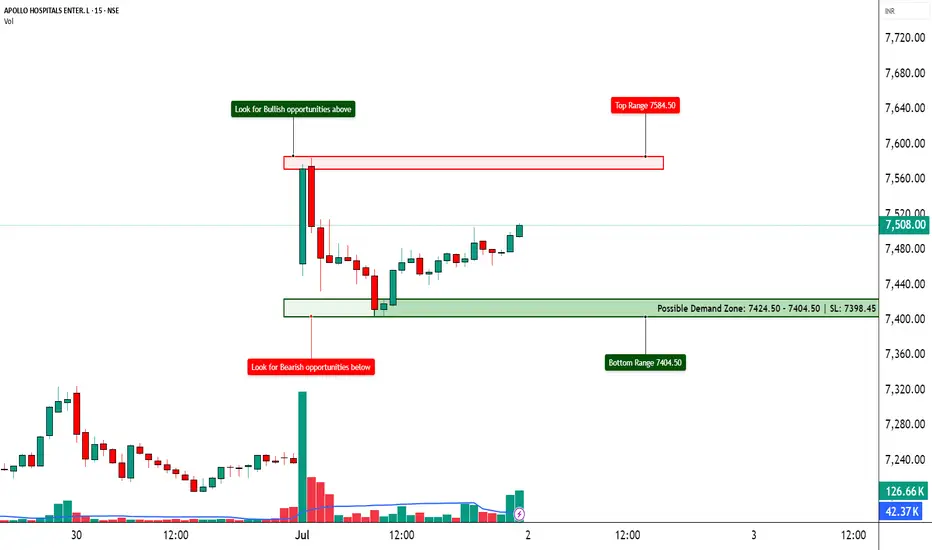
APOLLOHOSP – Preparing for the Next Breakout ?📈 APOLLOHOSP – Preparing for the Next Breakout?
🔍 Bullish Setup Unfolding | Option Chain + Price Action Analysis
Chart Type: 15-min / 1H / Daily
Indicators: STWP Zones, Volume, Demand-Supply, Price Action
🔹 What’s Catching Our Eye?
✅ Strong Long Build-Up across 7500–8000 Calls
✅ Heavy Put Writing at 7500, 7400, and even 7000
✅ Volatility Expansion + Rising OI = Possible Range Expansion Move
✅ Clean Demand Zone at 7400–7450 with a Morning Star Bounce (if visible)
✅ ATM Call (7500 CE) up 124% with +38% OI – Institutions possibly preparing for an up move!
📊 What We’re Watching for:
📍 Trigger Level: 7520–7550 Breakout
📍 Targets: 7600 → 7700 → 7800
📍 Invalidation Below: 7420
📍 Momentum Confirmation: Price closing above 7550 with volume spike
📍 Option Chain Support: 7000–7400 (Heavy PE writing)
📌 Trade Plan (Educational Purpose Only):
🔹 Bullish: Buy on breakout above 7550 with SL below 7440
🔹 Options: Consider 7600 or 7700 CE based on risk profile
🔹 BTST Type: If price holds 7500–7520 till close
⚠️ Disclaimer:
This post is for educational and learning purposes only.
It does not constitute buy/sell advice or investment recommendation.
Always consult your financial advisor before taking any positions.
STWP is not liable for any financial decisions based on this content.
📚 "Let Data Drive the Trade – Not Emotion!"
💬 What's your take on ApolloHosp? Bullish ride or trap zone?
APOLLO HOSPITALS (NSE: APOLLOHOSP)View: Strongly Bullish.
Bias: High momentum uptrend.
Strategy:
BUY: Initiate at current levels (around ₹7500) or on dips towards ₹7250-₹7300, or on a confirmed daily close above ₹7600.
Targets (T):
T1: ₹7800-₹8000
T2: ₹8250-₹8500
Stop-Loss (SL): ₹7150 (on daily closing basis).
Reasoning:
Confirmed breakout from a significant Rectangle/W-pattern consolidation.
Exceptional volume accompanying the breakout.
Strong bullish momentum indicated by RSI.
Potential for a new leg of the uptrend after clearing ₹7600.
Note: This is an educational analysis and not financial advice. Do your own due diligence before investing.

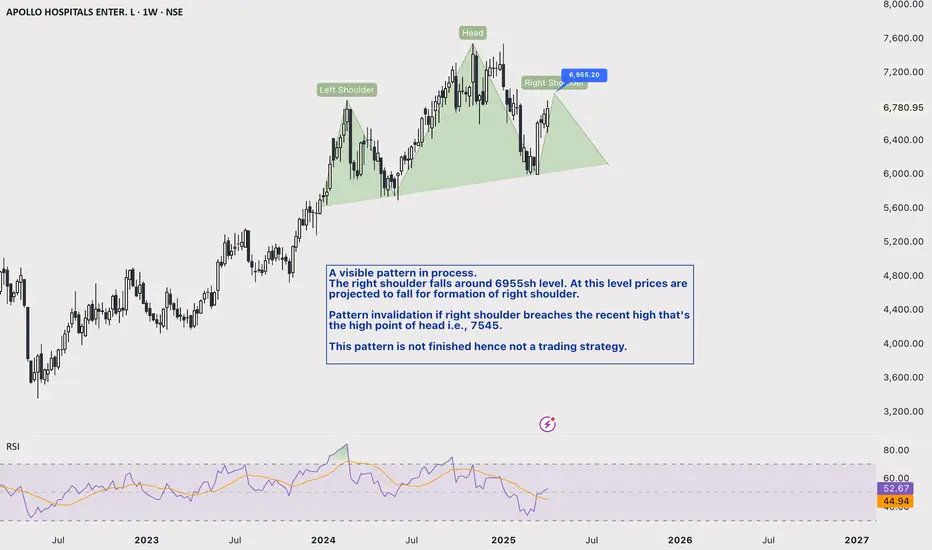
Apollo Hospital: H&S in process > BearishA visible pattern in process.
The right shoulder falls around 6955sh level. At this level prices are projected to fall for formation of right shoulder.
Pattern invalidation if right shoulder breaches the recent high that's the high point of head i.e., 7545.
This pattern is not finished hence not a trading strategy.
Cup & Handle Chart Pattern Breakout | APLAPOLLO⭕️ Price Action Analysis Alert !!!⭕️
FOR EDUCATION PURPOSE ONLY!!!
✅Overview of APL Apollo Tubes Ltd.
👉It is India’s leading manufacturer of structural steel tubes and hollow sections, widely used in construction, infrastructure, and industrial applications
👉Focused on substituting traditional building materials with advanced steel solutions.
✅Fundamental Analysis
📍The company maintains healthy profit margins due to cost-efficient operations and strong pricing power.
📍 Managed to keep its debt under control, maintaining a strong balance sheet.
📍High ROE and ROCE
📍Stock valuation due to strong growth potential, market leadership, and consistent performance.
✅Technical Analysis:
1️⃣Cup&Handle chart Pattern Bo
2️⃣Supporting Volume
3️⃣Supporting EMA
4️⃣BO Confirmation
5️⃣Strong Support
✅Check out my TradingView profile to see how we analyze charts and execute trades.
🙋♀️🙋♂️If you have any questions about this stock, feel free to reach out to me.
📍📌Thank you for exploring our idea! We hope you found it valuable.
🙏FLLOW for more !
👍LIKE if useful !
✍️COMMENT Below your view !

A Healthcare Face-Off: Apollo vs. Narayana◉ Abstract
India's hospital industry is growing rapidly, valued at ₹8.35 lakh cr. ($98.98 B) in 2023, with a projected CAGR of 5.8-8.0% from 2024 to 2032. Apollo Hospitals and Narayana Hrudayalaya are two leading players, with Apollo being the largest private hospital network and Narayana Hrudayalaya known for cost-effective cardiac care. Narayana Hrudayalaya appears undervalued with a P/E ratio of 33.5 and more profitable (ROCE: 27%), making it an attractive investment option. Apollo Hospitals seems overvalued with a P/E ratio of 83.4 but remains viable for strategic entry points. Both companies are poised for growth driven by increasing healthcare demands and infrastructure expansion.
Read full analysis here........
◉ Introduction
The hospital industry in India is experiencing significant growth, with the market valued at approximately ₹8.35 lakh cr. ($98.98 B) in 2023. Projections indicate a robust compound annual growth rate (CAGR) of 5.8% to 8.0% from 2024 to 2032, potentially reaching between 13.87 lakh cr. and 16.33 lakh cr. ($164.4 B - $193.6 B) by 2032, depending on various market analyses.
◉ Growth Drivers of the Indian Hospital Industry
● Increased Healthcare Expenditure:
➖ Rising public and private spending on healthcare, with government health expenditure aiming for 2.5% of GDP by 2025.
➖ Expanding middle class with higher disposable incomes and greater access to health insurance.
● Technological Advancements:
➖ Adoption of healthcare technologies such as telemedicine and robotic automation, improving service delivery.
➖ National Digital Health Blueprint promoting innovations in e-health.
● Policy Support and Foreign Investment:
➖ Favourable government policies allowing 100% FDI in healthcare, attracting significant investments.
➖ Public-private partnerships enhancing healthcare access, especially in underserved areas.
● Demand for Specialized Services:
➖ Increasing incidence of lifestyle diseases driving demand for specialized healthcare.
➖ Growth in medical tourism as India becomes a preferred destination for cost-effective treatments.
These factors are collectively propelling the growth of the hospital industry in India, positioning it for a promising future.
◉ Key players in the Indian hospital sector
1. Apollo Hospitals leads the sector with a market capitalization of approximately ₹98,646 Cr, establishing itself as the largest private hospital network in India.
2. Max Healthcare closely follows, boasting a market capitalization of around ₹97,820 Cr.
3. Fortis Healthcare is another key participant in the market, with a market capitalization of ₹48,249 Cr.
4. Global Health also ranks among the premier healthcare institutions, holding a market capitalization of ₹28,786 Cr.
5. Narayana Hrudayalaya is recognized for its cost-effective cardiac care services and maintains a notable market share with a market capitalization of ₹26,086 Cr.
In this report, we will conduct an in-depth analysis and comparison between two of India's leading healthcare providers, Apollo Hospitals and Narayana Hrudayalaya. This comprehensive evaluation will assess their technical and fundamental aspects,
◉ Company Overviews
● Apollo Hospital NSE:APOLLOHOSP
Apollo Hospitals was founded in 1983 by Dr. Prathap C Reddy, a visionary in the evolution of modern healthcare in India. As the first corporate hospital in the country, Apollo Hospitals is celebrated for leading the charge in the private healthcare transformation.
Today, Apollo Hospitals stands as Asia's leading integrated healthcare services provider, boasting a strong footprint throughout the healthcare landscape. This includes a diverse range of services such as hospitals, pharmacies, primary care and diagnostic clinics, as well as various retail health models.
● Narayana Hrudalaya NSE:NH
Narayana Hrudayalaya Limited is involved in providing medical and healthcare services both in India and abroad. It functions through two main divisions: Medical and Healthcare Related Services, and Others. The organization is responsible for acquiring, owning, and managing a variety of healthcare facilities, including hospitals, clinics, health centres, diagnostic centres, and nursing homes, among other related operations. Its range of services encompasses cardiology, cardiac surgery, nephrology, urology, neurology, neurosurgery, endocrinology, orthopaedics, internal medicine, obstetrics, gynaecology, pediatrics, neonatology, gastroenterology, and oncology. Additionally, the company is active in the health insurance sector. Established in 2000, its headquarters is located in Bengaluru, India.
◉ Technical Analysis
● Apollo Hospitals
➖ The stock faced a significant obstacle near the 5,800 level, resulted in a steep drop.
➖ It later found support around 3,500 and rebounded.
➖ Following an extended period of consolidation, the price developed a Rounding Bottom pattern.
➖ A breakout ensued, leading to a price increase, but it encountered resistance close to 6,800, which triggered a pullback to the breakout point.
➖ Following a successful retest, the price surged past the previous high, reaching a new peak at 7,545.
➖ However, due to prevailing negative market sentiments, the price has since retraced and is currently trading just above its immediate support zone.
● Narayana Hrudalaya
➖ The stock price is overall in an uptrend.
➖ After reaching an all-time high close to the 1,445 level, the price experienced a decline and has since entered a consolidation phase.
➖ A Symmetrical Triangle pattern has formed on the chart.
➖ We expect an upward breakout from this pattern, which could lead to a significant price rally.
◉ Relative Strength
➖ The chart reveals that both Apollo and Narayana Hrudayalaya have underperformed the Nifty Healthcare index. Although Apollo has given a descent 31% return, Narayana lagged significantly, yielding a modest 17% return. In contrast, the Nifty Healthcare index delivered an impressive 41% return.
◉ Service Wise Revenue Breakdown
● Apollo Hospitals
The company operates through three primary segments, each contributing significantly to its revenue.
➖ Healthcare services account for approximately 52% of total revenue, forming the largest share.
➖ The retail pharmacy business generates nearly 41% of total sales, while the retail health and diagnostics segment contributes the remaining 7%.
● Narayana Hrudalaya
➖ The company operates exclusively in the healthcare services sector, deriving all its revenue from this single segment.
◉ Revenue & Profit Analysis
● Apollo Hospitals
Year-over-Year
➖ The company's fiscal year 2024 performance was marked by strong growth, with revenue reaching ₹19,059 crore, a 15% increase from ₹16,612 crore in FY23.
➖ EBITDA surged to ₹2,394 crore, up from ₹2,065 crore in FY23, while the EBITDA margin improved to 13% from 12%.
Quarter-over-Quarter
➖ In the latest quarter ending September 2024, the company achieved its highest-ever sales of ₹5,589 crore, significantly up from ₹5,086 crore in June 2024. This quarter-on-quarter growth has been consistent since March 2022.
➖ EBITDA for the quarter was an impressive ₹816 crore, a 21% increase from ₹675 crore in June 2024.
➖ Diluted EPS (LTM) rose substantially to ₹83.31 from ₹72.13 in June 2024.
● Narayana Hrudalaya
Year-over-Year
➖ In FY24, our company achieved remarkable sales growth, surging 11% to ₹5,018 crore from ₹4,525 crore in FY23.
➖ EBITDA soared to ₹1,173 crore, up from ₹987 crore in the same period, with an impressive EBITDA margin of 23%.
Quarter-over-Quarter
➖ Our quarterly sales reached an all-time high of ₹1,400 crore in September, representing a 4% increase from ₹1,341 crore in June.
➖ Although EBITDA growth was modest, it still improved to ₹308 crore in September from ₹304 crore in June 2024.
➖ However, Diluted EPS experienced a decline, dropping to ₹38.85 from ₹39.72.
◉ Valuation
● P/E Ratio
➖ Apollo Hospitals' current P/E ratio stands at 83.4, down from its 1-year median of 107.7. However, this remains significantly above the industry average of 56.9, indicating overvaluation.
➖ In contrast, Narayana Hrudalaya's P/E ratio of 33.5 is slightly above its 1-year median of 32.8 and substantially below the industry average, suggesting undervaluation.
● P/B Ratio
➖ Apollo's P/B ratio of 13.15 indicates considerable overvaluation compared to the industry average of 7.18.
➖ Narayana Hrudalaya's P/B ratio of 8.14 also suggests overvaluation, albeit to a lesser extent.
● PEG Ratio
➖ Narayana's PEG ratio of 0.49 positions it as an attractive investment opportunity, especially when compared to Apollo's considerably higher PEG of 2.43.
◉ Profitability Analysis
➖ Apollo Hospitals ROCE - 15% in FY24
➖ Narayana Hrudalaya ROCE - 27% in FY24
The significant difference in ROCE between the two healthcare giants underscores Narayana Hrudalaya's superior profitability. Narayana's impressive ROCE of 27% demonstrates its ability to efficiently utilize its total capital, comprising both equity and debt, to generate substantially higher returns.
◉ Cash Flow Analysis
➖ Apollo Hospitals has demonstrated impressive growth in its operating cash flow, surging 39% to ₹1,920 crore in FY24 from ₹1,377 crore in FY23. This robust growth underscores the company's efficiency in converting profits into cash, highlighting its strong financial health and liquidity position.
➖ In contrast, Narayana Hrudalaya has shown sluggishness in turning profits into cash, with its operating cash flow declining 2% to ₹1,067 crore in FY24 from ₹1,085 crore in FY23.
◉ Debt Analysis
➖ Apollo Hospitals' debt stands at ₹7,371 crore, resulting in a debt-to-equity ratio of 0.98, which, although relatively high, is not alarming. However, the company's low interest coverage ratio of 4.69 raises concerns about its ability to service its debt. This vulnerability may complicate repayment of borrowed loans, potentially straining Apollo's financial stability.
➖ In contrast, Narayana Hrudalaya's debt of ₹1,703 crore and debt-to-equity ratio of 0.53 indicate robust financial health. Furthermore, its impressive interest coverage ratio of 8.34 suggests the company is well-positioned to manage its debt obligations, ensuring greater financial flexibility and stability.
◉ Shareholding Pattern
● Apollo Hospitals
➖ In the September quarter, Foreign Institutional Investors (FIIs) increased their stake in Apollo Hospitals to 45.37%, up from the previous quarter.
➖ Conversely, Domestic Institutional Investors (DIIs) reduced their holdings to 19.94%, a significant decrease from 24.77% in the last quarter.
● Narayana Hrudalaya
➖ In contrast, Narayana Hrudalaya witnessed a decline in institutional investor holdings. FIIs reduced their stake to 9.69%, down from 10% in the previous quarter.
➖ Domestic Institutional Investors (DIIs) also decreased their holdings to 7.9%, down from 8.22% in the June quarter.
◉ Conclusion
Following a comprehensive analysis of both technical and fundamental aspects, we conclude that Narayana Hrudalaya appears to be favorably positioned from a valuation perspective, presenting an attractive investment opportunity.
However, this does not diminish Apollo Hospitals' potential. Although the stock currently appears overvalued, investors can consider accumulating shares during dips, making it a viable option for those seeking strategic entry points.
The healthcare sector's promising growth trajectory, fueled by rising healthcare demands and infrastructure expansion, positions both companies for potentially excellent returns in the near future.

Thyrocare for 70%+ gains after correctionDate: 3 Nov’24
Symbol: THYROCARE
Timeframe: Daily
Apparently, Thyrocare seems to be in Wave III which could conclude around 1000. Post which Wave IV correction could come down to 840-820 levels marked as Demand Zone in the chart. And Wave V then will be heading to 1430 to 1500 levels (70%+ from 830 levels) depending on where Wave IV ends. Its all time high price is 1465.
This is not a trade recommendation. Please do your own analysis.
HINGLISH VERSION
Jaahir taur par, Thyrocare Wave III mein lagta hai jo 1000 ke aaspaas samaapt ho sakta hai. Jiske baad Wave IV chart mein Demand Zone ke roop mein ankit 840-820 ke star tak neeche aa sakta hai. Aur Wave V tab 1430 se 1500 ke star (830 ke star se 70%+) ki taraf badh jaega, yah is baat par nirbhar karega ki Wave IV kahaan samaapt hota hai. Thyrocare ki all time high keemat 1465 hai.
Yah koi trade lene ki salah nahin hai. Kripya apana vishleshan khud karein.

Metropolis Healthcare for 140%+ gainsDate: 12 Oct’24
Symbol: Metropolis
Timeframe: Weekly
Metropolis Healthcare seems to be in Wave 3 in larger timeframe which is heading towards its all time high (ATH) of 3575 (~57% from current price of 2275) as seen in the chart. Wave 4 is likely to come down to around 2700 levels and in Wave 5, it could target 5500-6000 (140%+ from current price). A good year ahead likely for this diagnostic company.
Interestingly, the waves could also coincide with a Cup & Handle pattern formation as seen in the chart. Please note this is a long shot so take it with a pinch of salt. However, one can be confident to enter until the ATH (whatever route the price movement takes).
This is not a trade recommendation. Please do your own analysis. And I’ve the right to be wrong.
Aisa lagta hai ki Metropolis Healthcare badi samay seema mein Wave 3 mein hai, jo 3575 ke apane sarvakaalik uchch (ATH) (2275 ki vartamaan keemat se ~57% high) ki or badh raha hai, jaisa ki chart mein dekha gaya hai. Wave 4 ke 2700 ke star tak neeche aane ki sambhaavana hai aur Wave 5 mein, yeh 5500-6000 (maujooda keemat se 140%+) ka lakshya rakh sakta hai. Is diagnostic company ke lie aane vaala saal achchha rahane kee sambhaavana hai.
Dilchasp baat yah hai ki Waves Cup aur Handle ke gathan ke saath bhee mel kha sakti hain jaisa ki chart mein dekha gaya hai. Kripya dhyaan den ki yah ek lamba shot hai isliye ise thodi satarkta se trade karein. Haalaanki, koi bhi ATH (keematon mein utaar-chadhaav chaahe jo bhee raasta apanae) tak pravesh karne ke lie aashvast ho sakta hai.
Yeh koi trade karne ki salah nahin hai. Kripya apna vishleshan swayam karen. Aur mujhe galat hone ka adhikaar hai.

APOLLOHOSP_Hormonic Reversal_Short sellingHarmonic 4-Point Pattern
pattern has formed in the daily timeframe for apollo hospital and its reverse zone where between ( 7276 & 7391 ), we are expecting reversal start form this zones.
RSI
Day rsi had crossed 70+ which indicates the stock is in the overbought area.
Conclusion
It's nearly to harmonic reversal zone & Rsi also is over bought, so we are excepting 3-5℅ sell target, Plan accordingly to your trading plan setup coz nifty is getting HH formation
trend is up side (All time High).
Education Purpose only.
Regards
Sathish

APOLLO HOSPITAL - Inverted Head and ShoulderApollo Hospitals Enterprise Ltd, First Quarter Result FY25
➡️Recorded highest-ever revenue, up 15% YoY.
➡️PAT jumped 83% YoY led by the growth in topline.
Revenue 🔼 15% at ₹5,086 crore
EBITDA 🔼 33% at ₹675 crore
Net Profit 🔼 83% at ₹305 crore

LONG TERM TARGET FOR APOLLO HOSPITALSWe can see a strong breakout on monthly basis in " Apollo Hospitals ". The current monthly candle is undergoing a retracement to test the level of breakout. If the breakout is genuine, after retracement, there will be signs of bullish reversal. This indicates that the current trend is about to continue and for that I've used the ABCD pattern of Harmonics to find the next target of the current impulse wave. For entry with a good Risk-to-Reward Ratio, we need to switch to a lower timeframe and look for that "Bullish Reversal Pattern".

Apollo hospitals positional trading ideasIt is forming a falling wedge pattern. inside the falling wedge, there is a double bottom pattern you can see.
Stock is in a up trend.
it also retesting the weekly breakout level.
If it breaks the wedge pattern upside. it may go higher.
Disclaimer: All information provided here is for educational purposes and not a recommendation, advice, research report, or stock tip of any nature. Analysis Posted here is just our view/personal study method on the stocks, commodities or other instruments and assets. Do your own analysis or consult your financial advisor before making any investment decision.

apollo hospital looks weak cmp 5900
setup looks weak.
try to avoid longs
can fall to 5600
just a educational opinion and not a trading idea.

Apollo Hospitals at all time high with flag patternPrice is at all time high and making flag pattern above previous high levels, need to wait and see if its continuation pattern or will get rejection from all time high.
