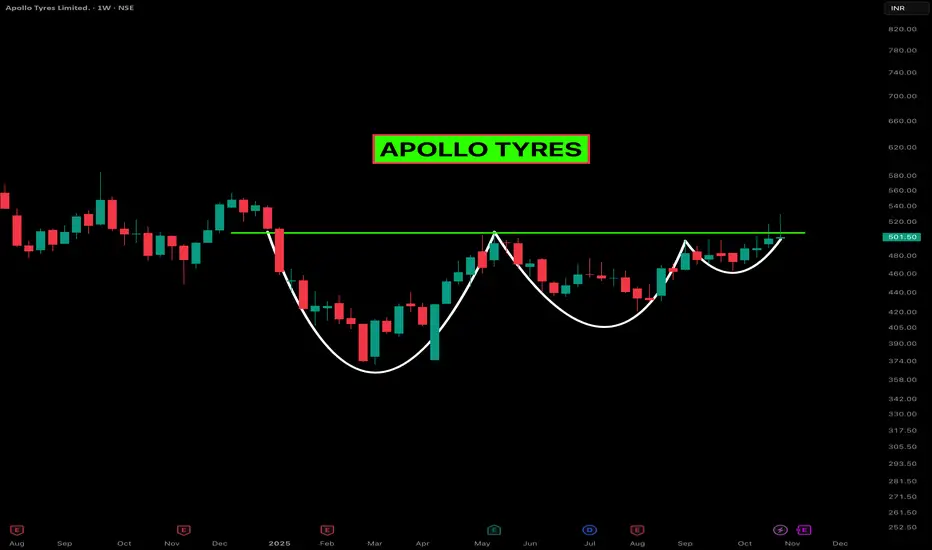
APOLLOTYRE : adjusting its base.📘 APOLLOTYRE – Technical Analysis & Trading Plan
(Chart timeframe: Daily | Structure & Wave-based analysis)
🔍 Market Structure Overview
APOLLOTYRE has already signaled a Change of Character (CHoCH) after breaking its prior bearish structure, confirming a trend transition from distribution to accumulation. Since then, price has respected higher lows and moved within a rising structure.
Currently, price is correcting within a healthy pullback phase, aligning with a Wave 4 retracement, while t
Apollotyrelong
APOLLO TYRES – Volatility Contraction Breakout in MotionApollo Tyres is showing some serious strength on the weekly chart. After months of squeezing inside a clean Volatility Contraction Pattern (VCP), the stock has finally started to break above the neckline zone around ₹500–₹520 — a level that’s acted as a ceiling multiple times in the past.
The structure is textbook — each pullback getting shallower, each base tighter, and now price pushing through resistance with conviction. That gradual reduction in volatility often signals institutional accumu
APOLLOTYRE – Reversal in Play After 5-Wave Decline
# 📊 \ APOLLOTYRE – Bullish Reversal on 60-Min Chart\
🔍 \ Completed 5-Wave Down → ABC Correction → Support Reaction\
---
## 🟦 \ Support Zone: ₹439.52 – ₹444.40\
📌 This critical demand zone includes:
• TS3 Low
• End of corrective wave
• Strong volume cluster (smart money reaction)
➡️ Price bounced after touching this zone, suggesting accumulation and bullish intent.
---
## 🟨 \ Immediate Resistance: ₹460–₹465 at minor wave C completion zone\
🚧 First supply zone where price may pause or
Apollo Tyres Swing Long Update- Apollo Tyres is currently trading at 526.7
- Apollo Tyres already gave an upside of 4% from my entry and now it is setting up for a huge expansionary move
- Apollo tyres will be at a lovely spot if you see it falling back or revisiting 512-519
- I will be interested to see Apollo tyres revisiting the same area to add a huge size
- Please don't add size or take entries based on my opinion try to first manage risk according to your corpus and make sure you don't follow my advices blindly
- Ov
Apollo Tyres Swing Long Setup - Apollo Tyres is currently Trading at 507
- Apollo Tyres has a bullish structure shift and so far making higher highs
- Apollo Tyres looks all set to purge and print candles above 520
- Look to add swing longs in Apollo T when you see it around 499-505
- Keep a wide sl of 3% from your entry and watch it print 1:2 easily
Apollo tyresApollo tyres, is looking currently in good momentum upside, it has broken resistance trendline along with good intensity of volumes along with challenging upper Bollinger band, also trend indicator macd is supporting same trend right now.
As per Elliott wave projection it shows possibly we are in wave 3rd of wave 5th on daily time frame, which is a cautious sign to be ready for profit booking phase in near term and be very alert to book profits at near targets, also RK's mass psychological indic
APOLLOTYRE - Ichimoku Bullish Breakout Stock Name - Apollo Tyres Limited
Ichimoku Cloud Setup :
1). Today's close is above the Conversion Line
2). Future Kumo is Turning Bullish
3). Chikou span is slanting upwards
All these parameters are showing bullishness at Current Market Price
and more bullishness AFTER crossing 315
#This is not Buy and Sell recommendation to any one. This is for education purpose and a helping hand to learn trading in Market.
# Cloud Trading
# Ichimoku Cloud
# Ichimoku Followers
I hope you all like my
Apollotyre Long opportunity Apollotyres looks bullish, Price rejected from all time high supply levels and
Price is trying to cross all time high again with good volume,
Higher time frame candles also looks strong and there is small cup pattern in daily time frame,
we may see price breaking all time high and move towards 315/330 levels very soon or
it may consolidate some time and go to higher levels.
Apollo tyre buy trend analysis hi..,
1. Apollo tyre formed bull flag pattern in weekly.., after huge rally in 2020 its traded in rangebound market past 1.5 years
2. now the stock range bound phase done..,
3. also double bottom in weekly breakout
4. buy for swing trade first target 280
target period 4 weeks
5.for investment also gud level of buy target it will hit new.., buy trend for couple of years
Apollo Tyre Chart Analysis !!📈 Apollo Tyre 📉
My Findings :-
1. Breakout from a swing high and Resistance Zone.
2. Close above March high.
3. Higher High and Higher Low formation.
4. Auto Sector is in Uptrend.
Bias- Long
Target- 227, 243 and 259
SL- 187
RR- 1: 2
All Important Supports and Resistances are drawn in chart.
All levels are of Spot and on closing basis.
Disclaimer : Consult Your Financial Advisor Before Taking Any Decision On This Analysis.
APOLLO TYRES SHORT TERM-SWING TRADEHello, apollo tyres short-term swing trade buy: 197 target: 221 stoploss: 189.
LOGIC BEHIND TRADE: Stock has formed W pattern & given breakout of dynamic trendline resistance & static resistance breakout buying strategy, (targets identified from harmonic xabcd pattern level 0.886) stoploss is taken low of resistance candle. Stock looks solid for swing trading. NSE:APOLLOTYRE
ApolloTyre - Ready to break the boxPrice getting ready to break the box with strong green candles after making a double bottom, this indicates this time it will definitely break the box and reaches the next resistance levels as marked.
If CNXAUTO breaks the ATH then these Bull stocks also moves along with that flow, choose your stock easy !!! :)
Apollo Tyres Ltd - 10.12.2021Apollo Tyres Ltd - 10.12.2021
The stock is trading @ 217 levels
The prices are @ support levels
Stochastic overbought in daily chart
Prices are above ema
There is a DOJI in daily chart
There is a HAMMER in weekly chart
Let the prices go above 219
watch out for the price action
Apollo Tyres Ltd - 09.12.2021Apollo Tyres Ltd - 09.12.2021
The stock is trading @ 216 levels
there is MACD Bullish Divergence in weekly chart
the prices are above ema
one can initiate a buy position @ current levels with support @ 209
the stock will see a further upside movement above 223
watch out for the price action
Journey From BEAR to BULL...LOGIC,LEVEL AND TARGET WELL MENTIONED IN THE CHART
NOTE -The above interpretation from the chart is my personal view and doesn't guarantee any success.
(Do talk to your financial advisor before making any investment decisions)
please like, share and comment if you have any suggestion regarding this analysi