AUDNZD Trading Idea – Momentum & Liquidity OutlookThe pair has been in a clear expansion phase, showing strength after multiple structure breaks. Momentum has favored the upside, while recent consolidation reflects market participants taking profits and rebalancing orders.
A corrective wave appears to be unfolding, which is typical after strong impulsive moves. Such phases often allow liquidity collection before the next directional expansion. The broader sentiment suggests that buyers are still active, but short-term volatility may create temporary pullbacks.
Educational Note: Markets move in cycles of impulse and correction. Recognizing these phases helps traders avoid chasing moves and instead prepare for continuation opportunities once the correction stabilizes.
AUD (Australian Dollar)

GBP/AUD WEEKPLAN: Best Sell Zone Short StoplossFootprint Analysis OANDA:GBPAUD
Previous Trend: The candles before the 18th showed an uptrend. Specifically, the candle on the 17th had a strong positive Delta (+5.24K), with the buy volume (green) dominating the sell volume (red) at most price levels. This confirms that buyers were in control and pushed the price up.
Order Flow Shift: Starting with the candle on the 18th, there was a clear change. This candle had a negative Delta (-1.55K), indicating that selling pressure had started to take over again. Although the total volume remained high, the Delta shows that selling pressure was strengthening.
Current Trend (19th): The most recent candle has a positive Delta (+2.07K). This is very important. It shows that after a day of strong selling pressure, buyers have returned. The large buy volume (green) at lower price levels compared to the recent high indicates that buyers are "accumulating" at a lower price. This is a sign that a recovery may be underway.
In summary of the Footprint: The Footprint data confirms a short-term correction (due to the negative Delta), but the return of a positive Delta shows that buying pressure has returned. This aligns with a scenario where the price retraces to a strong support zone before continuing the uptrend.
OANDA:GBPAUD SMC Plan Analysis
Market Structure Analysis
Change of Character (M-ChoCH): The price changed its structure from bearish to bullish by breaking the most recent high, marked as "M-ChoCH".
Break of Structure (BOS): After the ChoCH, the price continued to rise and broke a higher high, creating a new "BOS," which confirms that the uptrend is still strong.
Current Trend: The price has created a new high and is in a corrective phase, retracing to a strong support zone.
Identification of Key Zones
Support/Buy Zone:
Location: The price range is from ~2.0420 to ~2.0440.
Significance: This is the most important Order Block (OB) zone. It was formed right after the BOS and shows signs of buying pressure returning (confirmed by the recent positive Delta on the Footprint). This is the highest-potential area to consider for a long entry.
Resistance/Sell Zone:
Location: There are two main zones. The first is the recent price range of ~2.0480 to ~2.0500. The second is located at a higher peak, around ~2.0650 to ~2.0690.
Significance: The first zone is where the price might have a minor reaction and continue to correct toward the BUY ZONE. The second zone is the target for a long trade, where potential sell orders are placed.
Detailed Trading Plan
Primary Scenario (Long Trade):
Entry: Wait for the price to pull back to the BUY ZONE (~2.0420 - 2.0440).
Reasoning: This is a strong Order Block zone where the price has already shown signs of a buy reaction (confirmed by the positive Delta on the Footprint).
Take Profit:
TP1: The nearest high (~2.0550).
TP2: The higher SELL ZONE (~2.0650 - 2.0690).
Stop Loss: Place it below the nearest low (below the BUY ZONE), around ~2.0390, for risk management.
Secondary Scenario (Short-Term Short Trade):
Strategy: A short-term trade, against the main trend.
Entry: Consider a short-term sell trade if the price reacts to the lower SELL ZONE (~2.0480 - 2.0500).
Reasoning: This zone could act as temporary resistance, pushing the price down to fill the BUY ZONE.
Take Profit: The BUY ZONE (~2.0420).
Stop Loss: Place it above the SELL ZONE, around ~2.0520.
Conclusion:
The combination of SMC and Footprint analysis shows that GBPAUD is in a strong uptrend, and the current downward phase is a healthy correction. The Footprint has confirmed the return of buying pressure, which reinforces the primary trading plan to wait for a buy entry at the strong Order Block zone.

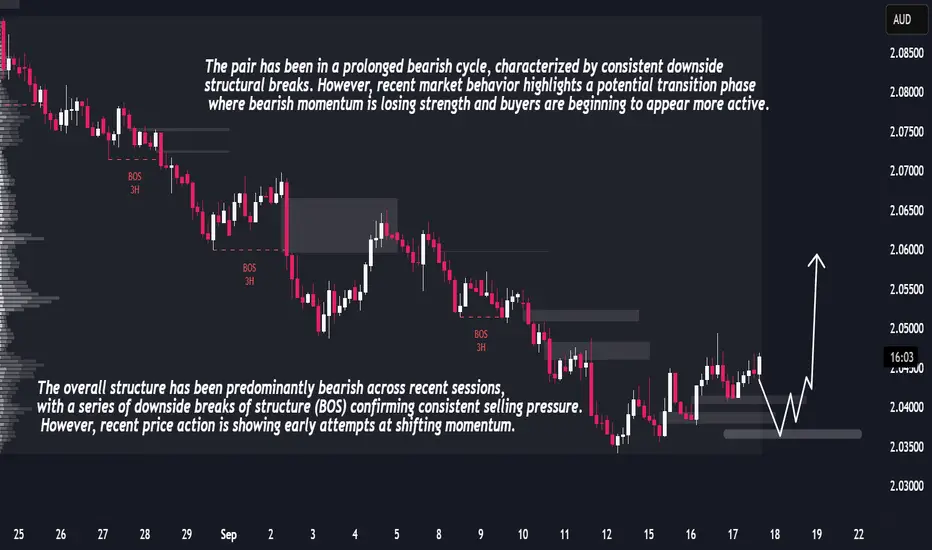
GBPAUD Forecast – Liquidity Sweep Before Strong Upside RallyGBPAUD has been moving through an extended bearish cycle, confirmed by multiple downside breaks of structure that signaled strong sell-side control. Each leg cleared liquidity and left inefficiencies behind, reflecting a market environment dominated by distribution phases. Recently, however, the dynamics are shifting. Price action has begun to compress, with shorter bearish candles and emerging higher lows that point toward weakening seller momentum and the early signs of accumulation.
Order flow analysis suggests that institutional participants may be absorbing positions within the current range. The market appears poised to engineer a downward liquidity sweep to trigger weak longs and attract late sellers before reversing upward. This type of behavior is typical of smart money accumulation phases, where liquidity is harvested before expansion.
Volume and volatility add weight to this narrative. Downside moves are losing strength, showing seller exhaustion, while volatility has contracted, signaling the market is coiling energy for a breakout. Given the structural setup and liquidity positioning, the probability favors a bullish expansion following a brief dip.
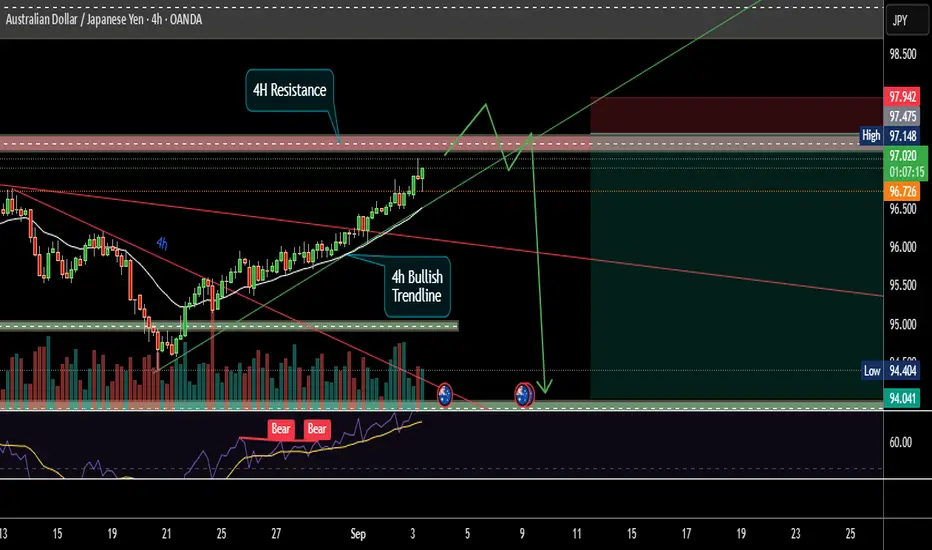
A beautiful AUDCHF high RnR scenarioAUDCHF is approaching 4H resistance zone which has already show rejection previously. There is also a steep bullish trend line creating a confluence. RSI has already shown Bearish Divergence. All these signaling a coming very good sell side opportunity. Below are points detailing the same.
1. Price is approaching 4H resistance zone. Which may act as a strong supply zone.
2. Very steep Bullish Trend line developing a confluence at resistance. Steep trend line are always prone for breakout/breakdown.
3. Most probably price will take liquidity of resistance zone and break trend line.
4. After breaking trend line it should pullback till resistance/trend line or any newly created OB/FVG.
5. RSI also already shown Bearish Divergence and running in oversold zone.
All these combinations are signaling a high probability and high Risk and Reward (1:8) trade scenario.
Note – if you liked this analysis, please boost the idea so that other can also get benefit of it. Also follow me for notification for incoming ideas.
Also Feel free to comment if you have any input to share.
Disclaimer – This analysis is just for education purpose not any trading suggestion. Please take the trade at your own risk and with the discussion with your financial advisor.
AUDJPY SHORTSAUDJPY – Short Setup Idea
Bulls are clearly showing weakness — just look at the 4H chart on the right. The climb has been slow and corrective, suggesting a lack of strong momentum to the upside.
Price has recently reached into a 4H supply zone. At first glance, it looked as though the zone was invalidated, but on closer analysis, the move primarily mitigated a past price void/imbalance. For that reason, I still consider the short setup valid.
I am looking for a potential swing opportunity to the downside. My stop-loss is placed above the most recent significant 15-minute high, as a break of that level would invalidate the idea and I would no longer want to be in the trade.
15min Flip did happen.
This setup offers favorable risk-to-reward potential if price respects the supply zone and continues lower.

AUDJPY – High Probability Short Setup (15M)
📊 Market Insight:
AUDJPY has broken intraday structure and is now retracing into the 95.44 – 95.60 supply zone. This level is key for potential downside continuation.
🔑 Setup Details:
Supply Zone: 95.44 – 95.60
Entry Zone: 95.40 – 95.55 (confirmation required)
Targets:
TP1: 95.00
TP2: 94.85 – 94.90
Stop Loss: Above 95.60
🎯 Trading Approach:
I look for rejection or bearish confirmation candles before entering. Strict stop-loss placement and structured exits ensure controlled exposure, a must in fund management.
⚖️ Risk Management Philosophy:
Every trade is positioned with calculated risk allocation to safeguard client capital while compounding returns. Consistency and discipline form the backbone of my strategy.
📩 For Managed Accounts & Professional Trading Guidance
insta@ the_sohailarhaan

AUDJPY SELLSCurrent price action is bearish, with downside momentum confirming bearish order flow. Before considering shorts, I reviewed where price previously pushed higher and identified a key daily demand zone — an unmitigated wick that sparked the last major bullish move. This is important context: even though the 4H structure is bearish, bulls could still step in with enough volume to break supply.
I unfortunately missed the long entry at that demand zone, which would have been an ideal trap for a win–win scenario. For now, I’ve marked the nearest supply zone. Price just missed tapping into it, so I’ll patiently wait for when it taps. And then I’ll look for confirmation to enter shorts if the opportunity sets up.

AUD/JPY SHORT Standard Deviation Projection TargetsThis analysis forcasts a current SHORT trade in AUD/JPY , with Standard Deviation targets + OTE model aliginging with PD Arrays.
1. SD Target 1 - 95.170
2. SD Target 2 - 94.085
Share your thoughts on this!
Follow for more!

AUDNZD Buy or Sell? AUDNZD tapped into the 4H Supply zone I’ve been monitoring for some time. On Friday, we also saw a bearish structure flip on the 15-minute timeframe — a potential signal that price may break the current demand zone and shift structure to the downside.
I didn't take any positions on Friday, but going into this week, my focus will be on the 4H Demand Zone for possible long opportunities. I’ll be watching how price reacts there — if we get bullish confirmation, I’ll consider a long setup.
For now, shorts don’t offer a favorable R:R, so I’ll remain on the sidelines unless demand breaks. If that happens, I’ll take the same approach, watching for clean structure and new entry zones.
Patience until the market reveals what it wants to do next.

EURAUDEURAUD is showing similar behavior to other EUR pairs — strong bullish move with a break in structure. Now just waiting for a retracement back down into the 4H demand zone before looking for long opportunities.
Would like to see price come into that zone, react, and show signs of strength again before considering buys. Just being patient and letting the setup come to me.

BUY IDEA EURAUD Looking to buy EURAUD after pull back expecting bulls to continue pushing the market higher.

EUR/AUD Bullish Channel Trade Setup –Demand Zone Bounce Strategy📉 1. Downtrend Ends
🔽 Price was falling earlier (left side of chart)
🔄 Then it reversed at the bottom of the channel (yellow dot)
➡️ Trend Change Begins
📈 2. Uptrend Channel Forms
📊 Channel consists of:
🔵 Resistance Line (upper blue)
🟢 Support Line (lower blue)
🔁 Price is bouncing between these two lines like a pinball:
🔵 Resistance Line
| 🔼
🟢 Support Line
💠 3. Key Trading Zone
🔷 DEMAND ZONE: (Bright blue box)
🟦 Between 1.74697 and 1.75349
👉 Buyer interest expected here
🎯 4. Trade Setup (Bullish Idea)
🟢 Entry Point:
📍 1.75349
✨ Near support zone and channel bottom
🔻 Stop Loss:
🚫 1.74710
📉 Below the demand zone, protects from downside
🎯 Target Point:
🎯 1.77800
📈 Near the resistance line at the top of the channel
📊 Strategy Flow (Emoji Dots Path)
📉 🔽 🔽 🔽
🟡 Bottom found
⬆️ 🔼 🔼 🔼
📈 Enters channel
🟦 Price enters DEMAND ZONE
🔽
🔵 Entry: 1.75349
🔼
🎯 Target: 1.77800
✅ Final Thoughts
This is a clean bullish setup within a rising channel
✅ Wait for price action confirmation (like a bullish candle 🕯️) in the demand zone
🔒 Protect with your stop loss
🚀 Potential reward is strong if it bounces up

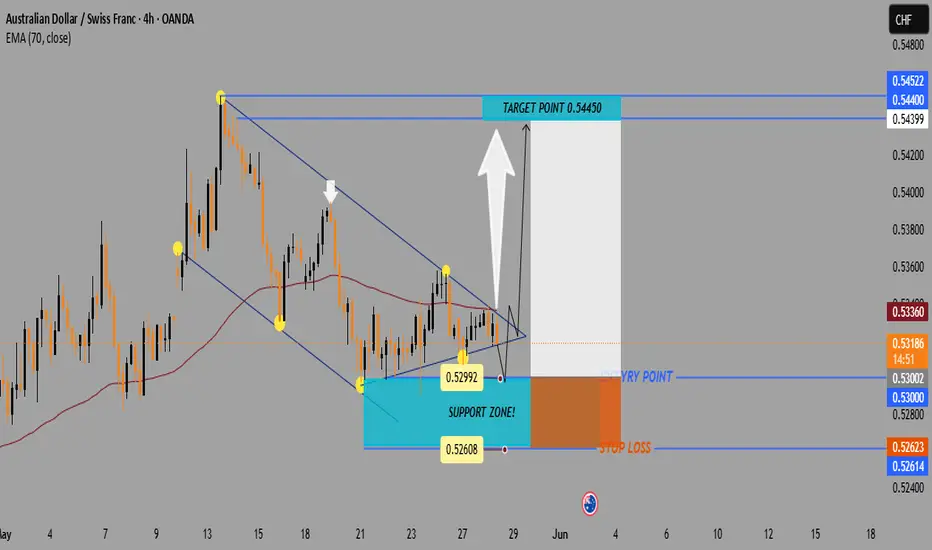
AUD/CHF Breakout Alert: Bullish Setup from Descending Wedge!🔻 Pattern: Descending Wedge
📐 Formed by lower highs and higher lows.
🟡 Indicates price compression — often a bullish breakout setup!
🔼 Breakout direction expected: UP
🟦 Support Zone
📍 Located around 0.52614 – 0.53000
📉 Price bounced multiple times here — strong buying interest
🛡️ Acts as a demand zone
🟢 Entry Point
🎯 Entry range: 0.53000 – 0.53188
💥 Breakout candle appears ready to close outside the wedge
⚡ Momentum may be building for a push higher
🎯 Target Point
🔵 Target: 0.54450
📈 Near recent highs — aligns with pattern breakout projection
🎉 Aiming for a good profit zone
🔴 Stop Loss
❌ Stop loss: 0.52623
🛑 Below the wedge and support — protects from a false breakout
⚖️ Keeps risk-reward ratio attractive
📊 Indicator
🧭 EMA 70 (Red Line) at 0.53360
🔄 Price hovering near it — crossing above = bullish signal
📌 Trade Setup Summary
🔸 Pair: AUD/CHF
🔸 Timeframe: 4-Hour (4H)
🔸 Pattern: Descending Wedge
🔸 Bias: Bullish
🔸 Entry: 0.53000 – 0.53188
🔸 Target: 0.54450 🟢
🔸 Stop Loss: 0.52623 🔴
✅ Conclusion
🚀 If price breaks above the wedge and EMA, this could be a high-probability long trade.
📏 Tight stop, wide target = good risk/reward setup!
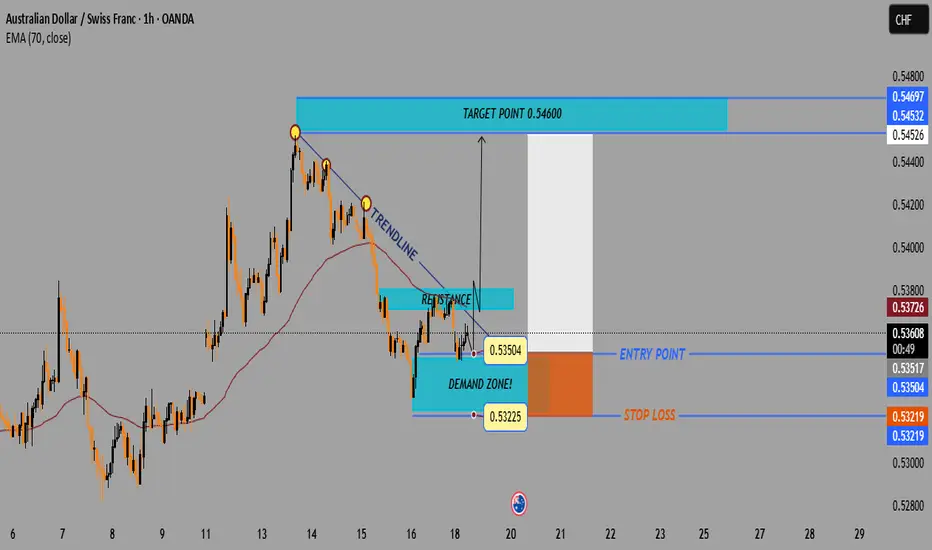
AUD/CHF Bullish Breakout Setup – Demand Zone to Target 0.546001. Setup Overview
📈 Trade Type: Long (Buy)
📊 Chart Pattern: Trendline Breakout
📏 Indicator Used: EMA (70) — 🔴 0.53726
2. Key Price Levels
🔵 Demand Zone:
* 0.53225 – 0.53504
* Strong buying interest seen here
⬆️ Entry Point:
* Around 0.53517 – 0.53630
* Price is breaking above resistance and trendline
🛑 Stop Loss:
* Below 0.53219
* Protects against false breakout
🎯 Target Point:
* Primary TP: 0.54600
* Extended TP: 0.54697
* Previous supply/resistance zone
3. Structure Breakdown
📉 Trendline:
* Downward sloping trendline has been tested
* Price looks to be breaking out
📌 Resistance Turned Support:
* Break above 0.53500 confirms bullish momentum
📊 EMA (70):
* Current price is slightly below EMA
* Bullish confirmation if price closes above it
4. Risk-to-Reward
⚖️ R:R Ratio: Approximately 1:3
* Small stop loss for a much larger upside
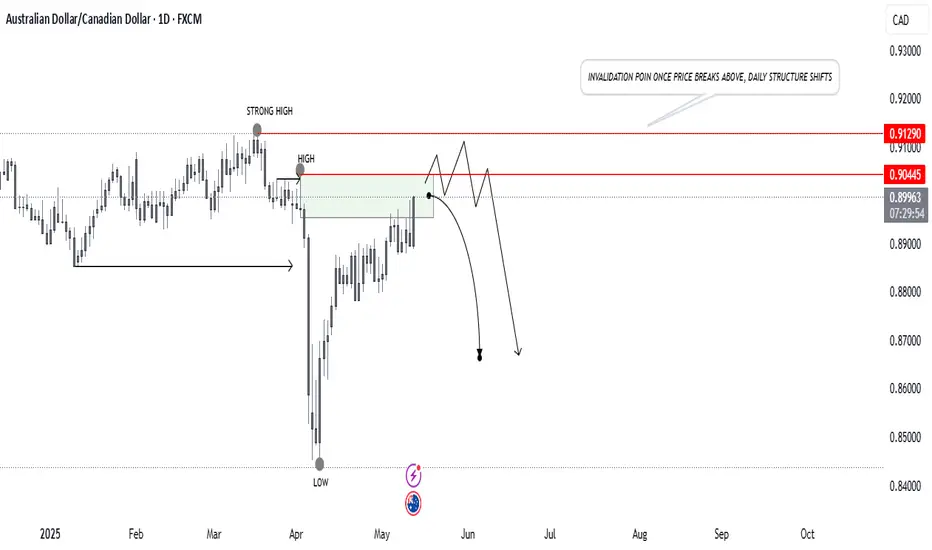
AUDCAD SELLSAs we can see on the daily timeframe, this looks like a promising setup for potential shorts. The price is currently trading high in the overall market structure and is sitting within the sell zone. While the 4H chart still shows bullish momentum, I’ll personally be watching for possible structure shifts on the 15-minute timeframe to confirm short entries.
I've marked two significant highs — both are valid targets. However, it's possible that price may push higher to take out the first high (liquidity grab) before a potential reversal. I'm leaning toward shorts, as this aligns with the higher timeframe trend.
If price action becomes strange, I’ll simply observe and stay out. No need to force anything but today possible high of the week can happen, or tomorrow. Let’s see how it unfolds in the coming days.
EURAUD BUYSAs you can see, the price is approaching the daily demand zone — our potential buy area. The green box marks the zone where inefficiency is filled, as well as the last candle before a strong upward move. We also have the 1.72000 level, a round number that can naturally attract price action due to institutional orders and interest.
The grey circles highlight the low and high of my daily trading range. What I like about the current price action is the impulsive move to the upside, followed by a steady and controlled pullback as the price approaches the buy zone.
This setup presents a strong trading opportunity — now we wait and see.

AUDNZD 2H Chart Analysis – Trendline Break + Supply Zone Rejecti🧾 Market Context:
Pair: AUDNZD
Timeframe: 2H (2-Hour)
Overall Bias: Bearish
Setup Type: Trendline Break → Lower High Formation → Supply Zone Retest → Bearish Continuation
📊 Technical Breakdown:
🔸 1. Trendline Break:
A steep ascending trendline has been broken decisively, marking a clear end of bullish structure.
This shift indicates that buyers have lost control and bears are stepping in.
🔸 2. Retest of Supply Zone (Breaker Block):
After breaking the trendline, price retraced into a supply zone (highlighted in grey).
This zone also acts as a breaker block – price broke support, and now it’s acting as resistance.
Rejection from this area confirms institutional selling pressure.
🔸 3. Lower High Formation:
The price failed to break back above the supply zone, forming a lower high, which is a classic bearish market structure signal.
Trendline retest + supply zone rejection together give confluence.
🔸 4. Bearish Projection Path:
Your chart outlines a clear path of expected price movement:
Minor bounce from intermediate demand (1.0780–1.0790)
Continuation downward toward final target zone at 1.0650–1.0660
🔽 Entry & Trade Plan:
Parameter Details
Entry Area 1.0820 – 1.0840 (confirmed rejection)
Stop Loss Above 1.0855 (above the supply zone high)
Target 1 1.0770 – 1.0780 (intermediate demand zone)
Target 2 1.0650 – 1.0660 (major demand zone)
RR Ratio Around 1:3 to 1:4 depending on entry
✅ Bearish Confluences:
✅ Trendline break + retest
✅ Supply zone rejection
✅ Lower high formation
✅ Bearish engulfing candle post-retest
✅ Clear break of structure (BOS)
✅ Liquidity sweep above previous high before dumping
⚠️ Invalidation Criteria:
If price closes above 1.0855 on a 2H/4H candle, it invalidates the bearish setup.
In that case, reanalyze for potential continuation or false breakout.
📈 Visualization Path:
🔹 Current price is consolidating slightly below the retest zone.
🔹 You anticipate a drop to intermediate support, possible small bounce, then continuation to major target.
🧠 Professional Summary:
This is a textbook bearish trend reversal setup:
Break of bullish trendline
Supply zone retest and rejection
Structure shift to lower lows/lower highs
Bearish order flow developing
If momentum follows through, your TP at 1.0650 is very realistic.

AUDJPY market trend is bullish and now it's above the high4h market trend is bullish
audjpy is taking a retest in 4h ?
can we trade in buy side shift of structre ?

"EUR/AUD Bearish Channel with Key Support Ahead"📉 Market Structure Analysis (Bearish Bias)
Current Trend:
The pair is trading within a well-defined descending channel, indicating a bearish trend. Price action is forming lower highs and lower lows, adhering to the channel boundaries.
Moving Averages (EMA):
EMA 50 (Red) at 1.77491 is above the price, acting as dynamic resistance.
EMA 200 (Blue) at 1.73338 is close to current price, likely to act as a support area in the short term.
The bearish crossover between the 50 EMA and current price supports the continuation of downward momentum.
🔍 Key Zones:
Weak Resistance Zone:
Located around 1.7740 – 1.8000, previously a support area, now acting as resistance.
Price rejection from this zone multiple times indicates sellers' strength.
Support Zone:
Located around 1.6950 – 1.7100, where demand may return.
This zone coincides with the lower boundary of the descending channel, making it a likely reaction zone.
📊 Forecast / Expectation:
The chart projects a bear flag / corrective pullback before another leg downward toward the support zone.
If price breaks and sustains below the EMA 200, it will likely accelerate bearish pressure.
The descending channel suggests potential continuation to the downside unless price breaks out of the upper boundary with momentum.
✅ Trade Implications:
Bearish Setup:
Look for short opportunities on intraday pullbacks near the resistance or EMA 50.
Bullish Invalidations:
A breakout above the descending channel and sustained move above 1.7800 would invalidate the bearish outlook.
Conclusion:
This chart presents a technically clean bearish setup. The confluence of a descending channel, EMA rejection, and defined resistance/support zones suggests the EUR/AUD may continue lower, especially if it loses the 1.7300 level decisively.

EURAUD Short Setup – Bearish Breakdown & Retest of Key Structure📋 Pair: EURAUD
Timeframe: 4-Hour
Bias: Bearish
Strategy Type: Supply & Demand + Trendline Break + BOS (Break of Structure) + Retest Confirmation
🧠 Market Structure Analysis:
Price has formed a series of lower highs and lower lows, confirming a bearish trend on the 4H chart.
A clean descending trendline has been respected multiple times, adding confluence to the bearish pressure.
Recently, price broke below a strong horizontal support zone (~1.7580), which had acted as a demand area multiple times in the past.
After the breakdown, price pulled back to retest this previous support as resistance, perfectly tapping into a supply zone before rejecting.
🧱 Key Zones:
Supply (Resistance): 1.7580 – 1.7674
Entry Zone (Trigger): Inside rejection candle from supply
Target Demand (Support): 1.7100 – 1.7120 (clean untested demand + price imbalance)
🎯 Trade Plan:
Entry: 1.7570 (after confirmation of rejection from supply)
Stop Loss: 1.7680 (above the supply zone + trendline)
Take Profit 1: 1.7350 (minor structure)
Take Profit 2: 1.7120 (major untested demand zone)
Optional TP3: 1.7099 (full imbalance fill)
⚖️ Risk-to-Reward (R:R):
TP1: ~1:2
TP2: ~1:4
TP3: ~1:5+
✅ Confluences Supporting the Setup:
✅ Break and Retest of major 4H support (turned resistance).
✅ Bearish trendline acting as dynamic resistance.
✅ Liquidity sweep before rejection (stop hunt above minor highs).
✅ Bearish candle confirmation from retest zone.
✅ Target aligns with clean demand + imbalance, likely to attract buyers.
⚠️ Invalidation Criteria:
If price breaks and holds above 1.7680, structure is invalidated.
Watch out for fakeouts around FOMC or major AUD/Euro news.
💡 Pro Tip (Optional):
You can scale in on lower timeframes (15M–1H) after a CHoCH (change of character) within the retest zone for tighter entries and smaller stops.
Disclaimer: This analysis is for educational purposes only and not financial advice. Manage your risk wisely.

EURAUD EYES A REBOUND - CAN THE BULLS HOLD THE SUPPORT?Symbol - EURAUD
Amid a broader global bullish trend, the EURAUD pair is currently undergoing a corrective phase, approaching the support zone of the established trading range. Market participants are observing efforts by buyers to defend the 1.7750 level.
The pair remains within a broad consolidation range. Price action near the lower boundary has exhibited signs of a false breakout and subsequent liquidity absorption, which could potentially trigger a rebound toward the midpoint of the range or even a move toward the upper resistance levels.
Sustained consolidation above the 1.7750 mark, coupled with the emergence of a local reversal pattern, may serve as a catalyst for renewed upward momentum. While the overarching trend remains bullish, the current move reflects a local correction. Fundamentally, conditions remain uncertain. However, the US Dollar Index continues to correct after a recent sharp decline.
Key Resistance Levels: 1.7855, 1.7987
Key Support Levels: 1.7750, 1.7695
Should bullish momentum prevail and price remain above the critical 1.7750 support - marking the lower boundary of the range, there is potential for a rebound targeting liquidity pools situated above resistance levels.

Watch This Wedge! AUDNZD Primed for Upside PushThe AUDNZD pair forms a falling wedge pattern, a bullish reversal formation that typically occurs after a downtrend. The price action is being squeezed between a descending resistance line and a descending support line, creating a narrowing range. The market is now attempting to break out of the wedge, with the current price testing the resistance line. A breakout and close above this trendline would signal bullish strength and could lead to a reversal of the recent downtrend.
Targets:
TP1: 1.07605
TP2: 1.07922
Stop Loss: Below the recent low at 1.06542

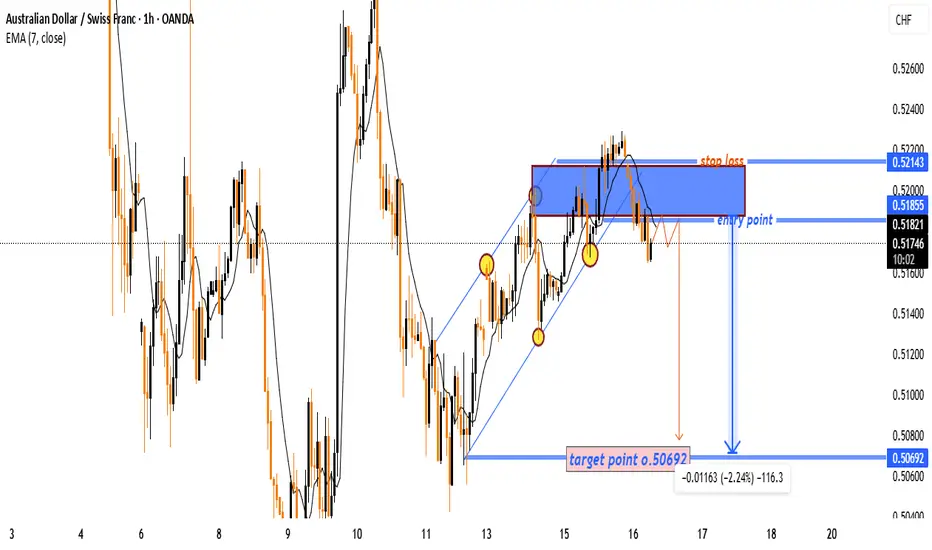
AUD/CHF Bearish Breakout &Retest Setup High Reward Short OprtntyChart Analysis – AUD/CHF (1H)
1. Trend Structure
🔼 Uptrend Channel (before the drop)
* Price was making higher highs and higher lows
* Buyers were in control temporarily
🔽 Bearish Breakout
* Price broke below the channel support
* First sign of weakness from bulls
* EMA (7) crossed and sloped downward – trend shift confirmed.
2. Key Levels
🔵 Entry Point: 0.51855
🟠 Stop Loss: 0.52143
🟢 Target Point: 0.50692
3. Trade Plan
✍️ Setup: Break & Retest Short
🔁 Price came back to retest broken structure (resistance zone – blue box)
❌ Rejection at resistance = confirmation to go short.
4. Emoji-Dot Summary of Strategy
🔵 ● Entry at 0.51855 → After retest of the broken trend
🟥 ● Stop Loss at 0.52143 → Above recent highs (safe buffer)
✅ ● Target at 0.50692 → Next su…