AUD/CHF Breakout Alert: Bullish Setup from Descending Wedge!๐ป Pattern: Descending Wedge
๐ Formed by lower highs and higher lows.
๐ก Indicates price compression โ often a bullish breakout setup!
๐ผ Breakout direction expected: UP
๐ฆ Support Zone
๐ Located around 0.52614 โ 0.53000
๐ Price bounced multiple times here โ strong buying interest
๐ก๏ธ Acts as a demand zone
๐ข Entry Point
๐ฏ Entry range: 0.53000 โ 0.53188
๐ฅ Breakout candle appears ready to close outside the wedge
โก Momentum may be building for a push higher
๐ฏ Target Point
๐ต Target: 0.54450
๐ Near recent highs โ aligns with pattern breakout projection
๐ Aiming for a good profit zone
๐ด Stop Loss
โ Stop loss: 0.52623
๐ Below the wedge and support โ protects from a false breakout
โ๏ธ Keeps risk-reward ratio attractive
๐ Indicator
๐งญ EMA 70 (Red Line) at 0.53360
๐ Price hovering near it โ crossing above = bullish signal
๐ Trade Setup Summary
๐ธ Pair: AUD/CHF
๐ธ Timeframe: 4-Hour (4H)
๐ธ Pattern: Descending Wedge
๐ธ Bias: Bullish
๐ธ Entry: 0.53000 โ 0.53188
๐ธ Target: 0.54450 ๐ข
๐ธ Stop Loss: 0.52623 ๐ด
โ
Conclusion
๐ If price breaks above the wedge and EMA, this could be a high-probability long trade.
๐ Tight stop, wide target = good risk/reward setup!
Audchfbuy
AUD/CHF Bullish Breakout Setup โ Demand Zone to Target 0.546001. Setup Overview
๐ Trade Type: Long (Buy)
๐ Chart Pattern: Trendline Breakout
๐ Indicator Used: EMA (70) โ ๐ด 0.53726
2. Key Price Levels
๐ต Demand Zone:
* 0.53225 โ 0.53504
* Strong buying interest seen here
โฌ๏ธ Entry Point:
* Around 0.53517 โ 0.53630
* Price is breaking above resistance and trendline
๐ Stop Loss:
* Below 0.53219
* Protects against false breakout
๐ฏ Target Point:
* Primary TP: 0.54600
* Extended TP: 0.54697
* Previous supply/resistance zone
3. Structure Breakdown
๐ Trendline:
* Downward sloping trendline has been tested
* Price looks to be breaking out
๐ Resistance Turned Support:
* Break above 0.53500 confirms bullish momentum
๐ EMA (70):
* Current price is slightly below EMA
* Bullish confirmation if price closes above it
4. Risk-to-Reward
โ๏ธ R:R Ratio: Approximately 1:3
* Small stop loss for a much larger upside
AUDCHFFX:AUDCHF
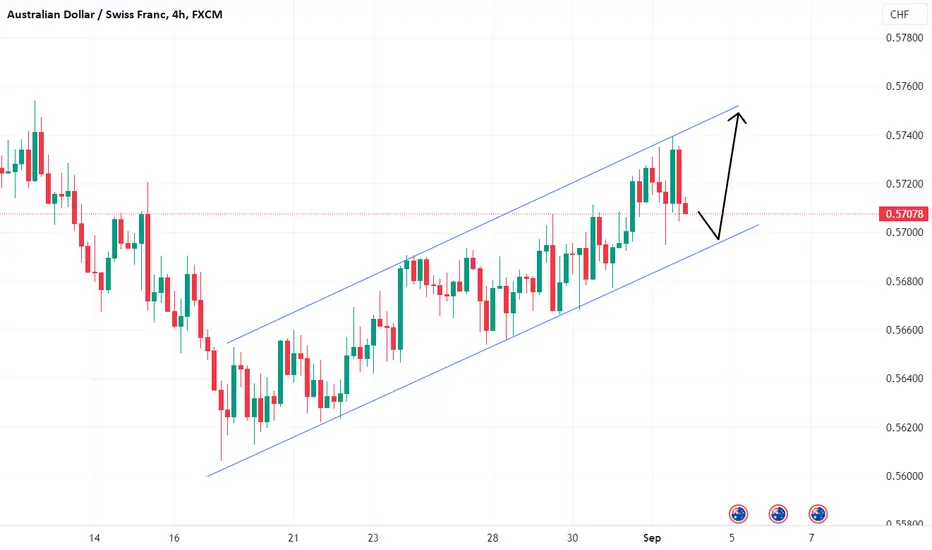
As you can see that, AUDCHF Has created a Channel Pattern in 4Hr Time Frame and buy when it touches the drawn support level with a good rejection candle or creates hammer candle, If it breaks the support level then we can plan for sell side. This set-up is for monday (04-09-2023), Plan your trade accordingly....