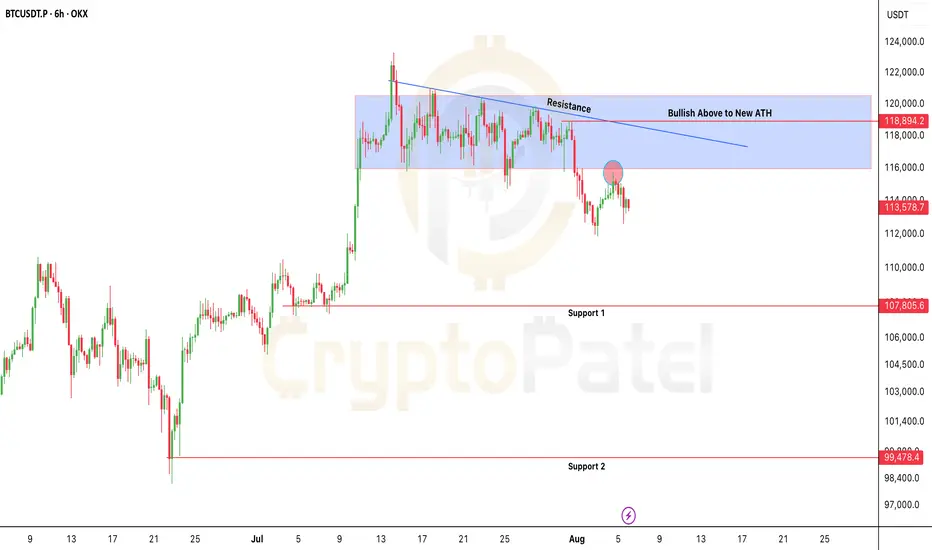
Bitcoin at Risk: $115.7K Is the Line Between Bounce or BreakdownBitcoin at Risk: $115.7K Is the Line Between Bounce or Breakdown
CRYPTOCAP:BTC is trading below key resistance ($115.7K–$118.9K) and rejected cleanly at the trendline.
As long as price holds below $115,700, bearish bias remains.
⚠️ Failure to reclaim = high risk of breakdown toward $107K and even sub-$100K levels.
Bearish invalidation only above $119K
NFA & DYOR
Bearish Patterns
Urgent Bitcoin Update: BTC Must Hold $110K🚨 Urgent Bitcoin Update: BTC Must Hold $110K – Or Risk Dropping Below $100K
BTC is trading near $113,900, sitting right on key support at $112K–$110K.
This zone is crucial- Holding it could lead to a rally toward $150K ATH.
But if BTC breaks below $110K, expect downside pressure with possible moves to: $100K / $93K / $83K
Price has also broken below the ascending trendline- a bearish sign unless bulls step in.
I mentioned exiting around $122K–$123K: Hope you booked profits ✅
Now, just observe how BTC reacts between $110K–$112K.
Note: NFA & DYOR

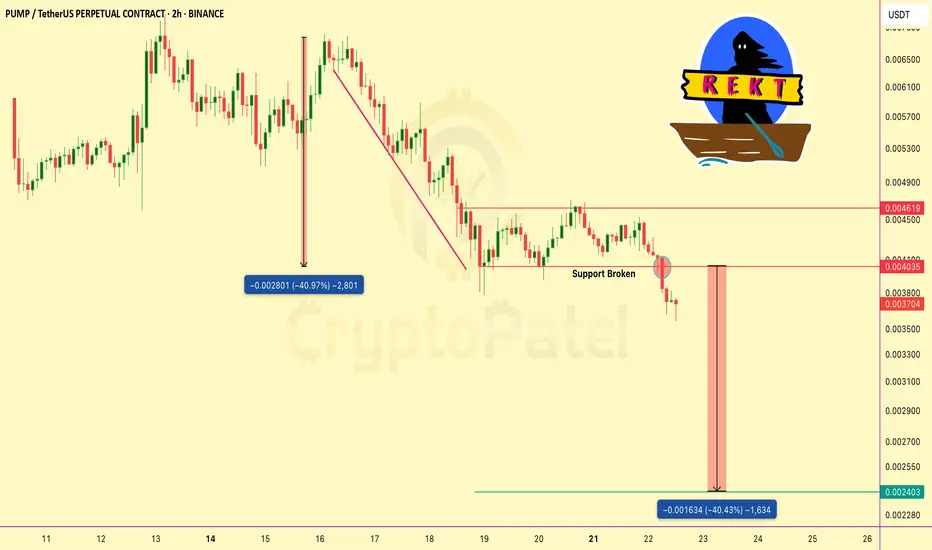
PUMP just lost a major support level—is another 40% drop coming?Caution: PUMP just lost a major support level — is another 40% drop coming?
The chart shows a clear breakdown in structure after price lost key support at 0.004035.
That level acted as a strong base during the recent consolidation, but once broken, it triggered strong selling pressure.
Retest Failed:
Price attempted to reclaim the support zone but faced rejection and a bearish retest, confirming the breakdown.
Previous Drop:
🔸 We already saw a major drop of nearly 50% earlier.
🔸 Now, the projected move suggests a similar drop is likely, targeting the 0.0024 zone and a possible liquidity pool and demand area.
Bias:
🔸 Momentum remains bearish below 0.004035.
🔸 Unless price reclaims and holds above that level, the structure favors downside continuation.
Keep managing your risk. Avoid chasing entries blindly. More updates soon.
NFa & DYOR
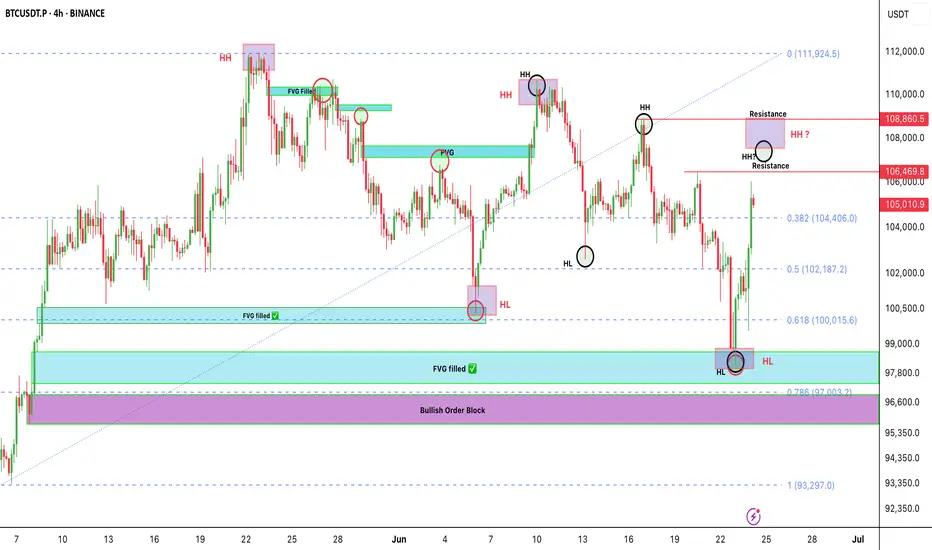
Bitcoin isn’t fully bullish yet — most people are falling for thBitcoin isn’t fully bullish yet — most people are falling for the trap
BTC just bounced beautifully from the $97.8K–$98K demand zone.
It tapped into key confluences:
✅ FVG filled
✅ 0.618-0.786 Fib level
🟪 Bullish Order Block just above 0.786
But let’s be real — we’re not in full bullish mode yet.
This looks more like a short-term pullback, not a trend reversal.
What I'm Watching Closely:
🔹 BTC is forming two HH & HL patterns.
🔹 Super important for us to track both — they’ll guide the next big move.
🟥 LTF last HH = $108,900
🟥 HTF last HH = $110,654
As long as BTC stays below these, the structure is still bearish.
We only flip bullish when candles break and close above them.
If Bullish Breakout happens? We’re eyeing new ATH targets toward $150K 🚀
My Plan Right Now:
🔹 Watching $107K & $109K levels for clean short setups.
Why?
👉 Low-risk entries
👉 Tight SL
👉 Big reward — Targeting around $100K
Stay alert, don’t chase. Let the levels come to us.
Let me know in the comments 👇 Are you flipping bullish, or still cautious?
NFA & DYOR
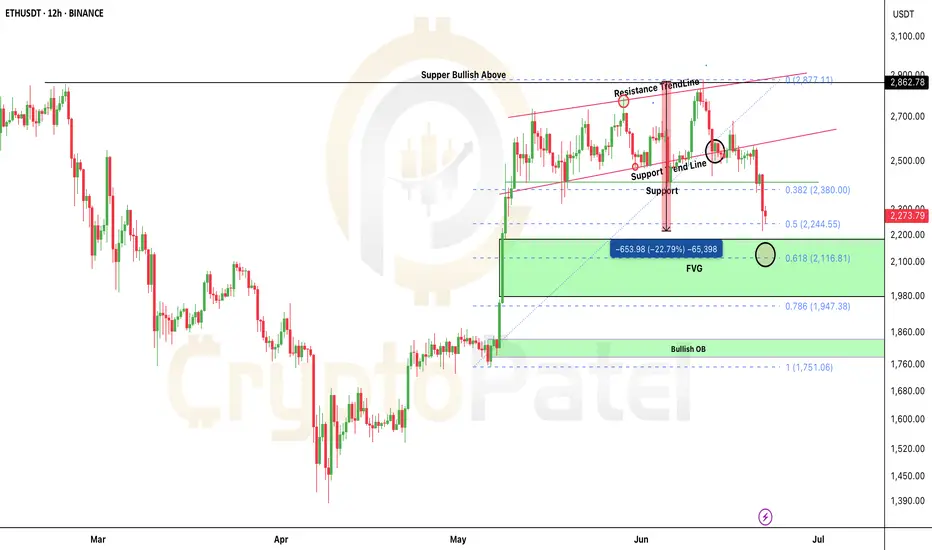
ETH/USDT Dumped hard as I predicted and next Target?ETH SHORT HIT — As Predicted!
Hey fam
Hope you enjoyed the ETH short setup I shared earlier when price was around $2700–$2800
ETH is now down 22% from that level.
Broke support just like we discussed…
And remember I said — if $2500 breaks, we could see $2200.
Well… we’re already there now ✅
What Now?
This is where we start accumulating on spot.
Why?
Because ETH is currently at the 0.5 Fib level — could hold.
If not, we target 0.618 Fib for next entry.
Best Accumulation Zone: $2200–$1800
Strong bullish OB around $1782–$1840
If price drops there, expect a solid bounce!
I’m personally watching this zone for spot entries targeting $8000–$10,000 next run 🚀
Let me know below if you're buying this dip!
And as always… stay tuned for the next sniper setup.
NFA & DYOR
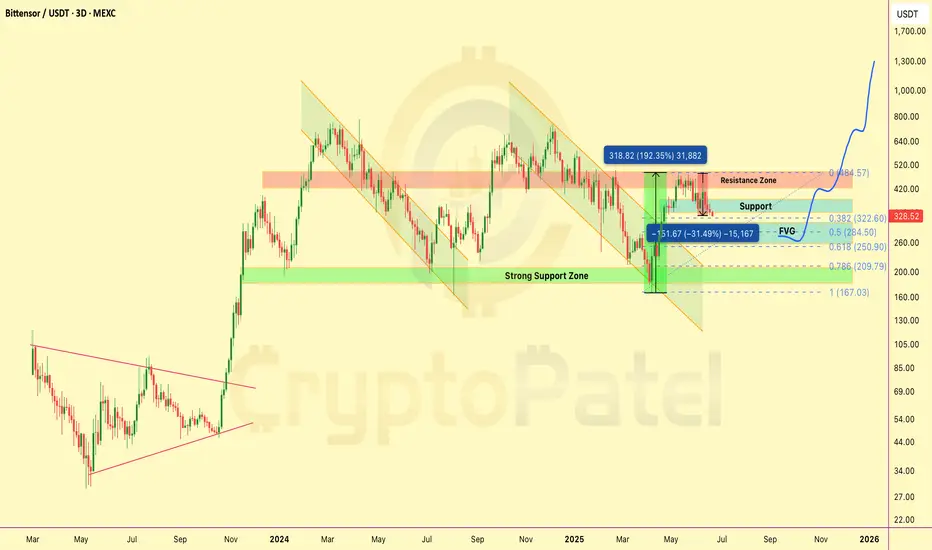
$TAO dumped 30% — and we called it at the topLSE:TAO dumped 30% — and we called it at the top.
We gave the exit at $480.
Now it’s trading near $329. Hope you booked profits or caught that juicy short.
But it’s not over yet 👇
➡️ $350 support broken
➡️ Key zone: $300–$250
➡️ Why? That’s where FVG, 0.5, and 0.618 Fib align.
I’m watching $250 for fresh entries.
Long-term vision? Still see $2k- $3k on the horizon.
Big dips = Big setups.
#TAO #Bittensor NFA & DYOR
Bitcoin Bulls vs Bears — Battle Zones Mapped Out#Bitcoin Bulls vs Bears — Battle Zones Mapped Out
🔰 $105K–$106.7K = Bearish Order Block:
Below this zone = CRYPTOCAP:BTC stays bearish unless HTF closes above $106.7K
🔰 Next Moves:
▪️ Likely retest $105K–$106K before next leg ↓
▪️ Target: $97K–$95K zone
🔰 Key Levels:
✅ Holding 0.618 Fib (support)
✅ Unfilled FVG: $97K–$98.3K
✅ Bullish OBs: $95.7K–$97K | $93.5K–$94.7K
If $97,000 holds strong → Expect BIG bounce!

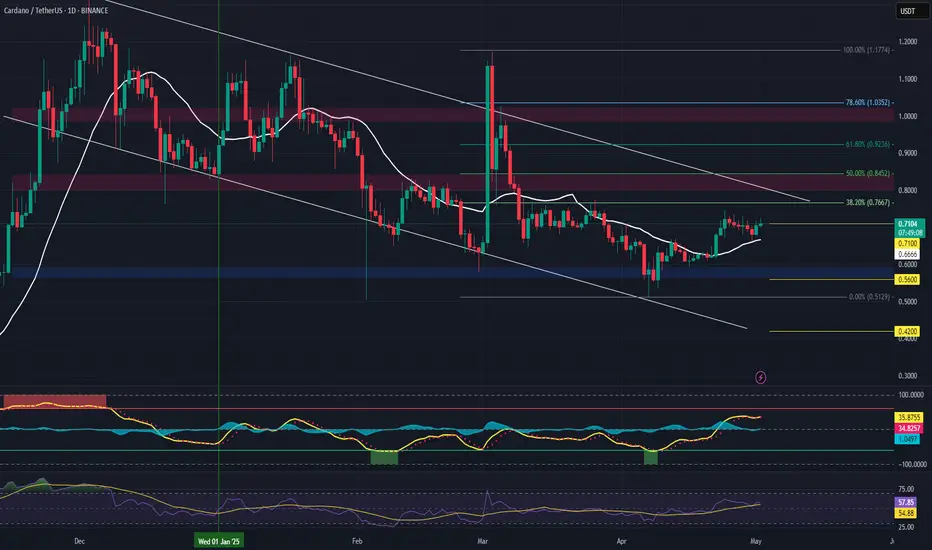
ADA (Cardano) Short Setup – Rejection from Major ResistanceADA is approaching a key resistance zone around the $0.84 level, which aligns with the 50% Fibonacci retracement and yearly open, showing signs of buyer exhaustion and weak momentum.
🔹 Entry:
$0.84 zone (watch for rejection w/ bearish confirmation candle or failed breakout)
🎯 Take Profit Targets:
🥇 $0.71
🥈 $0.56
🥉 $0.42
🛑 Stop Loss:
$0.92 (above key resistance/invalidates setup)
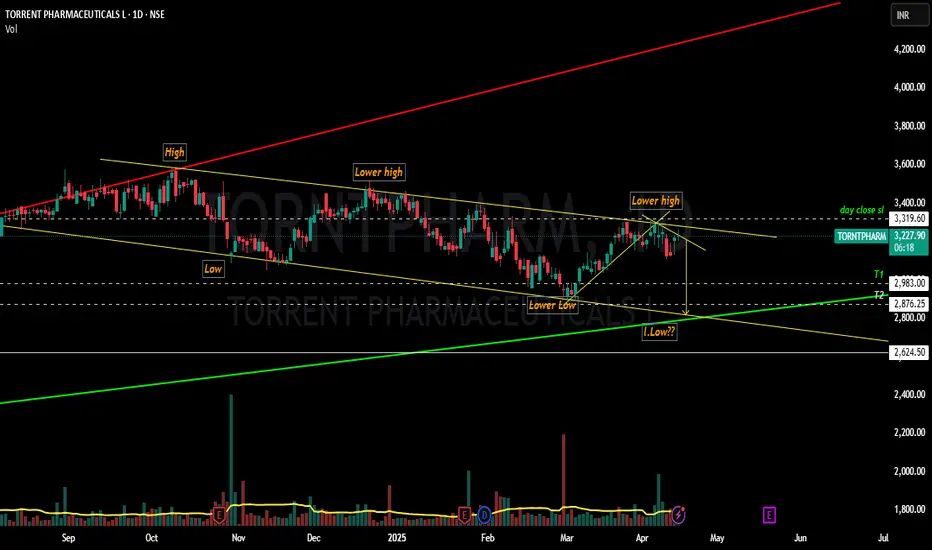
TORNTPHARM Final Bearish move before bulls entry????Yesssss!!!! Chart patterns suggest me the above titled opinion...
TORNTPHARM has been travelling in a Ascending Expanding channel pattern IN A BULLISH MODE MAKING SERIES OF HIGHER HIGHS AND HIGHER LOWS... (shown below)
Inside the bullish pattern , it is now currently in the downward phase that too inside rectangular descending channel pattern making a SERIES OF LOWER HIGHS AND LOWER LOWS....
It's moving like a written script till now....let's wait and watch whether the director(market) has any twist in the script or not!!!
This is just my opinion....not a tip nor advice!!!!
Thank you!!!!!!!
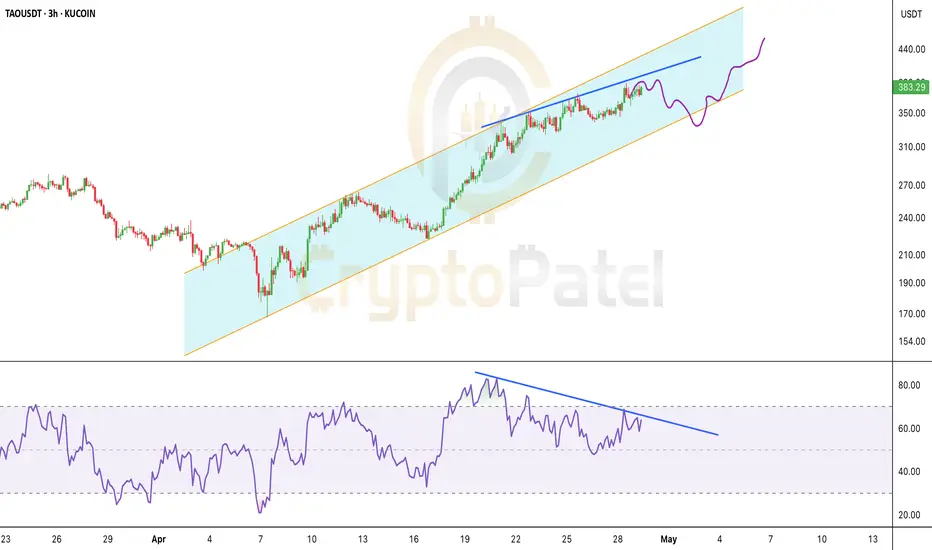
Risk-Managed $TAO Short Setup: Precision Entry Inside FVG ZoneRisk-Managed GETTEX:TAO Short Setup: Precision Entry Inside FVG Zone
▶️ Entry: $384–$395
▶️ Targets: $350 / $330 / $300
▶️ SL: $410
Reason: Bearish Divergence + FVG spotted on LTF.
Perfect for risk-managed apes. Don’t sleep on it.
Will Bitcoin Test $65000 level soon ?🚨 #BTC/USDT SMC Update and Fresh Analysis 🚨
Our previous short setup played out perfectly with a solid -21% move from the $94,000 region, catching the local top and dumping all the way to $75,000.
What’s next?
From a Smart Money Concepts (SMC) perspective, current PA suggests another local top might be in.
🔹 Bearish Order Block just got tapped
🔹 Strong Resistance seen near the $86,000 level
🔹 Price forming LL (Lower Low) and LH (Lower High) structure
If this setup plays again, we may see a new low below $75,000.
Key Level to Watch:
If a HTF candle closes above $88,200, the short thesis is invalidated — and in that case, we may be looking at a bullish continuation toward the $100,000 zone.
Reminder:
Don’t enter blindly. Wait for confirmations and respect risk management—protect your capital at all costs.

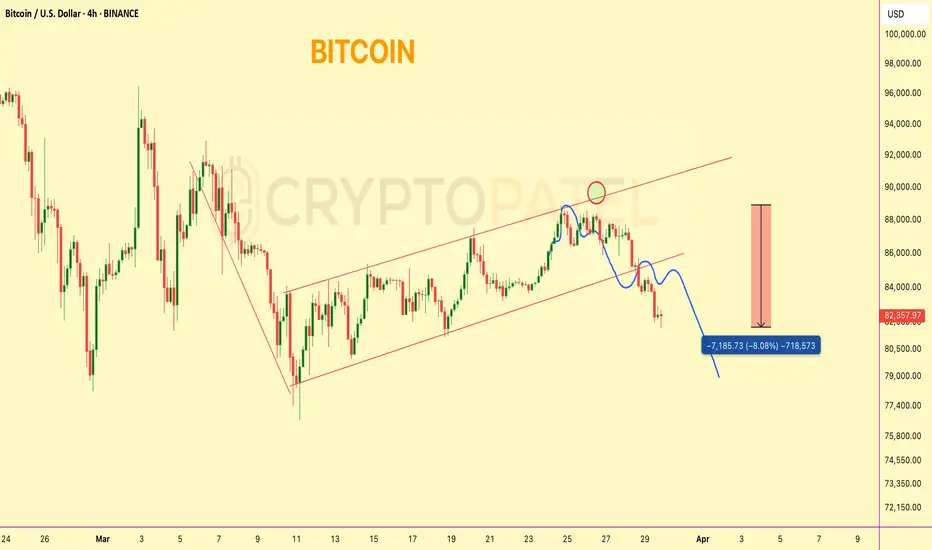
Bitcoin Dumped from our Entry levels and now 8% down#Bitcoin Bearish Flag Update
Price rejected perfectly from $89,000 resistance — our short setup played out with a solid -8% move.
Currently trading around key support at $82,000.
Trend Bias: Bearish below $85,700
Next major support: $75,000–$70,000 zone
Structure still favors further downside unless $85.7K is reclaimed.
Will Ethereum Drop below $1000 or Hit $10,000 in This Bull Run?One Golden Rule in Trading: Always buy the dip on fundamentally strong projects with 5x–10x potential in the near future.
Patience + conviction = profits.
#Ethereum CRYPTOCAP:ETH

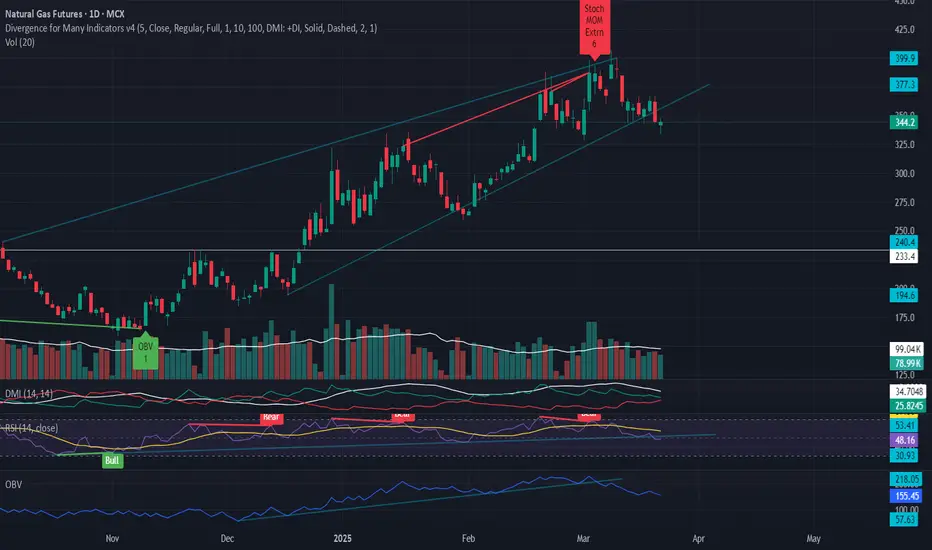
Natural Gas Breakdown from the rising trend lineNatural Gas Breakdown from the rising trend line After making high of 408. Natural Gas in reversing downwards and breaking down from the rising trend line with strong volume and
RSI,OBV also breaking down from the rising trend line. which shows strong downtrend
Entry Price < 333.00
Target @ 236.00
Stoploss @ 366.00
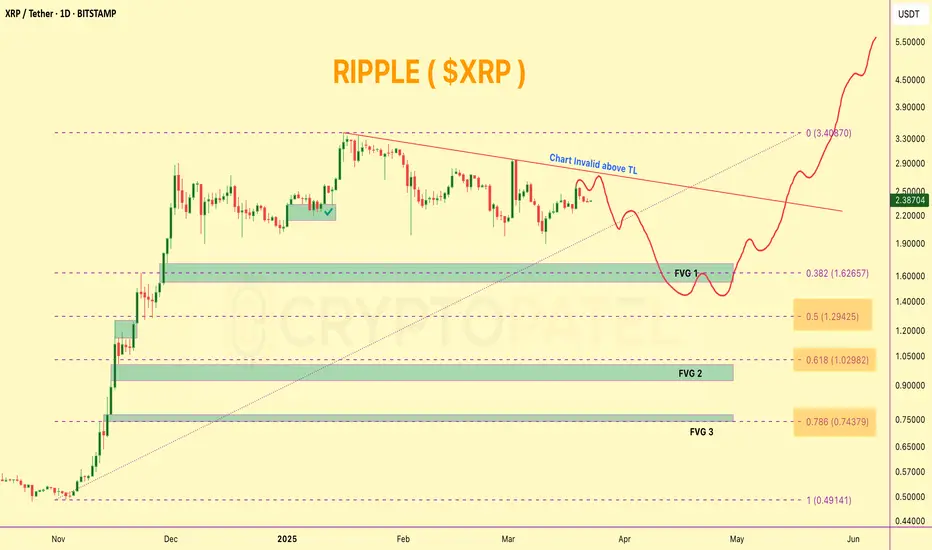
XRP Technical Breakdown – 3 Key Gaps Identified!🚨 XRP Technical Breakdown – 3 Key Gaps Identified!
Hey fam! 👇
I just spotted 3 major GAPS on the CRYPTOCAP:XRP Daily Chart, and they could play a crucial role in XRP’s next big move!
Gap Zones to Watch:
1️⃣ GAP 1 – $1.712 to $1.546
2️⃣ GAP 2 – $1.00 to $0.9268
3️⃣ GAP 3 – $0.772 to $0.64
My Take (IMO):
✔️ In this current super bullish market, GAP 1 has a high probability of being filled before the next leg up toward $5+.
However, if we rely purely on Technical Analysis + Fibonacci levels, the chart indicates that GAP 2 & GAP 3 might need to be filled first before a sustainable upside.
Based on the Fib retracement, if CRYPTOCAP:XRP revisits the 0.618 - 0.786 zones, it could create a powerful reversal and bounce setup from there. That’s a key confluence level for long-term holders and swing traders.
High Liquidity Zones = Opportunity Zones!
All 3 GAPs align with areas of high liquidity – ideal for setting strategic buy orders if you're playing the safe accumulation game.
📢 What do you think?
Do you believe Ripple can drop below $1 again before a new ATH?
Let’s discuss – drop your TA in the comments 💬👇
NIFTY Nifty formed head and shoulder patern on Left chart (daily time frame) right chart (weekly time frame)

PVRInoxPVRInox is under Wyckoff distribution Schematic #1 on weekly chart. this may still take few more month for this to complete.
this is bearish distribution and presently its in phase D
I am hopeful one more chance you may get to exit long position

TatamotorsTataMotors has formed Wyckoff Distribution Schematic 2
it may try to bounce one last time before going further down

IEX continuing downtrendIEX has posted before Daily Timeframe view, now detailed technical view in 1Hr, price has started down move in minutte wave3 of minor Wave C which will last for a year.

AdbeBearish Wyckoff Distribution Schematic #2 (unorthodox)
I would be happy to go wrong however I do see this to test 260 in 2 yrs
it has to cross 590 to nullify this setup

AXIS BANK DOUBLE TOP UNDER FORMATION AND NEAR BREAKDOWN Axis Bank Ltd. Double top or Trendline and consolidation breakdown
to keep on radar
Will it survive and sustain above its support ?
or
Will it Breakdown and slide further down
Lets see how it evolves further
Other points of consideration are
1. RSI on daily taking support at 40 levels
2. Narrowing Bollinger bands forming a rectangular consolidation on daily charts with price trading near lower Bollinger Bands
3. Price slide below lower bands and RSI sliding below 40 on daily chart will make the stock further weak
Lets See How it Evolves.
Disclaimer: NOT A BUY / SELL RECOMMENDATION I am not an expert I just share interesting charts here for educational purpose and not to be taken as buy/sell recommendation. Please seek expert opinion before investing and trading as trading/ investing in market is subject to market risks. I do not hold any position in the stock as on date but I may look to take some position with my own Risk Reward matrix.

ABFRL consolidation breakdown to keep on radarAditya Birla Fashion and Retail Ltd. another consolidation breakdown to keep on radar
1. Price made false / failed breakout of the consolidation zone earlier
2. Price now made a consolidation breakdown on weekly chart
3. RSI on daily chart below 40
4. Double top visible on charts
5. Cypher Pattern under formation on weekly chart
Lets See How it Evolves.
Disclaimer: NOT A BUY / SELL RECOMMENDATION I am not an expert I just share interesting charts here for educational purpose and not to be taken as buy/sell recommendation. Please seek expert opinion before investing and trading as trading/ investing in market is subject to market risks. I do not hold any position in the stock as on date but I may look to take some position with my own Risk Reward matrix.

COCHINSHIPIs cochinship trying to make Eiffel Tower Setup by making a top earlier and now follow through selling
