GIFTNIFTY IntraSwing Levels for 19th JAN 2026GIFTNIFTY IntraSwing Levels for 19th JAN 2026
🚀Follow & Compare NIFTY spot Post for Taking Trade
__________________^^^^^^^^^______________________
💥Level Interpretation / description:
L#1: If the candle crossed & stays above the “Buy Gen”, it is treated / considered as Bullish bias.
L#2: Possibility / Probability of REVERSAL near RLB#1 & UBTgt
L#3: If the candle stays above “Sell Gen” but below “Buy Gen”, it is treated / considered as Sidewise. Aggressive Traders can take Long position near “Sell Gen” either retesting or crossed from Below & vice-versa i.e. can take Short position near “Buy Gen” either retesting or crossed downward from Above.
L#4: If the candle crossed & stays below the “Sell Gen”, it is treated / considered a Bearish bias.
L#5: Possibility / Probability of REVERSAL near RLS#1 & USTgt
HZB (Buy side) & HZS (Sell side) => Hurdle Zone,
*** Specialty of “HZB#1, HZB#2 HZS#1 & HZS#2” is Sidewise (behaviour in Nature)
Rest Plotted and Mentioned on Chart
Color code Used:
Green =. Positive bias.
Red =. Negative bias.
RED in Between Green means Trend Finder / Momentum Change
/ CYCLE Change and Vice Versa.
Notice One thing: HOW LEVELS are Working.
Use any Momentum Indicator / Oscillator or as you "USED to" to Take entry.
━━━━━━━━━━━━━━━━━━━━━━━━━━━━━━━━━━━━━━━━━━━
⚠️ DISCLAIMER:
The information, views, and ideas shared here are purely for educational and informational purposes only. They are not intended as investment advice or a recommendation to buy, sell, or hold any financial instruments. I am not a SEBI-registered financial adviser.
Trading and investing in the stock market involves risk, and you should do your own research and analysis. You are solely responsible for any decisions made based on this research.
"As HARD EARNED MONEY IS YOUR's, So DECISION SHOULD HAVE TO BE YOUR's".
━━━━━━━━━━━━━━━━━━━━━━━━━━━━━━━━━
❇️ Follow notification about periodical View
💥 Do Comment for Stock WEEKLY Level Analysis.🚀
📊 Do you agree with this view?
✈️ HIT THE PLANE ICON if this technical observation resonates with you. It will Motivate me.
━━━━━━━━━━━━━━━━━━━━━━━━━━━━━━━━━
💡 If You LOOKING any CHART, You want me to ANALYZE?
Share your desired stock names in the comments below! I will try to analyze the chart patterns and share my technical view (so far my Knowledge).
If Viewers think It can identify meaningful setups. Looking forward to hearing from all of you — let's keep this discussion going and help each other make better trading decisions.
Screenshot (as of now at 9.56 am) of NIFTY spot Shows Consolidation at REVERSAL / TF level Near @ 25555. Witnessing RSI Bullish Divergence ib 5 min TF.
Beyond Technical Analysis

NEXT GOLD PEAK (XAUUSDFriends, this is the gold chart, and it's a monthly chart. Let's not beat around the bush and get straight to the point: when does gold reach its top and when does it hit its bottom? So, let me tell you.
The price of gold is highest when Jupiter is in a fire sign, that is, Aries, Leo, and Sagittarius. This surge in gold prices occurs when Jupiter transits through these fire signs. And at the same time, either Rahu or Ketu is in a water sign. If you look at the historical charts around the dates when these surges occurred, you will see this pattern.(Friends, this combination hasn't appeared since 2016. We will see this combination again in 2027, and in my opinion, that will be the next gold pick.)
Friends, astrology is a profound and complex subject (Gurumukhi), like the legal profession. It takes a lot of time to study and understand, and there are many aspects that can be quite confusing. So, I'll get straight to the point. Try to meet with an astrologer and try to understand it. Remember, nothing ever works 100 percent of the time.

HDFCBANK Level Analysis: Intraswing for 19th JAN 2026✈️ HDFCBANK Level Analysis: Intraswing for 19th JAN 2026
🚀Follow & Compare Daily Intraswing Post for Positioning much accurate level to Take Trade
💥Level Interpretation / description:
L#1: If the candle crossed & stays above the “Buy Gen”, it is treated / considered as Bullish bias.
L#2: Possibility / Probability of REVERSAL near RLB#1 & UBTgt
L#3: If the candle stays above “Sell Gen” but below “Buy Gen”, it is treated / considered as Sidewise. Aggressive Traders can take Long position near “Sell Gen” either retesting or crossed from Below & vice-versa i.e. can take Short position near “Buy Gen” either retesting or crossed downward from Above.
L#4: If the candle crossed & stays below the “Sell Gen”, it is treated / considered a Bearish bias.
L#5: Possibility / Probability of REVERSAL near RLS#1 & USTgt
HZB (Buy side) & HZS (Sell side) => Hurdle Zone,
*** Specialty of “HZB#1, HZB#2 HZS#1 & HZS#2” is Sidewise (behaviour in Nature)
Rest Plotted and Mentioned on Chart
Color code Used:
Green =. Positive bias.
Red =. Negative bias.
RED in Between Green means Trend Finder / Momentum Change
/ CYCLE Change and Vice Versa.
Notice One thing: HOW LEVELS are Working.
Use any Momentum Indicator / Oscillator or as you "USED to" to Take entry.
━━━━━━━━━━━━━━━━━━━━━━━━━━━━━━━━━━━━━━━━━━━
⚠️ DISCLAIMER:
The information, views, and ideas shared here are purely for educational and informational purposes only. They are not intended as investment advice or a recommendation to buy, sell, or hold any financial instruments. I am not a SEBI-registered financial adviser.
Trading and investing in the stock market involves risk, and you should do your own research and analysis. You are solely responsible for any decisions made based on this research.
"As HARD EARNED MONEY IS YOUR's, So DECISION SHOULD HAVE TO BE YOUR's".
━━━━━━━━━━━━━━━━━━━━━━━━━━━━━━━━━
❇️ Follow notification about periodical View
💥 Do Comment for Stock WEEKLY Level Analysis.🚀
📊 Do you agree with this view?
✈️ HIT THE PLANE ICON if this technical observation resonates with you. It will Motivate me.

HDFC Bank Q3 FY26 Earnings Analysis (Announced January 17, 2026)🌈HDFC Bank Q3 FY26 Earnings Analysis (Announced January 17, 2026)
✅ HDFC Bank, India's largest private sector lender by assets, reported a solid Q3 FY26 (October-December 2025) performance, with net profit beating analyst estimates amid stable asset quality, moderate deposit growth, and improving lending margins. The results reflect resilience in a challenging environment marked by deposit mobilization pressures, regulatory scrutiny on unsecured loans, and global uncertainties like potential US tariffs on remittances. Key positives include double-digit loan growth, NPA improvements, and controlled costs, though deposit growth lagged peers, leading to a slight liquidity drag. Management emphasized profitable growth, digital advancements, and LDR (loan-to-deposit ratio) reduction toward FY27 targets.
📢Key Financial Highlights
The bank delivered YoY profit growth ahead of expectations, with asset quality holding steady. Here's a summary table comparing actuals to estimates (median from 6-8 brokerages) and YoY/QoQ changes👇🏼:
in Table format on Chart.
🔔Beat/Miss Analysis: PAT beat estimates by ~1-2% on better-than-expected NIM stability and fee income, despite higher opex from labor code provisions (₹800 Cr one-off). NII met low-end estimates, reflecting deposit cost pressures. Overall, a "better-than-feared" quarter, with no major slippages in unsecured portfolios.
🏹Segment-Wise Analysis
HDFC Bank's diversified model showed balanced growth, with wholesale and SME segments outperforming retail amid regulatory curbs on consumer loans.
☂️Advances (Loans): Gross advances at ₹28.45 lakh Cr, up 11.9% YoY (from ₹25.42 lakh Cr); advances under management +9.8% YoY. Segment breakdown: Retail +6.9% (muted due to unsecured slowdown), SME +17.2%, Corporate/Wholesale +10.3%, Overseas +1.7% of total. Growth beat estimates of 12-14%, signaling tailwinds from economic recovery.
☔Deposits: Average deposits ₹27.52 lakh Cr, +12.2% YoY; CASA ₹8.98 lakh Cr, +9.9% YoY (+2.4% QoQ). LDR remains elevated at ~85-90%, with plans to reduce to 85% by FY27 through deposit mobilization. Lagged estimates of 10-12% YoY, highlighting industry-wide challenges.
✅Asset Quality: Gross NPA ratio stable at 1.24% (0.97% ex-agri), down from 1.42% YoY; Net NPA at 0.42%. No major deteriorations; provisions controlled, aiding PAT beat. Management noted proactive risk management in unsecured segments.
🕸️Other Income & Costs: Fee income supported revenue; core cost-to-income ratio at 39.2% (stable). Opex up due to employee benefits under New Labour Code, but adjusted figures show efficiency.
🔥Management and Analyst Commentary
💯Management: In the earnings call, CEO Sashidhar Jagdishan highlighted "profitable growth" tailwinds from falling funding costs and CASA recovery. Emphasis on digital/cross-sell for retail revival, SME/corporate momentum, and LDR reduction to 85-90% by FY27. Outlook: Loan growth targeted at 12-15% for FY27, NIM expansion to 3.6-3.7%; cautious on unsecured amid regulations, but optimistic on remittances despite tariffs.
📢Analysts: Positive reactions—beat on PAT/asset quality seen as confidence booster. Motilal Oswal/Yes Securities maintain 'Buy' with targets ₹1,050-1,200 (20-30% upside from current ~₹930). Concerns: Deposit lag could pressure NIM if rates rise; positives: SME growth and NPA stability. Consensus: Q3 as "trough," with FY27 PAT growth 15-20%.
🏹🎯⁉️✍🏼❎☂️✅❌🌈💯🔥👇🏼🐢📢🔔
🌈Impact on Stock Price for Incoming Days
✅Immediate Reaction: Post-results (after-hours on Jan 17), HDFC Bank shares (HDFCBANK.NS) saw mild positive sentiment in extended trading, with ADRs up ~1-2% in US sessions. Domestic close on Jan 17: +0.56% at ₹931.15 (pre-results), but analysts expect a gap-up on Monday (Jan 19) due to PAT beat and stable NPAs. Volume surged 15-20% on Jan 17 amid anticipation.
✅Short-Term (Next 5-10 Days): Likely 3-7% upside if market digests positives (e.g., NIM tailwinds, growth outlook), pushing toward ₹950-1,000. Support at ₹900-920; resistance ₹950. Banking sector (Bank Nifty) could rally 1-2%, as HDFC's ~30% weight amplifies impact. Risks: Broader market weakness from FII outflows or tariff news could cap gains; sentiment on Social Network Discussions/forums positive, viewing results as "reassuring."
💯Medium-Term Outlook: Bullish, with 15-25% potential upside in 3-6 months to targets ₹1,100-1,200, driven by FY27 growth acceleration and valuation re-rating (current P/B ~2.5x vs. historical 3x). Stock down ~6% YTD amid deposit concerns, but results alleviate fears—bias: Buy on dips for long-term investors. Catalysts: Q4 festive lending; risks: Regulatory tightening on unsecured.
✅✅✅✅✅✅✅✅✅✅✅✅✅✅✅✅✅✅✅✅✅
🚀Follow & Compare Daily pot Post for Day Trading Levels.
💥Level Interpretation / description:
L#1: If the candle crossed & stays above the “Buy Gen”, it is treated / considered as Bullish bias.
L#2: Possibility / Probability of REVERSAL near RLB#1 & UBTgt
L#3: If the candle stays above “Sell Gen” but below “Buy Gen”, it is treated / considered as Sidewise. Aggressive Traders can take Long position near “Sell Gen” either retesting or crossed from Below & vice-versa i.e. can take Short position near “Buy Gen” either retesting or crossed downward from Above.
L#4: If the candle crossed & stays below the “Sell Gen”, it is treated / considered a Bearish bias.
L#5: Possibility / Probability of REVERSAL near RLS#1 & USTgt
HZB (Buy side) & HZS (Sell side) => Hurdle Zone,
*** Specialty of “HZB#1, HZB#2 HZS#1 & HZS#2” is Sidewise (behaviour in Nature)
Rest Plotted and Mentioned on Chart
Color code Used:
Green =. Positive bias.
Red =. Negative bias.
RED in Between Green means Trend Finder / Momentum Change
/ CYCLE Change and Vice Versa.
Notice One thing: HOW LEVELS are Working.
Use any Momentum Indicator / Oscillator or as you "USED to" to Take entry.
━━━━━━━━━━━━━━━━━━━━━━━━━━━━━━━━━━━━━━━━━━━
⚠️ DISCLAIMER:
The information, views, and ideas shared here are purely for educational and informational purposes only. They are not intended as investment advice or a recommendation to buy, sell, or hold any financial instruments. I am not a SEBI-registered financial adviser.
Trading and investing in the stock market involves risk, and you should do your own research and analysis. You are solely responsible for any decisions made based on this research.
"As HARD EARNED MONEY IS YOUR's, So DECISION SHOULD HAVE TO BE YOUR's".
━━━━━━━━━━━━━━━━━━━━━━━━━━━━━━━━━
❇️ Follow notification about periodical View
💥 Do Comment for Stock WEEKLY Level Analysis.🚀
📊 Do you agree with this view?
✈️ HIT THE PLANE ICON if this technical observation resonates with you. It will Motivate me.

Bitcoin gearing for upmoveBitcoin has formed a base around its earlier resistance. Now, in the higher time frame, it has started up move while in lower time frame, it's showing a possible retracement. Either path '1' or '2' can be taken, where it will dip on its trendline first (removing weak hands) and rise.

XAUUSD Weekly Analysis (H4)Gold is looking strong and bullish right now.
Last week, the price moved up with good momentum and created a clear imbalance. After that, it came back down into the FVG zone and filled the gap properly, which is a healthy sign in a trending market. That retracement looks like a normal pullback, not weakness.
Now that the imbalance is filled, gold is likely preparing for the next push higher.
What I’m expecting this week
The main target for this week is the ERL zone (PWH). That level is sitting above current price, and it’s a common place where price goes to collect liquidity. So overall, the idea is simple:
✅ Gold may continue moving up toward PWH.
What to watch when price reaches ERL (PWH)
This is the important part — don’t blindly buy at the top.
When gold reaches the ERL level, one of two things can happen:
Price raids the level and reacts down
It touches or slightly breaks above PWH
Then gives a rejection and starts pulling back
(very common in gold)
Price breaks above strongly and continues
Clean breakout
Strong bullish candles
Trend continues upward

RELIANCE: Analysis after Q3 FY26 Earnings with levels🔥 Reliance Industries Analysis AFTER Q3 FY26 Earnings
Reliance Industries Q3 FY26 Earnings Analysis (Announced January 16, 2026)
Reliance Industries Limited (RIL) reported a steady but mixed Q3 FY26 (October-December 2025) performance, with revenue growth driven by the oil-to-chemicals (O2C) and digital services segments, offsetting weaknesses in retail and upstream oil & gas. Consolidated revenue beat estimates, but net profit missed street expectations slightly due to higher depreciation, interest costs, and segment-specific pressures like lower gas realizations and retail margin squeezes. The results highlight resilience amid global challenges (e.g., US tariff fears, volatile crude prices), with management emphasizing AI integration, new energy initiatives, and consumer business expansion for long-term growth.
Key Financial Highlights
RIL's results showed modest YoY growth, with O2C recovery as a standout. Here's a summary table comparing actuals to estimates (median from 6-7 brokerages) and YoY/QoQ changes:
Table on Chart.
Beat/Miss Analysis: Revenue and EBITDA exceeded estimates, buoyed by higher O2C volumes and refining margins (GRMs at ~$11-13/bbl vs. estimates of $10-12). However, PAT missed due to elevated costs (depreciation up on capex, interest on higher debt) and upstream drags. Overall, a "stable" quarter per analysts, with no major surprises but signals of recovery in key areas.
✅Segment-Wise Analysis
✅O2C (Oil-to-Chemicals): Strong performer with revenue up 8.4% YoY to ₹1.62 lakh Cr and EBITDA up 15% YoY to ₹16,507 Cr. Gains from higher fuel cracks (diesel/petrol up 62-106% YoY), increased throughput (2% YoY), and favorable ethane cracking offset petchem weakness and freight hikes. Jio-bp outlets grew 14% YoY to 2,125, with fuel volumes +24% YoY. Positive: Domestic focus amid Russian supply issues; outlook robust on refining demand.
☔Jio (Digital Services): Revenue +12.7% YoY to ₹43,683 Cr; EBITDA +16.4% YoY to ₹19,303 Cr (margin +170 bps). ARPU rose 5.1% YoY to ₹213.7 on premium offerings; subscribers at 515.3 Mn, with 5G at 253 Mn (53% traffic). JioAirFiber at 11.5 Mn homes; Jio Hotstar MAUs 450 Mn. Management highlighted AI partnerships (e.g., Google) and enterprise monetization; no tariff hikes impacted ARPU yet. Strength: 5G leadership (65% market share); future growth in fixed wireless and AI.
☂️Retail: Revenue +8.1% YoY to ₹97,605 Cr; EBITDA up to ₹6,915 Cr. Growth tempered by festive shift, demerger effects, and GST changes; hyper-local orders ~5x YoY. Ajio bill value +20% YoY; JioMart customers +43% YoY to base; Shein app 6.5 Mn installs. Challenges: Margin pressure from offers, investments, and labor costs; snacks/beverages expanding with new capacities.
Upstream Oil & Gas : Revenue -8.4% YoY to ₹5,833 Cr; EBITDA -12.7% YoY to ₹4,857 Cr, hit by lower KG D6 volumes/realizations and maintenance costs. Positives: Increased LNG exports from North America; strong India gas demand.
✍🏼✅Management and ⁉️ Analyst Commentary
✍🏼Management: Mukesh Ambani stressed "consistent delivery" and AI/New Energy focus for sustainability. Akash Ambani on Jio's digital revolution; Isha Ambani on retail innovation. O2C emphasized domestic outperformance; E&P noted LNG trends.
]⁉️ Analysts: Views mixed—steady earnings with O2C uplift, but retail/upstream drags. Goldman Sachs/Yes Securities positive on refining recovery; ICICI sees consumer resilience. Overall rating: Buy/Hold, with targets ₹1,600-1,800, citing long-term value from diversification.
⁉️ Impact on Stock Price for Incoming Days📊as per So called Analyst Community & Social Community views, though not fully agreed. Reason behind is: High short term VOLATILITY
❎Immediate Reaction: Post-results (after-hours on Jan 16), RIL's GDRs slipped ~2% in US trading, signaling mild disappointment over PAT miss and retail softness. Domestic shares closed flat (+0.15%) at ₹1,461 pre-results; expect flat to gap-down opening on Monday (Jan 19, markets closed Jan 17-18 for weekend). Volume spiked 20-30% on Jan 16 amid anticipation.
Short-Term (Next 5-10 Days): Potential 2-5% downside if sentiment focuses on misses (e.g., flat PAT, retail slowdown), dragging Nifty (RIL ~10-12% weight). Support at ₹1,440-1,450; resistance ₹1,500. Volatility likely amid global cues (e.g., US tariffs), but bargain buying could cap losses—experts see dips as entry points.
✅Medium-Term Outlook: Positive, with analysts forecasting 10-15% upside in 3-6 months on O2C rebound, Jio 5G monetization, and retail recovery (e.g., festive Q4). Risks: Crude volatility, consumer slowdown; catalysts: AI announcements, capex updates. Bias: Accumulate on weakness for long-term holders.
🏹🎯🏹🎯🏹🎯🏹🎯🏹🎯🏹🎯🏹🎯🏹🎯🏹🎯🏹🎯🏹🎯🏹🎯
💥Level Interpretation / description:
L#1: If the candle crossed & stays above the “Buy Gen”, it is treated / considered as Bullish bias.
L#2: Possibility / Probability of REVERSAL near RLB#1 & UBTgt
L#3: If the candle stays above “Sell Gen” but below “Buy Gen”, it is treated / considered as Sidewise. Aggressive Traders can take Long position near “Sell Gen” either retesting or crossed from Below & vice-versa i.e. can take Short position near “Buy Gen” either retesting or crossed downward from Above.
L#4: If the candle crossed & stays below the “Sell Gen”, it is treated / considered a Bearish bias.
L#5: Possibility / Probability of REVERSAL near RLS#1 & USTgt
HZB (Buy side) & HZS (Sell side) => Hurdle Zone,
*** Specialty of “HZB#1, HZB#2 HZS#1 & HZS#2” is Sidewise (behaviour in Nature)
Rest Plotted and Mentioned on Chart
Color code Used:
Green =. Positive bias.
Red =. Negative bias.
RED in Between Green means Trend Finder / Momentum Change
/ CYCLE Change and Vice Versa.
Notice One thing: HOW LEVELS are Working.
Use any Momentum Indicator / Oscillator or as you "USED to" to Take entry.
━━━━━━━━━━━━━━━━━━━━━━━━━━━━━━━━━━━━━━━━━━━
⚠️ DISCLAIMER:
The information, views, and ideas shared here are purely for educational and informational purposes only. They are not intended as investment advice or a recommendation to buy, sell, or hold any financial instruments. I am not a SEBI-registered financial adviser.
Trading and investing in the stock market involves risk, and you should do your own research and analysis. You are solely responsible for any decisions made based on this research.
"As HARD EARNED MONEY IS YOUR's, So DECISION SHOULD HAVE TO BE YOUR's".
━━━━━━━━━━━━━━━━━━━━━━━━━━━━━━━━━
❇️ Follow notification about periodical View
💥 Do Comment for Stock WEEKLY Level Analysis.🚀
📊 Do you agree with this view?
✈️ HIT THE PLANE ICON if this technical observation resonates with you. It will Motivate me.

EURUSD: PWH liquidity raid → reversal confirmed.Price grabbed stops above PWH, then dumped hard = classic smart money behavior.
Now the FVG zone becomes sell-side mitigation, with PWL as the next magnet.
✅ Sell retracement
🎯 Target: PWL
⚠️ Invalidation: strong reclaim above FVG
#forextrading #ict #smc #gbpusd #liquidity #fvg

"Bitcoin: A calculated, long-term strategic asset, not a bubbleBitcoin is not a bubble, but a serious and strategic asset that has been created with careful consideration and a long-term vision.
The entire history of BTCUSD (Bitcoin price) is a fascinating journey – starting in 03/01/2009 and continuing to today (January 2026).
2009 → Bitcoin's inception (whitepaper by Satoshi Nakamoto in 2008, genesis block in January,
Price: ~$0 (literally pennies or less, there was no real market). First transaction: 10,000 BTC for 2 pizzas (the famous Pizza Day, May 2010). 2010 → Price: from $0.003 to $0.30. First exchange (Mt. Gox) launched. Year-end: ~$0.30.
2025 → All-time high mania. Peak ~$126,000+ (October 2025) . Institutional inflows, treasury companies buying BTC heavily. Then a correction → year-end ~$88,000–95,000.
2026 (So far – January) → Current price around ~$94,000–$96,000 (January 18, 2026). The market is consolidating, but the long-term outlook is bullish (institutional adoption, policy changes such as the Trump administration's crypto-friendly moves).
In short, the pattern is:
Bitcoin experiences a bull run around every 4-year halving event → peak → 70–85% correction → then a new cycle begins.
Volatility has been very high – 50–80% crashes are common, but the long-term trend is upward.
Growth from 2009 to 2026: ~$0 to ~$95,000+ → meaning approximately 9–10 million times return (for early adopters).
Friends, I have found that Jupiter is the life-giving planet in astrology, and its transits or movements in the sky cause astro-karmic reactions. Based on this, changes occur in a person's(jive) life cycle.
(You may have noticed that when Jupiter transits through Saturn's sign in your birth chart, changes occur in your home that year, such as moving to a new house or renovating your current one.)
Similarly, when Jupiter transits through an Air Sign, the price of Bitcoin surges, reaching a new all-time high. You will observe that every four years, when Jupiter enters that sign, Bitcoin experiences a bull run and reaches a new peak. Following this peak, you will also see a price decline or correction for at least about a year.
Air Signs (Air Element) Characteristics
In astrology, the air element is associated with networks, communication, technology, and the dissemination of ideas.The Air Element is directly connected to the internet and the digital revolution, which is the foundation of BTC.
Gemini : Business and data.
Libra : Market balance and partnerships.
Aquarius: Innovation, the internet, and future technologies.
1. When Jupiter (the planet of expansion) enters these signs, it multiplies the "Network Effect" many times over. Since Bitcoin is a network-based asset, Jupiter's presence in an air sign causes an explosion in its user base, leading to price peaks.
2. The 'Every 4th Years' Math (Jupiter Cycle)
Jupiter stays in one sign for approximately 1 year and takes about 12 years to complete a full cycle (12 signs).
There are three air signs (Gemini, Libra, Aquarius).
It takes Jupiter approximately 4 years to move from one air sign to another.
For example:
2013 (Gemini - Air Sign): Now Jupiter is entering Gemini,
2017 (Libra - Air Sign): BTC made a major top at that time.
2021 (Aquarius - Air Sign): BTC touched the all-time high of $69,000.
2025/26 (Gemini - Air Sign): Now Jupiter is entering Gemini, completing the same 4-year cycle again.
Logic: Jupiter is the significator of wealth, and the air signs represent "information." When money and information spread rapidly together, it creates "FOMO" (fear of missing out), which helps in forming a market top.
From an astrological perspective, BTC (Bitcoin) is considered to be influenced not by a single planet, but by a combination of several planets. According to financial astrology, its main influencing planets are the following:
1. Uranus - The Main Factor
According to astrologers, Bitcoin has the deepest connection with Uranus.
Reason: Uranus symbolizes technology, revolution, and sudden changes. Since Bitcoin is a decentralized and new technology, it is called a 'Uranian Asset'.
2. Rahu
In Indian Vedic astrology, Rahu is considered the significator of virtual things and illusions.
Reason: Rahu is associated with things that are not physically visible (like digital currency). Bitcoin's highly volatile nature aligns with the nature of Rahu.
3. Saturn and Jupiter
Saturn: It represents discipline and government regulations in the market. When Saturn's influence is strong, significant market downturns or consolidation are often observed.
Jupiter: It is the significator of expansion and wealth. When Jupiter's influence is auspicious, a long bull run is seen in Bitcoin prices.
4. Mercury
Reason: Mercury is the planet of trade and communication. Bitcoin transactions and the network are entirely based on digital data and coding, which falls under Mercury's domain. Uncertainty is often observed in the crypto market during Mercury Retrograde.
Astro- Cycles simply provide you with a good opportunity and the chance to make successful trades. How effective it is, only time will tell, friends.

RSI Indicator: Sector-Wise Analysis and Its Importance in MarketUnderstanding RSI in Brief
RSI is plotted on a scale of 0 to 100. Traditionally:
An RSI above 70 indicates an overbought condition.
An RSI below 30 suggests an oversold condition.
RSI around 50 reflects a neutral or balanced momentum.
At the sector level, RSI does not focus on a single stock but instead represents the collective momentum of a group of stocks belonging to the same industry, such as banking, IT, pharmaceuticals, metals, FMCG, or energy.
Concept of Sector-Wise RSI
Sector-wise RSI measures the strength or weakness of an entire sector relative to its recent price performance. For example, if the banking sector index shows an RSI of 75, it implies strong bullish momentum and possibly overheating conditions across banking stocks. Conversely, if the IT sector RSI is at 28, it signals sector-wide weakness and potential undervaluation.
This approach helps market participants move beyond stock-specific noise and understand where institutional money is flowing. Since large investors often rotate capital between sectors rather than individual stocks, sector RSI becomes a powerful indicator of market rotation.
Importance of Sector RSI in Market Analysis
One of the biggest advantages of sector-wise RSI is its ability to identify leading and lagging sectors. When a sector’s RSI consistently remains above 60, it indicates sustained strength and leadership. Sectors with RSI stuck below 40 often represent laggards, showing weak demand or bearish sentiment.
Sector RSI also helps traders avoid false signals. A stock may show bullish RSI, but if its sector RSI is weak, the rally might be short-lived. On the other hand, when both stock RSI and sector RSI align, the probability of a successful trade increases significantly.
Sector RSI and Market Cycles
Markets move in cycles, and sector RSI plays a crucial role in identifying different phases of these cycles. During the early stage of a bull market, cyclical sectors like metals, capital goods, and banking often show rising RSI values. In the mid-phase, sectors such as IT and infrastructure may gain momentum. In the late phase, defensive sectors like FMCG and pharmaceuticals usually display stronger RSI as investors seek stability.
Similarly, during bear markets, sector RSI helps identify which sectors are experiencing aggressive selling and which ones are showing resilience. Defensive sectors often maintain higher RSI levels even during broader market corrections.
Overbought and Oversold Conditions at Sector Level
While overbought and oversold levels are useful, they should not be interpreted in isolation. A sector RSI above 70 does not always mean an immediate reversal. In strong bull markets, sectors can remain overbought for extended periods. In such cases, RSI staying between 60 and 80 is a sign of healthy strength rather than weakness.
Likewise, an oversold sector RSI below 30 may indicate panic selling or extreme pessimism. Long-term investors often use these zones to identify value opportunities, especially when supported by strong fundamentals.
Sector RSI and Relative Strength Comparison
Sector RSI is also used to compare relative strength between different sectors. For instance, if the auto sector RSI is 65 while the FMCG sector RSI is 45, it suggests that autos are outperforming FMCG in terms of momentum. This comparison helps investors allocate capital more efficiently toward sectors with better risk-reward potential.
Portfolio managers frequently rebalance portfolios based on sector RSI trends, increasing exposure to strong sectors and reducing allocation in weak ones.
Combining Sector RSI with Other Indicators
Although sector RSI is powerful, it works best when combined with other technical and fundamental tools. Trend indicators like moving averages help confirm whether a sector is in an uptrend or downtrend. Volume analysis reveals whether RSI movements are supported by strong participation. Macroeconomic factors such as interest rates, inflation, and government policies also influence sector performance and should be considered alongside RSI.
For example, a rising RSI in the banking sector combined with improving credit growth and stable interest rates strengthens the bullish case. Similarly, a falling RSI in the metal sector alongside declining global commodity prices reinforces bearish sentiment.
Sector RSI for Different Market Participants
Short-term traders use sector RSI to identify momentum trades and sector-based breakouts. Swing traders look for RSI reversals near key support or resistance levels. Long-term investors use sector RSI to time entry and exit points within broader asset allocation strategies.
For beginners, sector RSI provides a simplified view of the market by reducing the complexity of tracking hundreds of stocks individually. It allows them to focus on broader trends and make more informed decisions.
Limitations of Sector RSI
Despite its usefulness, sector RSI has limitations. It is a lagging indicator and reflects past price movements rather than future certainty. Sudden news events, policy changes, or global shocks can quickly invalidate RSI signals. Additionally, sector indices may be dominated by a few heavyweight stocks, which can skew RSI readings.
Therefore, relying solely on sector RSI without context can lead to incorrect conclusions. It should always be used as part of a comprehensive analysis framework.
Conclusion
The RSI indicator at the sector level is a valuable tool for understanding market momentum, identifying sector rotation, and improving decision-making across trading and investment horizons. By analyzing sector-wise RSI, market participants gain clarity on which industries are gaining strength, which are losing momentum, and where potential opportunities or risks lie. When combined with trend analysis, volume, and fundamental insights, sector RSI becomes a powerful guide in navigating dynamic financial markets. In an environment where sector performance often drives overall market direction, sector-wise RSI analysis is not just useful—it is essential.

How I use Water Element Zodiac in Time Cycle (Cipla)First of all, Lord Dhanvantari is considered the god of Ayurveda and medicine, not Brihaspati (Jupiter). but in astrology, the role of Jupiter is very important in the field of medicine and pharmaceuticals.
The 'Jiva' factor (the factor of life)
In astrology, Jupiter is called 'Jiva'. This means that the vital energy or 'life force' in the body is under the control of Jupiter.
Dhanvantari provides medicine (treatment).
However, whether that medicine will be effective or not is determined by the position of Jupiter. If Jupiter is strong, the person's 'healing power' is good.
Knowledge and Expertise
The pharmaceutical and medical fields are not limited to simply manufacturing medicines; they require profound knowledge.
Jupiter is the significator of wisdom.
The "discernment" that a doctor or scientist needs to create the right formula and diagnose the correct illness comes from Jupiter.
Growth and Expansion
The pharmaceutical industry is vast. Jupiter's nature is to expand.
The "bounty" or far-reaching impact, from the research and discovery of a medicine to its distribution worldwide, would not be possible without Jupiter.
Jupiter is considered a symbol of auspiciousness, and the purpose of medicine is also to promote the well-being of humanity.
The water element governs respiration (hydration and breathing).
In astrology, the sign of Cancer (water element) governs the chest and upper parts of the lungs. The lungs require moisture to function properly.
Most of Cipla's focus is on the respiratory tract and maintaining airflow.
Cough syrups and asthma medications work to restore the body's fluid balance.
Formulation of Medicines
In the pharmaceutical field, "aqueous element" refers not only to water but also to liquids and chemicals.
Cipla's Expertise: Cipla is known worldwide for its nebulizers, inhalers, and syrups.
In inhalers, the medicine is delivered to the lungs as a mist or vapor, which is a finely dispersed form of the aqueous element.
The zodiac sign Cancer governs the upper parts of the body, specifically the chest and respiratory system (chest and lungs).
Cipla's strength: Cipla is one of the world's largest pharmaceutical companies, specializing in respiratory medicines, respiratory inhalers, and treatments for respiratory conditions.
There is a direct and profound connection between the zodiac sign Cancer (chest) and Cipla's core business (respiratory treatments).
Cipla's Respules are entirely liquid solutions.But in astrology, the role of Jupiter is very important in the field of medicine and pharmaceuticals.
The water element governs respiration (hydration and breathing).
In astrology, the sign of Cancer (water element) governs the chest and upper parts of the lungs. The lungs require moisture to function properly.
Most of Cipla's focus is on the respiratory tract and maintaining airflow.
Cough syrups and asthma medications work to restore the body's fluid balance.
Formulation of Medicines:-
In the pharmaceutical field, "aqueous element" refers not only to water but also to liquids and chemicals.
Cipla's Expertise: Cipla is known worldwide for its nebulizers, inhalers, and syrups.
In inhalers, the medicine is delivered to the lungs as a mist or vapor, which is a finely dispersed form of the aqueous element.
The zodiac sign Cancer governs the upper parts of the body, specifically the chest and respiratory system (chest and lungs).
Cipla's strength: Cipla is one of the world's largest pharmaceutical companies, specializing in respiratory medicines, respiratory inhalers, and treatments for respiratory conditions.
There is a direct and profound connection between the zodiac sign Cancer (chest) and Cipla's core business (respiratory treatments).Cipla's Respules are entirely liquid solutions.
Now let's talk about the time cycle. As you can see that every fourth or eighth year, either a top or a bottom is marked on Cipla's chart, and this happens when Jupiter enters a water sign.
However, financial astrology is not that simple, and it involves many other factors. My aim is not to overwhelm you with a vast subject like astrology, but rather to help you understand things by focusing on the positional changes of a major planet.
And if you understand the concept, don't forget to like it!

UJJIVANSFB – Cup & Handle at Multi-Year ResistanceThe stock has formed a well-defined long-term Cup & Handle structure after an extended base. Price is now testing a multi-year resistance zone, where repeated attempts suggest gradual absorption of supply. The rounded base reflects accumulation, while the handle shows controlled consolidation. This area remains a key decision zone, and price acceptance here will be important to watch.

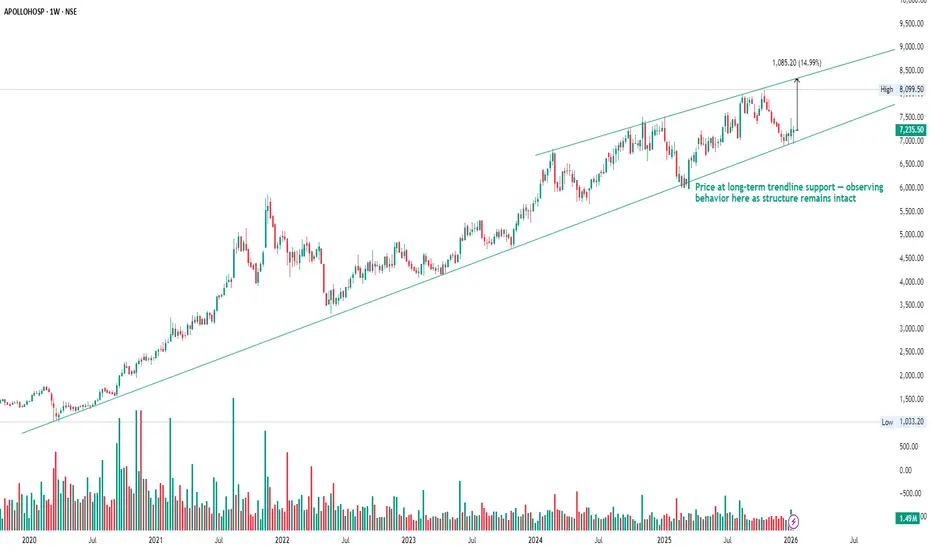
Apollo Hospitals — Long-Term Uptrend in FocusApollo Hospitals continues to respect a clean, long-term rising trendline that has guided price for several years. The recent pullback has brought price back into this high-importance demand zone, where multiple past reactions are clearly visible.
Price is currently holding within the rising channel, closer to the lower boundary — a zone that has historically acted as a balance area between buyers and sellers.
With the Union Budget approaching, any healthcare-related announcements could act as a near-term trigger, but structurally the chart already offers clarity:
Holding above the long-term trendline keeps the primary uptrend intact
Failure to hold may invite further consolidation within the channel
This is a wait-and-watch zone, not a chase. The chart itself will reveal the next move through price acceptance or rejection around this trendline.
Axis Bank — Inverse Head & Shoulders at Key StructurePrice is currently forming an Inverse Head & Shoulders (IHNS) structure within a well-defined rising channel. The neckline zone is clearly visible and has become the decision area on the chart.
If price holds above the neckline and sustains acceptance, the structure remains valid, opening the path for further upside within the channel.
If the breakout fails and price slips back below the neckline, the structure weakens, and price may revisit the lower trendline support of the channel.
At this stage, it’s not about prediction but reaction. This zone will decide whether momentum continues or price rotates back into the range.

HDFC Bank — Respecting a Long-Term Rising StructureOn the weekly timeframe, price continues to respect a well-defined rising structure, marked by higher highs and higher lows over an extended period.
After reaching the upper zone of this structure, the stock has moved into a controlled pullback, which is now approaching the rising trendline support.
This zone is structurally important, as it has acted as a reference area multiple times in the past. At this stage, the focus is not on prediction but on observing price behaviour near the trendline — whether price stabilizes, consolidates, or shows renewed participation.
As long as the broader structure remains intact, patience and clarity around price reaction at support are key. Letting the market confirm intent is more important than anticipation.

Kotak Mahindra Bank — Price Trading Within a Broad Rising StructPrice continues to move within a well-defined broad structure, with the upper trendline acting as resistance and the lower trendline providing structural support.
At the moment, price is consolidating near the mid-range of this structure, showing no clear directional commitment.
Until major event-driven triggers like the budget, the focus remains on observing how price behaves within this range, especially near the lower trendline support.
Patience is key here — letting price reveal intent before taking any action.

CDSL — Price Respecting a Falling ChannelPrice is trading within a well-defined falling channel, marked by lower highs and lower lows.
Multiple touches on both the upper and lower trendlines confirm the validity of this structure.
Recently, price has reacted near the lower boundary of the channel, indicating demand emerging at this zone.
The overall focus remains on how price behaves within this channel and near its boundaries.

Trading Plan for SuccessUnderstanding the Purpose of a Trading Plan
The primary purpose of a trading plan is to bring structure and clarity to your trading activities. Markets are unpredictable, and no strategy works all the time. A trading plan does not eliminate losses, but it ensures that losses are controlled and gains are maximized when the market moves in your favor. It defines what you trade, when you trade, how much you trade, and why you trade. By following predefined rules, traders avoid emotional decisions such as overtrading, revenge trading, or holding losing positions for too long.
A trading plan also helps in maintaining consistency. Consistency is more important than occasional big profits. When you apply the same rules repeatedly, you can evaluate your performance objectively and make data-driven improvements.
Defining Clear Trading Goals
Every successful trading plan begins with clear and realistic goals. These goals should align with your financial situation, risk tolerance, and time commitment. Instead of focusing only on profits, goals should emphasize process-oriented objectives such as maintaining discipline, following risk management rules, and improving accuracy over time.
Short-term goals may include learning a specific strategy, reducing impulsive trades, or achieving consistent monthly returns. Long-term goals might involve building capital steadily, transitioning to full-time trading, or generating supplemental income. Clearly defined goals provide motivation and direction while keeping expectations realistic.
Choosing the Right Market and Time Frame
A good trading plan specifies the markets you will trade, such as stocks, indices, commodities, forex, or options. It is important to focus on a limited number of instruments rather than trading everything available. Specialization allows you to understand the behavior, volatility, and patterns of specific markets.
Time frame selection is equally important. Intraday traders focus on shorter time frames like 5-minute or 15-minute charts, while swing traders may use daily or weekly charts. Long-term investors rely on monthly or weekly time frames. Your choice should match your personality, lifestyle, and available time. A plan that does not fit your routine is difficult to follow consistently.
Developing a Trading Strategy
The trading strategy is the core of your trading plan. It defines the conditions under which you enter and exit trades. A strategy may be based on technical analysis, price action, indicators, volume analysis, or a combination of these. Regardless of the method, the strategy must have clear, objective rules.
Entry rules should specify the exact conditions that trigger a trade. Exit rules should define profit targets and stop-loss levels before entering the trade. A successful trading plan never leaves exits to guesswork. Risk-to-reward ratio plays a critical role here. Many professional traders aim for trades where potential reward is at least twice the potential risk, ensuring profitability even with a moderate win rate.
Risk Management: The Key to Survival
Risk management is the most critical component of a trading plan. Even the best strategy can fail without proper risk control. A trading plan must define how much capital you are willing to risk on each trade. Most successful traders risk only a small percentage of their trading capital, typically 1–2% per trade.
Position sizing is directly linked to risk management. It ensures that no single trade can cause significant damage to your account. Stop-loss placement must be logical and based on market structure rather than emotional comfort. Risk management protects traders from large drawdowns and helps them stay in the game during unfavorable market phases.
Emotional Discipline and Trading Psychology
Trading success is not just about strategy; it is also about mindset. Fear and greed are the biggest enemies of traders. A trading plan helps manage emotions by providing predefined rules, but discipline is required to follow those rules consistently.
Traders must accept that losses are part of the process. A loss does not mean failure; it means the plan is working as intended. Overconfidence after winning streaks and frustration after losses can lead to deviation from the plan. Maintaining emotional balance and trusting the process are essential for long-term success.
Maintaining a Trading Journal
A trading journal is an integral part of a successful trading plan. It records every trade, including entry, exit, reasoning, emotional state, and outcome. Over time, the journal becomes a powerful tool for self-analysis. It helps identify strengths, weaknesses, and recurring mistakes.
Reviewing the journal regularly allows traders to refine their strategies, eliminate bad habits, and reinforce good behavior. Continuous improvement is only possible when performance is measured and analyzed objectively.
Continuous Learning and Adaptation
Markets evolve, and a trading plan should be flexible enough to adapt to changing conditions. Continuous learning through market observation, backtesting, and performance review is necessary. However, frequent strategy changes should be avoided. Adjustments should be based on data and experience, not short-term results.
Successful traders treat trading as a business, not a gamble. They invest time in education, stay updated with market developments, and continuously work on improving their skills.
Conclusion
A trading plan for success is a combination of strategy, risk management, discipline, and self-awareness. It provides structure in an uncertain environment and transforms trading from an emotional activity into a systematic process. While profits are the ultimate goal, consistency, discipline, and risk control are the true pillars of long-term success. By creating, following, and refining a well-defined trading plan, traders significantly increase their chances of achieving sustainable success in the financial markets.

W. D. Gann TIME CYCLE VS ASTRO-TIME CYCLE (Real Estate Boom)W. D. GANN TIME CYCLE VS ASTRO TIME CYCLE
W. D. Gann and "Astro Time Cycles" are not actually opposing forces; rather, astrology was the secret engine behind Gann’s most famous time cycles.
While modern technical analysis often separates "Gann Angles" (math) from "Astro Cycles" (planets), Gann himself viewed them as the same thing. He believed the "Law of Vibration" governed both the movement of planets and the movement of stocks.
Here is the breakdown of how these two concepts relate and where they differ in application.
The Core Relationship : Geometry vs. Astronomy
Gann used geometry and math to "hide" his astrological findings. He often spoke in "code" because astrology was controversial in the early 20th-century financial world.
Gann’s "Fixed" Time Cycles
Gann identified several specific time intervals that he claimed were "natural" cycles of the market. While these look like simple math, they are almost all derived from the movement of the Earth or other planets.
The 1-Year Cycle (365 days): One full orbit of the Earth around the Sun.
The 10-Year & 20-Year Cycles: Closely linked to the Jupiter-Saturn cycle (which meets every ~20 years).
The 30-Year Cycle: Based on the orbit of Saturn (~29.5 years).
The 60-Year Cycle: Gann’s "Great Cycle," which is three Saturn orbits or one full cycle of the Chinese Sexagenary system.
The 90-Day Cycle: A "Square" in astrology (90° aspect), representing a period of seasonal change and market friction.
Modern "Astro Time Cycles" vs. Gann
Today, traders who use "Astro Cycles" without the Gann label focus strictly on:
Planetary Retrogrades: Specifically Mercury and Venus, often linked to market reversals or "fake-outs."
Inversion/Ingress : When a planet moves into a new zodiac sign (e.g., Sun entering Aries).
Eclipses : Used as "wildcard" markers for extreme volatility.
This was a topic for an astro-cycle discussion, but today we'll talk about what happens to real estate when Jupiter is in a water sign and how rallies begin.
For example, I am using the chart for Godrej Properties Ltd stock.
The water signs in the zodiac are as follows: (Cancer, Scorpio, and Pisces).
Jupiter is considered 'Guru' (teacher) in Vedic astrology, symbolizing expansion, wealth, and wisdom. When it comes to the stock market, Jupiter governs sectors that form the backbone of the economy. Jupiter is the planet of wealth.Wealth includes assets/property as well.Real Estate & Housing Finance (The 4th House Connection). Cancer traditionally rules the 4th House—the domain of land, buildings, and comfort.
We are likely to see a "Housing Super-Cycle." This isn't just about luxury condos, but Affordable Housing and Housing Finance Companies (HFCs).
Friends, whenever Jupiter begins its transit through a water sign, just look at the kind of surge we see in the stock market! It's incredible. This realization comes when you learn to correlate the charts with the planetary positions according to astrology. And this technique goes far beyond chart patterns and price action. We hesitate to use astrological methods, even though it is a part of our own heritage.

The difference between WD Gann cycle and Astro cycles(DRREDDY)Friends, when we were sharing the W.D. Gann time cycle charts with you, we observed several cycles, such as daily, weekly, monthly, and yearly cycles, and we saw good reversals and continuations in the patterns.
However, when we talk about Astro-Cycles, they are slightly different from normal cycles. They don't occur after a fixed period; they depend to some extent on when the astrological cycles change, and there can be a difference of a few days or months. For this, you need to use an astrological chart.
For example, I will use the chart from Dr Reddys Laboratories Ltd here.
Here you can see that every 5 years, the unfavorable Jupiter transits into a fire sign .But each fire sign has its own story.
We can also observe that when it starts moving from Sagittarius and reaches Aries (in 5 years), its speed increases, and therefore, when it moves from Aries towards Leo, it is in a very strong phase. After reaching a new peak in the next 5 years, it starts to decline again, and by the time it reaches Sagittarius (like points A/B/C), this 15-year cycle.
Now Jupiter has once again moved towards Aries and Leo. It remains to be seen what the next two years will be like for the pharmaceutical sector.

Silver Tired for few Weeks - Exit for the time beingIn my earlier post of 3rd December 2025 I had talked about a BLAST in Gold including Silver. It has happened. But remember, in the AI model, rise can not be one sided for ever. I am not saying that TREND has turned negative. But for the time being it has a run up too fast and tiredness is visible on the Chart. 1 Day Fisher has made Lower High when Price has made a Higher High. So tiredness in pace is clear.
Beware at this point to get temped for Long. It may punish you.
wait for few weeks for better entry point.
Long Term Trend - Intact (Few Months)
Short Term Trend - Negative (Few Weeks)

XAUUSD (ONDA) IntraSwing Levels for 16th - 17th JAN2026(3.30 am)XAUUSD (ONDA) IntraSwing Levels for 16th - 17th JAN2026(3.30 am)
💥Level Interpretation / description:
L#1: If the candle crossed & stays above the “Buy Gen”, it is treated / considered as Bullish bias.
L#2: Possibility / Probability of REVERSAL near RLB#1 & UBTgt
L#3: If the candle stays above “Sell Gen” but below “Buy Gen”, it is treated / considered as Sidewise. Aggressive Traders can take Long position near “Sell Gen” either retesting or crossed from Below & vice-versa i.e. can take Short position near “Buy Gen” either retesting or crossed downward from Above.
L#4: If the candle crossed & stays below the “Sell Gen”, it is treated / considered a Bearish bias.
L#5: Possibility / Probability of REVERSAL near RLS#1 & USTgt
HZB (Buy side) & HZS (Sell side) => Hurdle Zone,
*** Specialty of “HZB#1, HZB#2 HZS#1 & HZS#2” is Sidewise (behaviour in Nature)
Rest Plotted and Mentioned on Chart
Color code Used:
Green =. Positive bias.
Red =. Negative bias.
RED in Between Green means Trend Finder / Momentum Change
/ CYCLE Change and Vice Versa.
Notice One thing: HOW LEVELS are Working.
Use any Momentum Indicator / Oscillator or as you "USED to" to Take entry.
━━━━━━━━━━━━━━━━━━━━━━━━━━━━━━━━━━━━━━━━━━━
⚠️ DISCLAIMER:
The information, views, and ideas shared here are purely for educational and informational purposes only. They are not intended as investment advice or a recommendation to buy, sell, or hold any financial instruments. I am not a SEBI-registered financial adviser.
Trading and investing in the stock market involves risk, and you should do your own research and analysis. You are solely responsible for any decisions made based on this research.
"As HARD EARNED MONEY IS YOUR's, So DECISION SHOULD HAVE TO BE YOUR's".
━━━━━━━━━━━━━━━━━━━━━━━━━━━━━━━━━
❇️ Follow notification about periodical View
💥 Do Comment for Stock WEEKLY Level Analysis.🚀
📊 Do you agree with this view?
✈️ HIT THE PLANE ICON if this technical observation resonates with you. It will Motivate me.

Technical Analysis and Chart PatternsUnderstanding Technical Analysis
At its foundation, technical analysis relies on three key assumptions. First, the market discounts everything, meaning price reflects all known information. Second, prices move in trends—once a trend starts, it is more likely to continue than reverse immediately. Third, history tends to repeat itself, as market participants often react similarly to comparable situations due to human psychology such as fear, greed, and herd behavior.
Technical analysis uses tools like price charts, indicators, and oscillators to identify trends, momentum, volatility, and potential reversal points. Charts visually represent price movements over time, making them the backbone of technical analysis. Common chart types include line charts, bar charts, and candlestick charts, with candlesticks being the most popular due to their detailed representation of price action.
Role of Charts in Technical Analysis
Charts help traders understand how price behaves over different time frames. Short-term traders may focus on minute or hourly charts, while swing traders prefer daily charts, and long-term investors may analyze weekly or monthly charts. Regardless of the time frame, the principles of technical analysis remain the same.
Key elements observed on charts include support and resistance levels, trendlines, moving averages, and volume patterns. Support represents a price level where demand is strong enough to prevent further decline, while resistance is where selling pressure prevents further price increases. These levels often act as decision points for traders.
What Are Chart Patterns?
Chart patterns are specific formations created by price movements on a chart. They represent the collective psychology of market participants and often signal continuation or reversal of trends. Chart patterns do not guarantee outcomes, but they increase the probability of a particular move when combined with other technical tools.
Chart patterns are broadly classified into three categories:
Reversal Patterns
Continuation Patterns
Bilateral Patterns
Understanding these patterns allows traders to anticipate potential breakouts, breakdowns, or trend changes.
Reversal Chart Patterns
Reversal patterns indicate a possible change in the prevailing trend. They form after a sustained upward or downward move and suggest that momentum is weakening.
One of the most well-known reversal patterns is the Head and Shoulders pattern. It consists of three peaks: a higher middle peak (the head) flanked by two lower peaks (the shoulders). When price breaks below the neckline, it signals a potential reversal from an uptrend to a downtrend. The inverse head and shoulders pattern works similarly but indicates a reversal from a downtrend to an uptrend.
Another important reversal pattern is the Double Top and Double Bottom. A double top forms when price tests a resistance level twice and fails to break higher, signaling bearish reversal. A double bottom forms when price tests a support level twice and fails to break lower, signaling bullish reversal. These patterns reflect exhaustion of buyers or sellers at critical levels.
Continuation Chart Patterns
Continuation patterns suggest a temporary pause in the market before the prevailing trend resumes. They often occur during periods of consolidation, where the market gathers strength for the next move.
Flags and Pennants are common continuation patterns. Flags appear as small rectangular consolidations sloping against the prevailing trend, while pennants resemble small symmetrical triangles. Both patterns indicate strong momentum prior to consolidation and usually resolve in the direction of the original trend.
Triangles are another popular continuation pattern, including ascending, descending, and symmetrical triangles. An ascending triangle forms with a flat resistance line and rising support, signaling bullish continuation. A descending triangle has flat support and falling resistance, signaling bearish continuation. Symmetrical triangles show contracting price action and can break in either direction, often continuing the previous trend.
Bilateral Chart Patterns
Bilateral patterns indicate uncertainty in the market and can break in either direction. Traders usually wait for confirmation before taking a position.
The Symmetrical Triangle is a prime example of a bilateral pattern. It reflects a balance between buyers and sellers, with lower highs and higher lows converging toward an apex. A breakout above resistance suggests bullish continuation, while a breakdown below support suggests bearish continuation.
Importance of Volume in Chart Patterns
Volume plays a crucial role in validating chart patterns. A breakout or breakdown accompanied by high volume is considered more reliable than one with low volume. Volume confirms the strength of market participation behind a move. For example, in a head and shoulders pattern, increasing volume on the breakdown of the neckline strengthens the bearish signal.
Combining Chart Patterns with Indicators
While chart patterns are powerful, relying on them alone can be risky. Successful traders often combine chart patterns with technical indicators such as Relative Strength Index (RSI), Moving Average Convergence Divergence (MACD), and moving averages. These indicators help confirm momentum, trend strength, and overbought or oversold conditions.
For instance, a bullish breakout from a triangle pattern combined with RSI moving above 50 and price crossing above a moving average provides stronger confirmation. This multi-tool approach reduces false signals and improves decision-making.
Limitations of Technical Analysis and Chart Patterns
Despite their usefulness, technical analysis and chart patterns have limitations. Markets can behave unpredictably due to sudden news, economic events, or geopolitical factors. False breakouts are common, especially in low-volume or highly volatile markets. Additionally, chart patterns are subjective—different traders may interpret the same pattern differently.
Discipline, risk management, and proper position sizing are essential to handle these limitations. Stop-loss orders help protect capital when a pattern fails.
Conclusion
Technical analysis and chart patterns form the backbone of modern trading strategies. By studying price behavior, identifying recurring patterns, and understanding market psychology, traders can gain valuable insights into potential future movements. Chart patterns such as head and shoulders, double tops and bottoms, flags, and triangles help traders anticipate reversals and continuations with higher probability.
However, technical analysis is not a magic formula. Its true power lies in consistent practice, combining multiple tools, and disciplined risk management. When used correctly, technical analysis and chart patterns become a powerful framework for navigating financial markets and making informed, strategic trading decisions.
