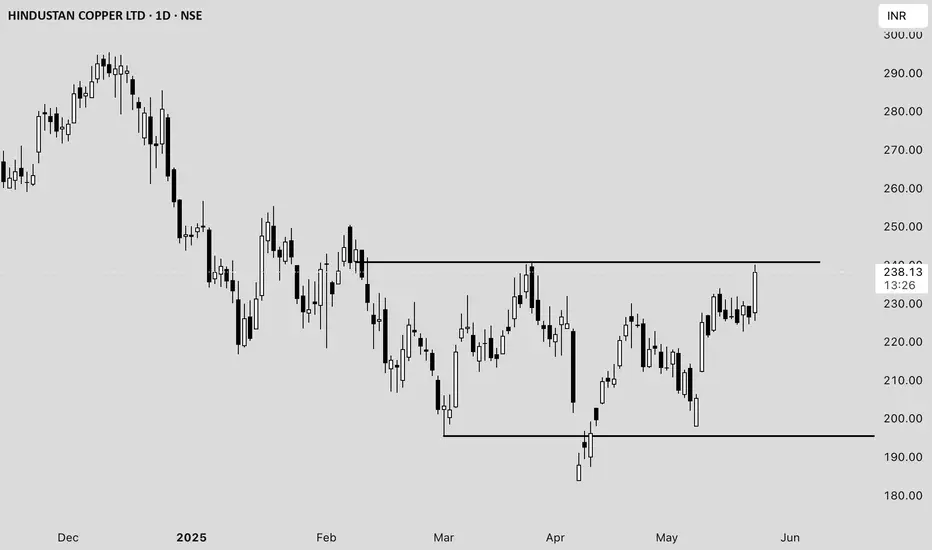
Hindustan Copper Ltd. (HINDCOPPER) Price Analysis **Date:*#### **Current Price and Intraday Movement**
- **Latest Price:** ₹237.98 (+5.09% / +₹11.52)
- **Day’s Range:** ₹225.50 – ₹240.10
- **Open:** ₹227.60
- **Previous Close:** ₹226.46
- **Volume:** 1.63 crore shares (well above average daily volume of 55.89 lakh)
#### **Technical Overview**
- **52-Week Range:** ₹183.82 – ₹381.90
- **50-Day Average:** ₹216.99
- **200-Day Average:** ₹260.58
- **Market Cap:** ₹23,013 crore
- **P/E Ratio:** 57.48
- **EPS:** ₹4.14
#### **Recent Performance and Trends**
- **Short-Term Trend:** The stock surged over 5% today, outperforming its sector and showing strong buying interest .
- **Volume Spike:** Today’s volume is nearly triple the average, indicating heightened trader participation .
- **Technical Position:** The stock is trading above its 50-day moving average but remains below the 200-day average, suggesting a recovery from recent lows but still under medium-term resistance .
- **Support/Resistance:** Immediate resistance is near ₹240–₹249 (upper circuit), with support at ₹225 and ₹216 (50-DMA) .
#### **Fundamental Snapshot**
- **Valuation:** High P/E ratio (57.48) signals expensive valuation relative to earnings .
- **Profitability:** EPS at ₹4.14; profit margins have been under pressure.
- **Industry Position:** Hindustan Copper is India’s primary copper producer, with exposure to global copper price trends and domestic infrastructure demand.
#### **Outlook**
- **Short-Term:** Strong momentum and volume could drive further upside if it breaks above ₹240, but overbought conditions may trigger profit booking near resistance.
- **Medium-Term:** Needs to sustain above the 200-DMA (~₹260) for a confirmed trend reversal.
- **Risks:** High valuation and recent volatility; global commodity price swings can impact earnings.
---
**Summary:**
Hindustan Copper is showing robust short-term momentum with strong volume and price gains, but faces resistance near ₹240–₹249. The stock remains fundamentally expensive, and investors should watch for sustained moves above the 200-DMA for a longer-term bullish signal .
Beyond Technical Analysis
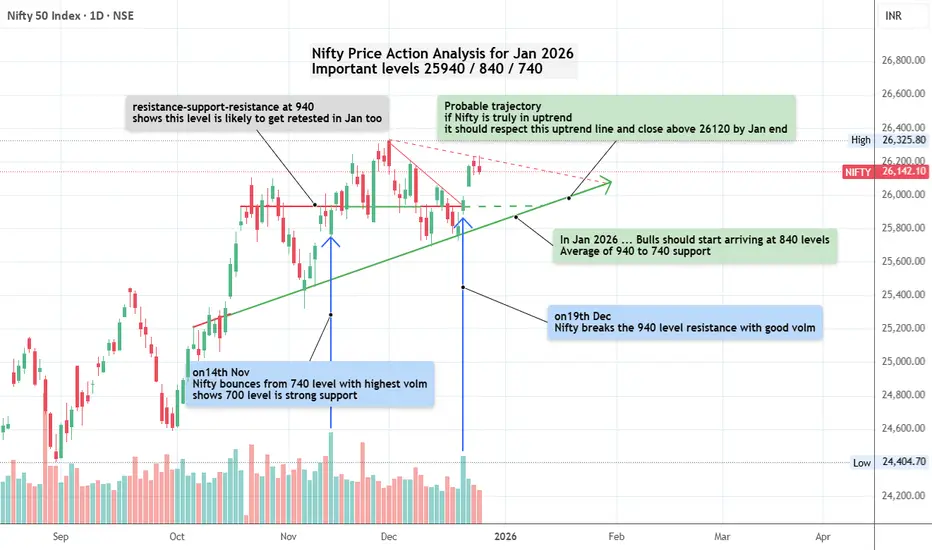
Nifty Price Action Analysis for Jan 2026Date: 25-Dec-2025
Nifty seems to show strong signs of making a new lifetime high in Jan 2026. The 25940 to 25740 levels will prove if bulls are entering long positions or not. Wait for it to correct and enter only when sellers show signs of weakness.
Uptrend line projected shows the likely path Nifty will travel in Jan 2026.
Trade will SL of 50 points from entry. If all goes as planned Nifty should give us a close above 26120 by Jan end.
Word of caution: analysis becomes invalid if Nifty starts making LH (Lower Highs) below the uptrend line projected
Wishing you Merry Christmas and a Prosperous & Healthy New Year 2026
Happy Trading!
ALPHUSD Range Structure Support 0.10, Short-Term Target 0.14ALPH is trading inside a clearly defined range following a prolonged downtrend.
Support Zone: 0.10 – 0.105
Price has repeatedly reacted from this zone, confirming it as a key demand area.
As long as price remains above this support, the structure stays valid.
Resistance Zone: 0.14 – 0.145
This zone has capped price multiple times and acts as the upper boundary of the range.
Short-Term Target: 0.14
As long as support holds, price can rotate toward the upper range resistance.
Invalidation:
A daily close below 0.10 would invalidate this range structure.
Confirmation:
A daily close above 0.14 is required for bullish continuation.
⚠️ Not financial advice.

Have patience Here are the buying zones,linkusdt for long.
Have patience big whales will buy when retailers gonna exhaust from this consolidation.
So wait for the perfect entry approx of 11.8$.

Jayaswal Neeco Industries a turnaround Story Bankruptcy to profit in 5 years.
Secured debt dropped from ₹5,759 crore in March 2020 to 2,557 crore in June 25.
₹3,000 crore of unsustainable debt was converted into equity shares
In December 2025, the company completed a ₹2,300 crore refinancing deal anchored by Tata Capital at 12.5%, replacing costiler debt of 14.5%.
It has captive mines for 100% raw material requirements.
TECHNICAL
Jayaswal Neco Industries is in a strong structural uptrend on the monthly chart, trading near lifetime highs around 80–81, with price action confirming a clear sequence of higher highs and higher lows, so the bias remains bullish.
The earlier 2010–2011 supply zone has been taken out and price is consolidating above it, indicating acceptance of higher valuations rather than distribution.
ADX around 47 shows a very strong trend, and +DI above −DI confirms that buyers still dominate.
MACD is above the signal line and zero, with a rising histogram, signalling positive and still‑building momentum.
RSI near 71 is overbought but does not yet show bearish divergence, implying that any correction is likely to be shallow or sideways unless RSI drops below 60 with price making lower highs.
Key levels:Immediate support lies at 70–72/72–74, the recent breakout and consolidation band; loss of this on a monthly close would be the first sign of trend fatigue.
Strong positional support sits at 52–58, the prior swing‑high base and volume cluster.
As long as price holds above 70 and MACD–ADX stay constructive, upside extensions toward 92–95 in the near term and 110–115 over the medium term remain feasible.

Eternal / ZomatoDate 25.12.2025
Eternal
Timeframe : Day Chart
Update : gig workers announce all-India strike on Christmas, New Year’s Eve
The statement from the unions reportedly stated that their demands included:
1. Transparent and fair pay structures
2. Withdrawal of “10-minute delivery” models
3. An end to account blocking without due process
4. Improved safety gear and accident insurance
5. Assured work allocation without algorithmic discriminatio
Technically :
If breaks dual neckline at280 + 200 EMA = Heavy Bearish, make or break area
Regards,
Ankur

Regulatory Changes Explained in the Trading MarketIntroduction: The Role of Regulation in Financial Markets
Financial markets play a critical role in economic growth by enabling capital formation, price discovery, and risk management. However, without proper regulation, markets can become vulnerable to manipulation, excessive speculation, systemic risk, and investor exploitation. Regulatory changes in the trading market are therefore essential to ensure transparency, fairness, stability, and investor protection. Over time, regulators continuously update rules to adapt to technological advancements, evolving market structures, global financial crises, and emerging asset classes such as derivatives, cryptocurrencies, and algorithmic trading.
Objectives of Regulatory Changes in Trading Markets
The primary objective of regulatory changes is to maintain market integrity. Regulators aim to prevent fraud, insider trading, market manipulation, and unfair trading practices. Another key goal is investor protection, especially for retail investors who may lack sophisticated knowledge. Regulations also promote financial stability by controlling leverage, margin requirements, and systemic risk. In addition, regulatory reforms support orderly market development by encouraging innovation while managing associated risks.
Evolution of Trading Market Regulations
Trading regulations have evolved significantly over the decades. Earlier, markets were largely manual and localized, requiring minimal oversight. With the digitization of exchanges, online trading platforms, and global capital flows, the complexity of markets increased. Events such as the 2008 Global Financial Crisis exposed regulatory gaps, leading to major reforms worldwide. In India, institutions like SEBI (Securities and Exchange Board of India) continuously revise frameworks to align with global best practices while addressing domestic market needs.
Regulatory Changes in Equity Trading
Equity markets have seen several important regulatory changes. These include stricter disclosure requirements for listed companies, improved corporate governance norms, and enhanced surveillance mechanisms. Measures such as circuit breakers, price bands, and real-time monitoring systems help control extreme volatility. Regulations related to insider trading have become more stringent, with clear definitions of unpublished price-sensitive information (UPSI) and heavy penalties for violations. These changes have increased investor confidence and market transparency.
Impact of Regulations on Derivatives Trading
Derivatives trading carries higher risk due to leverage, making regulation particularly important. Regulatory changes have focused on margin requirements, position limits, and eligibility criteria for participants. Regulators periodically revise contract specifications, expiry rules, and risk management frameworks. In India, SEBI has introduced peak margin norms and tightened leverage rules to reduce excessive speculation and protect retail traders from large losses. While these changes may reduce short-term trading volumes, they enhance long-term market stability.
Regulatory Framework for Algorithmic and High-Frequency Trading
With the rise of algorithmic and high-frequency trading (HFT), regulators have introduced new controls to prevent market abuse. These include mandatory approvals for trading algorithms, audit trails, and system checks. Regulations ensure that automated strategies do not create unfair advantages or destabilize markets through flash crashes. Risk controls such as order-to-trade ratios, latency monitoring, and kill switches help maintain orderly trading conditions.
Changes in Risk Management and Margin Systems
Risk management regulations have become stricter to prevent systemic failures. One significant regulatory change is the introduction of dynamic margin systems, such as Value at Risk (VaR) margins and extreme loss margins. In recent years, peak margin reporting has been implemented to ensure traders maintain adequate funds throughout the trading session. These measures reduce the chances of broker defaults and cascading market failures, especially during periods of high volatility.
Regulatory Changes in Currency and Commodity Markets
Currency and commodity trading markets are also subject to evolving regulations. Position limits, trading hours, and contract specifications are periodically revised to reflect market conditions. Regulators aim to curb excessive speculation while ensuring genuine hedgers can manage price risk effectively. In commodity markets, warehouse accreditation, quality standards, and delivery mechanisms are closely monitored to maintain trust and efficiency.
Role of Technology and Compliance Automation
Modern regulatory changes increasingly rely on technology-driven compliance. Exchanges and brokers are required to implement advanced surveillance systems, automated reporting tools, and real-time risk monitoring. Regulatory technology (RegTech) helps institutions comply efficiently while reducing operational risks. This shift reflects the growing importance of data accuracy, cybersecurity, and system resilience in modern trading environments.
Global Regulatory Coordination and Cross-Border Trading
As trading markets become more globalized, regulatory coordination across countries has gained importance. International standards set by organizations such as IOSCO influence domestic regulations. Changes in global rules related to capital adequacy, derivatives clearing, and reporting requirements directly affect cross-border trading. Harmonized regulations help reduce regulatory arbitrage and improve global financial stability.
Challenges and Criticism of Regulatory Changes
While regulatory changes bring stability, they also face criticism. Frequent rule changes can increase compliance costs for brokers and traders. Stricter norms may reduce liquidity and short-term trading opportunities. Some market participants argue that excessive regulation can stifle innovation. Therefore, regulators must balance investor protection with market efficiency and growth.
Impact on Traders and Investors
For traders, regulatory changes require constant adaptation. Margin rules, position limits, and trading restrictions directly influence strategies and risk management. Long-term investors generally benefit from improved transparency and governance. Retail traders, in particular, gain protection from unfair practices, though they must adjust to reduced leverage and stricter compliance requirements.
Conclusion: The Future of Trading Market Regulations
Regulatory changes in the trading market are an ongoing and necessary process. As markets evolve with new technologies, products, and participants, regulations must adapt to address emerging risks while supporting innovation. Effective regulation enhances market confidence, protects investors, and ensures long-term stability. For traders and investors, understanding regulatory changes is not optional but essential for sustainable participation in modern financial markets.

Why Gold Behaves Differently During Christmas Week – A Lesson!Hello Traders!
If you have traded gold for a few years, you might have noticed something strange around Christmas week.
Your usual setups feel different. Levels don’t react the same way. Moves look random, slow, or suddenly sharp without logic. This is not because your analysis stopped working.
Gold behaves differently during Christmas week because liquidity behaves differently.
Understanding this one concept can save you from unnecessary losses.
What Changes in the Market During Christmas Week
During Christmas week, a large part of institutional traders, banks, and big market participants are either inactive or trading with very light exposure. Volumes drop significantly, and participation becomes uneven.
When fewer large players are active, the market structure changes. Gold still moves, but the quality of moves changes.
I’ve learned to treat this week very differently from normal trading weeks.
Why Low Liquidity Changes Gold’s Behavior
Gold is a highly liquid instrument most of the year, but during holiday weeks, especially Christmas, liquidity becomes thin.
With thin liquidity:
Small orders can move price more than usual
False breakouts become more frequent
Clean follow-through after breakouts reduces
Price starts reacting more to random flows than to strong conviction.
The Common Trap Retail Traders Fall Into
Most retail traders trade Christmas week exactly like any other week. They expect normal volatility, normal reactions, and normal continuation.
What actually happens is different.
Price spikes suddenly, hits stops easily, and then goes quiet again. This creates frustration and confusion, especially for intraday and scalping traders.
I’ve personally learned this the hard way earlier in my trading journey.
Why Gold Can Look “Manipulated” During Holidays
When liquidity is low, price movements feel exaggerated. Stops get hit easily, wicks become longer, and reversals appear sudden.
This makes traders feel like gold is being manipulated.
In reality, it is not manipulation, it is absence of depth. When the market lacks depth, price becomes sensitive.
How I Personally Trade Gold During Christmas Week
Over time, I changed my approach completely for holiday periods.
I reduce position size significantly, even if my analysis is strong.
I avoid aggressive intraday trades and prefer higher timeframe context.
I accept that missing trades is better than forcing trades during low liquidity.
Sometimes, the best trade during Christmas week is no trade.
Why Patience Matters More Than Prediction Here
During Christmas week, prediction matters less than protection. Even correct analysis can fail due to lack of participation.
Gold may move, but moves are often unreliable and short lived. This is where discipline protects capital.
I remind myself every year, markets will still be there next week.
Rahul’s Tip
If gold starts behaving strangely during Christmas week, don’t doubt yourself immediately.
Check liquidity first. Reduce size, reduce expectations, or step aside completely.
Preserving capital during low-quality conditions is also a skill.
Conclusion
Gold does not change its nature during Christmas week. Liquidity changes, and gold simply reacts to that.
When you understand how liquidity affects behavior, you stop forcing trades and start respecting the environment.
If this post helped you understand holiday trading better, like it, share your experience in the comments, and follow for more practical gold trading insights. Happy Merry Christmas to all from @TraderRahulPal :))

DXY Breakdown After Major Top – Wave v in ProgressThe DXY chart shows that the U.S. Dollar has completed a larger corrective structure and is now moving inside a new impulsive bearish phase. After forming a major top near the 110 area, the index started a clear five-wave decline, indicating strong downside momentum. The recent sideways movement looks like a corrective pause (wave iv / Y) rather than a trend reversal. As long as the price stays below the key resistance zone around 100–101, the overall structure remains bearish. This suggests the dollar is preparing for the final wave lower (wave v / 3), which could push the index toward deeper support levels. Overall, the Elliott Wave structure favours continued weakness in the U.S. Dollar in the coming months.
Stay tuned!
@Money_Dictators
Thank you :)

WHEELS – Respecting a Multi-Year Trendline and Rising StructureWHEELS has been trading within a clearly defined long-term rising structure after forming a major base in 2020. Since then, price has respected a rising channel, with higher lows consistently forming over the years.
A key observation on this chart is the multi-year descending trendline, drawn from previous cycle highs. Price has interacted with this level multiple times, acting as an important reference point where supply has previously emerged.
Recent price action shows continued respect for both:
the rising channel support, and
the long-term trendline overhead.
This chart highlights how price moves between well-defined structural levels over time. The focus remains on price behavior at these zones, rather than short-term moves.

BBOX – Expansion, Pullback, and Ongoing Price DigestionBBOX shows a clear sequence of price phases. After a prolonged decline, price formed a base and moved into a strong expansion phase, indicating active participation from buyers. That move was followed by a controlled pullback, where price retraced in an orderly manner without damaging the broader structure.
From there, price expanded again and has now shifted into a tight consolidation inside a channel. This phase reflects digestion of the earlier gains rather than aggressive selling. Volatility has reduced, and price is oscillating within defined boundaries.

CARERATING: IH&S Formation After Prolonged ConsolidationCARERATING spent several months correcting after a strong up move and, during this phase, formed a clear inverse head and shoulders structure. The left shoulder and head showed selling pressure, but the right shoulder held higher, indicating that sellers were losing strength.
The neckline, which was acting as supply, has now been crossed. This suggests a change in structure, where demand is starting to absorb supply more effectively than before.
At this stage, the focus is not on speed, but on how price holds above the neckline area. As long as price does not fall back into the earlier structure, the improvement remains intact.

GALAXYSURF – Still Inside a Long-Term Falling ChannelGALAXYSURF continues to move within a well-defined falling channel. Price has respected this structure multiple times, and the recent bounce has again come from the lower end of the channel.
As long as price remains inside this range, the behavior stays the same — pullbacks find support near the bottom and rallies face pressure near the top.


Sell Silver - Big Jackpot at the moment to make profitSilver - Wednesday (24th Dec 2025) MCX:SILVER1!
Entry : Sell
Entry Time: Now
Stop Loss: 750 points
Targets:
T1: 1250 points
T2: 1750 point
Risk:
• Risk per trade < 2%
• Avoid trade if SL hit or Wait for next Entry confirmation
#Silver
#Intraday
#Commodities
#BB
#RSI
#PSAR
#RiskManagement

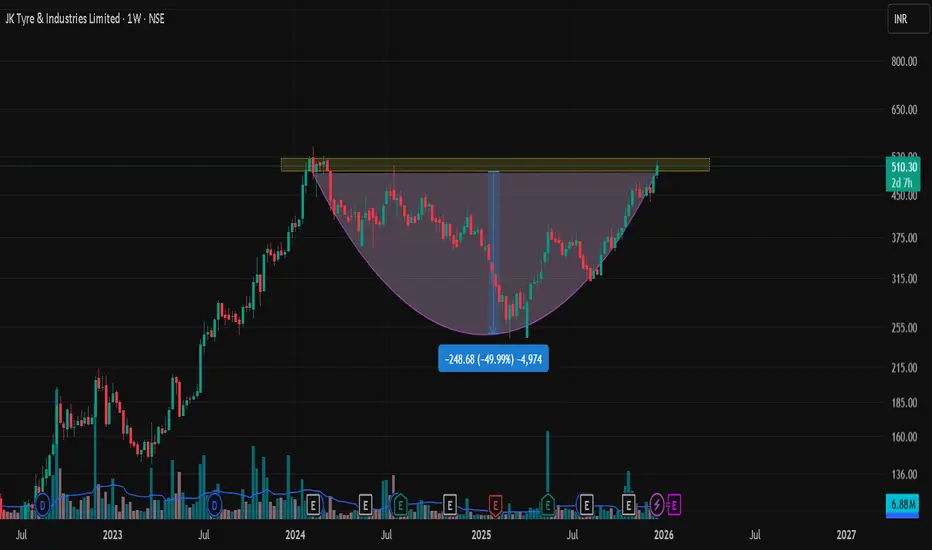
JKTYRE - Rising strengthJKTYRE
good for short term investing.
key observations
Rising strength
Near all time high
Passes mark minervini trend template criteria
Most Traders Don’t Lose on Entries They Lose on Execution-Part-2Why Retail Traders Fail (It’s an Execution Problem, Not an Entry Problem)
Retail traders usually fail for one core reason:
They try to “predict direction,”
while the market forces them to make bad execution decisions.
Most traders can identify “up” or “down.”
They lose because they execute at the wrong time, with the wrong risk, and manage with the wrong rules.
How This Chart Moves (Up → Pullback → Up → Pullback)
It’s Liquidity Progression + Execution Traps
This chart is a rotation-driven environment. Each leg has an execution meaning:
1) Impulse (Expansion)
Price expands because a liquidity objective is being reached (stops / orders above highs or below lows).
Execution reality:
Expansion often looks “safe,” but risk is usually highest here.
Retail enters here because it feels confirmed.
2) Pullback (Rebalance / Risk Reset)
After expansion, price pulls back to rebuild liquidity and rebalance order flow.
Execution reality:
Pullbacks are where risk can compress again.
Retail exits here because it feels scary — or re-enters late.
3) Re-Impulse (Continuation)
Once liquidity rebuilds, price rotates again to the next pool.
Execution reality:
The market is not moving randomly.
It’s moving from one liquidity pool to the next.
Liquidity (Simple Definition for Retail Traders)
Liquidity = a zone where many orders are sitting, especially:
stop-loss clusters
breakout orders
obvious highs/lows
Why price goes there:
Because that’s where there are enough orders to fill size.
Where Retail Execution Breaks (4 Common Fail Points)
1) Late Entries After Expansion
They wait for confirmation, then enter when:
reward-to-risk is compressed
volatility is expanded
Execution mistake: entering when risk is already expensive.
2) Stops Placed Inside Liquidity
Stops behind obvious highs/lows become targets.
Execution mistake: placing protective risk where the market naturally hunts orders.
3) Confusing Pullback with Failure
They treat pullback as reversal and either:
panic exit winners
or re-enter late after confirmation returns
Execution mistake: reacting emotionally instead of managing structurally.
4) Holding Without Validity Checks
They stay committed because they “believe,” not because conditions remain valid.
Execution mistake: no ongoing trade-health evaluation.
Execution Rule (Simple + Premium)
Markets don’t punish traders for being wrong.
They punish traders for executing late and managing emotionally.
The Practical Execution Lens for This Chart
This structure demands:
patience when volatility is expanded
discipline when the move looks “obvious”
risk reduction when probability decays
willingness to wait for risk to compress again
In rotation markets, the edge is rarely “more trades.”
It’s better execution timing and better decision control.
Most retail traders don’t lose because they lack indicators.
They lose because they outsource decisions to buy/sell labels.
A label can’t measure risk, volatility expansion, or trade health.
Build skill in entry location, then protect it with execution discipline.
Buy/sell indicators often trigger after the move begins—when liquidity is already engaged and risk is expanded. Instead of chasing labels, focus on: Entry location (where risk is smallest)
Execution control (when to wait, reduce, or exit as conditions change)
🔹 Educational and discretionary analysis
🔹 No signals, no predictions, no trade advice
Part3 (Coming Soon): Funded Traders Lose on Rules, Not Reads
Daily loss limits and drawdown pressure expose poor execution. The next chapter covers the core mistakes that break evaluations.

Gold Trading Psychology: Right Analysis, Wrong Position SizeHello Traders!
Over the years, I’ve noticed something very common in gold trading.
Most traders are not wrong in their analysis. In fact, many of them read gold levels, structure, and direction almost perfectly. The problem usually starts after the entry, not before it.
The trade fails not because the idea was wrong, but because the position size was too big to handle emotionally.
This is one of the most silent killers in gold trading.
Why Gold Punishes Position Size Mistakes
Gold is not a slow-moving instrument. Even during normal market conditions, it can move sharply within minutes. When your position size is larger than what your mind can comfortably handle, every small pullback starts feeling like a threat.
Instead of calmly following your plan, your focus shifts from structure to P&L.
At that moment, psychology takes over logic, and the trade usually ends badly, even if price later moves exactly as you expected.
What Actually Happens Inside the Trader’s Mind
This is something I’ve personally experienced earlier in my journey.
You enter a gold trade with confidence because your analysis is clear.
Price moves slightly against you, which is completely normal.
But because the position size is heavy, your heartbeat increases, your screen gets more attention than it deserves, and suddenly you are no longer reading price, you are reading fear.
Stops get adjusted, exits get rushed, and discipline quietly disappears.
Why Traders Oversize Gold Positions
Many traders oversize gold because it feels familiar and liquid. Some do it because gold has given quick profits in the past, creating overconfidence. Others do it subconsciously to recover previous losses faster.
But gold does not reward emotional urgency.
It only rewards patience, structure, and controlled risk.
How I Corrected This Mistake in My Own Trading
The biggest improvement in my gold trading came when I stopped thinking in terms of lots and started thinking in terms of mental comfort.
I began sizing my trades in a way where even if the stop loss was hit, it would not disturb my mindset or decision-making. Once I did that, something interesting happened, my execution improved automatically.
Same charts.
Same analysis.
Very different results.
The Real Secret Behind Consistency in Gold
Consistency in gold does not come from predicting every move correctly.
It comes from staying calm while the move is developing.
And calmness is impossible if your position size is forcing you to watch every tick.
If you cannot hold the trade without stress, the size is wrong, no matter how good the setup looks.
Rahul’s Tip
Before placing any gold trade, ask yourself honestly:
“Can I hold this position calmly if gold moves against me first?”
If the answer is no, reduce the size. Protecting your mindset is more important than chasing profits.
Conclusion
Many traders lose money in gold despite having good analysis.
The real issue is not strategy, indicator, or entry timing.
Right analysis with wrong position size will still lead to losses.
But average analysis with correct sizing can build long-term consistency.
If this post felt relatable, like it, share your experience in the comments, and follow for more real gold trading psychology.

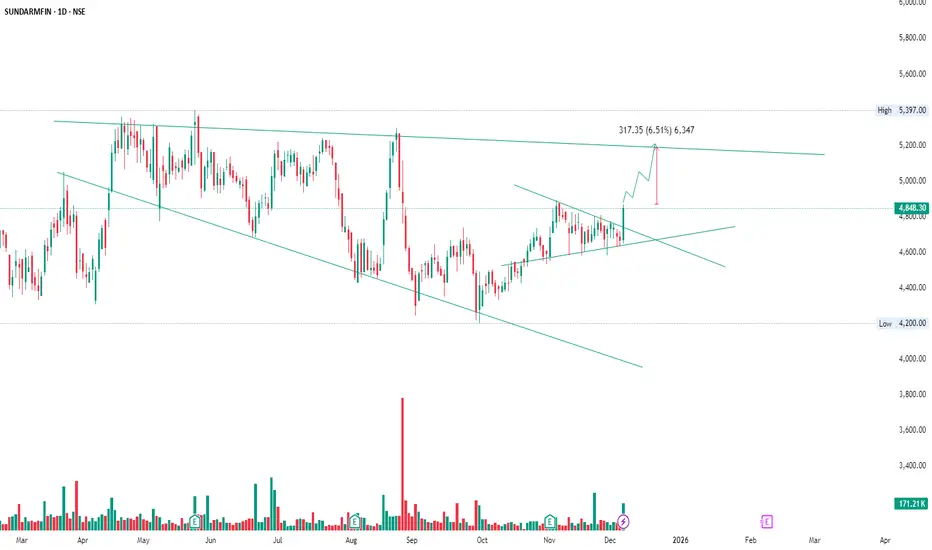
SUNDARMFIN – Breakout Retest Setup Toward Major TrendlineSUNDARMFIN has broken out of the falling wedge and is retesting the breakout zone successfully.
The structure drawn shows a bullish continuation setup:
Falling wedge breakout ✔️
Price holding above the retest zone ✔️
Momentum shifting higher ✔️
The upside projection points toward the major resistance trendline, with a measured target of ~6.5% from the breakout point.
Your drawing also highlights a profit-taking zone once price reaches the trendline resistance.
Trade Logic from the drawing:
Breakout → Retest → Continuation toward higher resistance
Possible reaction down after reaching the target line.
My Key View:
As long as price stays above the retest level,
bulls are in control toward the upper trendline.
UNOMINDA – Compression Near Trendline (Decision Zone Ahead)UNOMINDA is just moving inside a tight structure right now. Price is getting pushed down from the top trendline, but at the same time buyers are not letting it fall much either. Every dip is getting bought a little higher.
That tells me neither side is in full control yet. This kind of slow, tight movement usually happens before a bigger move, but there’s no rush to guess the direction.
For now, it’s more about watching how price behaves near the trendlines. Once price starts holding clearly above or below this structure, the picture will become clearer.

POWERGRID: Price Revisiting the Breakdown ZonePOWERGRID broke down earlier and moved lower from that level. After the initial move, price stayed below the breakdown area for some time, showing that the market accepted lower prices.
Recently, selling pressure has slowed, and price is now retracing back toward the same breakdown zone. This is a normal market behavior. Price often revisits the area where an important decision was made to check whether sellers are still active there.
Markets often come back to test where the move began.

NMDC – How Price Changes Its Behaviour (BOS)NMDC has shifted its behavior.
Earlier, price was getting sold on every rise. Over time, that selling pressure weakened, and price started holding higher levels. The recent move above the previous swing high confirms this change.
What matters now is not the breakout itself, but how price behaves after it. The pause and consolidation above the old resistance show acceptance, not weakness.
As long as price holds above the broken level, the structure remains constructive. No rush, no prediction — just observing how price responds.

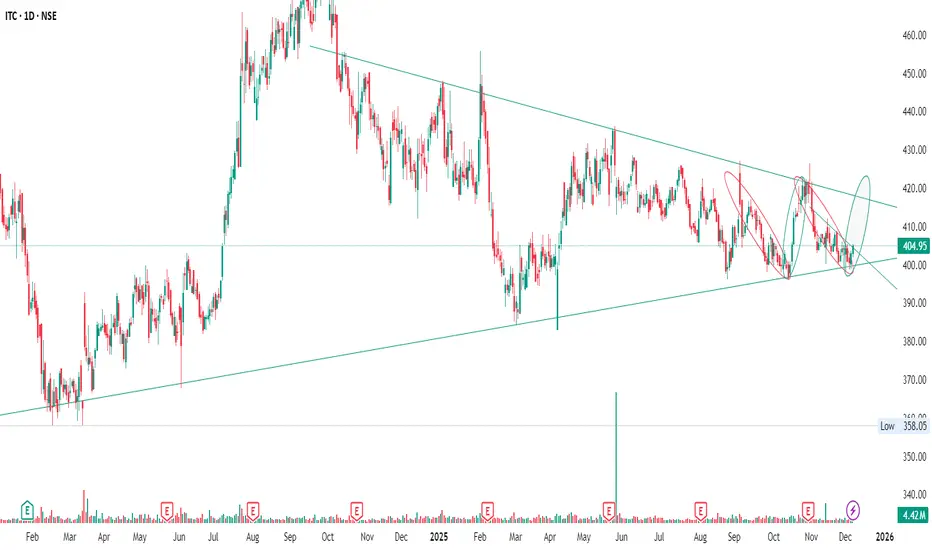
ITC – Compression Inside Triangle, Fresh Bounce from Rising SuppITC has been consolidating inside a large contracting triangle on the daily chart.
The pattern is defined by:
A falling resistance line connecting the post-rally lower highs.
A rising support line connecting the higher lows around the ₹400 zone.
Price is getting gradually compressed between these two levels.
In the right side of the chart I’ve highlighted the last three swings:
The red curves mark previous sharp declines from the upper trendline back to the rising support. In both cases, the stock held the trendline and reversed higher.
The current swing (green curve) shows a fresh rejection from the same rising support, with buyers once again stepping in near ₹400.
As long as this up-sloping support continues to hold, the structure favours another rotation towards the falling resistance zone near ₹420–430 inside the triangle.
A decisive breakout above that resistance would signal the end of this compression phase and open the door for a larger directional move.
This idea is based purely on:
Respect of the long-term rising support,
Repeated failure of sellers to break below it,
And the repeating swing behaviour inside the contracting triangle.