HCLTECH -Waiting for Price to Enter My ZonePrice is still trading inside a declining structure. I’m not interested in chasing moves in between.
My focus is on letting price come into my predefined area, where risk is clear and structure makes sense. If price reacts from that zone, opportunities open up. If not, I stay flat.
This is not about predicting the next move — it’s about waiting, discipline, and execution at the right place.
Patience > hype. Structure > noise.
Beyond Technical Analysis

XAUUSD | 1H | Liquidity-Based SetupPrice is currently trading inside a well-defined range, with liquidity clearly resting on both sides.
• The equal highs / range high above act as buy-side liquidity, likely to be raided before any meaningful directional move.
• A liquidity sweep to the upside is expected first, tapping into premium pricing and inducing late buyers.
• Post sweep, watch for shift in market structure on LTF, indicating smart money distribution.
• Downside targets align with the HTF demand / discount zone, where unmitigated liquidity rests.
Execution Plan
No blind entries
Entry will be taken only if LTF confirms reversal after liquidity grab, in alignment with HTF narrative
Targeting a range expansion → distribution → markdown sequence
This is a classic liquidity engineering setup, not a breakout trade.

Markets Don’t Move in Straight Lines, The Move in Human EmotionsThis chart is not about predicting the next move.
It’s about understanding how price behaves when human emotions repeat.
Every cycle on this chart tells the same story:
Excitement builds as price rises
Confidence turns into overconfidence
Confusion appears during the fall
Only patient participants remain near the base
Most people get active at the top.
Most people get silent near the bottom.
I’m not chasing price here.
This is how I look at markets:
Structure over hype
Patience over prediction
Process over speed
Price doesn’t reward urgency.
It rewards those who can wait.
This study is shared to help traders slow down, observe, and think in cycles, not candles.

JSWSTEEL — Let Price Come to Me | Long or Short Only at My ZoneJSWSTEEL has been respecting this long-term rising channel for years.
Every meaningful move in this stock has started only after price interacted with structure — not in the middle.
Right now, price is not at my area of interest.
I am not bullish or bearish here.
I have no urgency to trade.
My plan is simple:
If price comes down into my marked zone and shows strength, I’ll consider longs.
If price rejects this zone decisively, I’ll consider shorts.
Until then, I wait.

NCC: Price, Psychology and the Power of PatienceThis chart is not about forecasting the next move.
It’s about understanding how price behaves and how traders react.
The sharp vertical rally marks the zone where emotions peak and the crowd gets excited.
What follows is not weakness — it’s the market cooling down and resetting expectations.
Most traders struggle in this phase.
Price moves slower, reactions are mixed, and conviction fades.
This is where patience starts to matter more than opinions.
Instead of chasing momentum, I focus on long-term structure and key reference levels.
I let price travel back into areas where risk becomes defined and behaviour becomes predictable.
Markets don’t reward urgency.
They reward those who wait while others react.
This is how I approach charts:
Price first. Structure always. Patience above everything.
Patience over prediction.
Structure over hype.

WIPRO: Where Most Get Impatient, Price Gets ReadyMost people lose money not because the market is difficult, but because they can’t sit still when price asks them to.
WIPRO has already done the hard work in the past — a long decline, a rounded base, and a strong recovery leg. Now price is not trending aggressively; it’s resting, compressing, and testing patience inside a narrow structure.
This phase is important because markets don’t move when everyone is excited — they move when impatience peaks and weak hands get shaken out. What we’re seeing here is not randomness, but controlled behaviour after a larger move.
I’m less interested in predicting the next candle and more focused on how price behaves near this structure. That behaviour decides whether this becomes continuation, expansion, or more time-based consolidation.
I don’t chase moves.
I watch how price prepares for them.
Already aligned with this structure from earlier levels — now patience matters more than action.
Quality over quantity. Structure over noise.

pricola stop loss below 606 or todays low of 640.15 -634.6 as stop loss range ... on e can use bullish flagtrgt objectives or fib extension objectives as logical trgts ..Please stick to stops as per risk apetite extreme being 634

GOLD UPCOMING MOVE ANALYSIS.GOLD is trending at trendline support and looking bullish. so targeting upside liquidity.

NIFTY: Structure Is Clear, Entry Comes With ConfirmationNIFTY is currently trading inside a well-defined structure, where price is moving between key support and a declining trendline. This zone often creates noise, fake moves, and emotional entries.
Instead of forcing trades in the middle, the focus should be on waiting:
• Either for a clear rejection from resistance
• Or a confirmed breakout with acceptance
Entries taken without confirmation usually come from impatience, not edge.
The market will always give another opportunity — but capital and confidence must be protected first.
I prefer waiting for price to reach important levels and show intent, rather than reacting to every small move.

How Market Makers Trap Retail Traders & How to Avoid It?Hello Traders!
Have you ever taken a perfect-looking trade, only to see price hit your stop loss and then move exactly in your direction?
You felt unlucky.
You blamed manipulation.
You thought the market was against you.
But here’s the uncomfortable truth.
Most retail traders don’t lose because their setup is bad.
They lose because they don’t understand how market makers operate.
Once you understand how traps are created, your entire way of reading charts changes.
Who Are Market Makers (In Simple Words)?
Market makers are not sitting there to hunt you personally.
Their job is to provide liquidity and execute large orders.
To do that, they need one thing from the market.
Orders.
Stop losses, breakout entries, panic exits, all of these are liquidity.
Common Ways Retail Traders Get Trapped
False Breakouts
Price breaks an obvious high or low.
Retail traders jump in expecting a strong move.
Within a few candles, price reverses sharply and traps them.
Stop-Loss Hunts
Price suddenly spikes just enough to take out stop losses placed below support or above resistance.
Once liquidity is collected, price moves in the opposite direction.
Emotional Candles
Big red or green candles appear after news or during high volatility.
Retail reacts emotionally.
Market makers use this emotion to fill positions.
Choppy Ranges
Price keeps moving up and down inside a range, stopping out both buyers and sellers.
Retail overtrades.
Smart money accumulates quietly.
If this feels familiar, don’t worry.
Almost every trader learns this the hard way.
Why Retail Traders Fall Into These Traps
They chase obvious levels that everyone can see.
They place predictable stop losses at exact highs and lows.
They trade based on excitement instead of structure.
They react instead of waiting for confirmation.
Market makers don’t need to predict the future.
They simply exploit predictable behavior.
How I Avoid Market Maker Traps
This part changed my trading completely.
I Stop Chasing Breakouts
If a level looks too obvious, I wait.
Real moves usually come after trapping traders, not before.
I Wait for Confirmation
I look for price to break a level and then fail.
False moves often reveal real direction.
I Respect Liquidity Zones
Highs, lows, equal highs, equal lows, these are liquidity pools.
I expect reactions there, not blind continuation.
I Trade With Calm, Not Urgency
When I feel FOMO, I know I’m late.
Good trades never force you emotionally.
Trading became much easier once I stopped trying to be right and started trying to be patient.
The Biggest Mindset Shift
The market’s job is not to be fair.
Your job is not to be emotional.
Once you accept this, traps stop hurting you.
Sometimes you even start using them to your advantage.
Rahul’s Tip
If price does something that feels “too obvious,” pause.
Ask yourself one question
“Who benefits if retail enters here?”
That single question has saved me from many bad trades.
Conclusion
Market maker traps are not a conspiracy.
They are a result of human psychology and predictable behavior.
When you stop reacting and start observing,
the market stops feeling random and starts making sense.
If this post helped you see traps differently, like it, share your thoughts in the comments, and follow for more real-world trading psychology content.
KIRLOSENG Price ActionKirloskar Oil Engines Limited has recently shown a strong short-term uptrend, supported by positive quarterly earnings announced in September 2025. The stock price moved up significantly, hitting an 11-month high on November 12, 2025, driven by a notable jump in quarterly profits. Despite some past corrections and mixed signals over recent months, the near-term momentum is upward, backed by solid revenue and profit growth.
Volatility remains moderate, and the stock is trading comfortably above key moving averages, indicating strength. However, while there are several positive technical and fundamental signals, some caution is warranted due to occasional volume spikes on price declines and resistance levels near recent highs.
Overall, Kirloskar Oil Engines can be viewed as holding an accumulation or hold status at present, with the potential for further upside if the positive earnings momentum continues and key support levels hold firm. It's advisable to monitor the stock closely over the next few weeks for confirmation of sustained strength before considering new buying positions.
This balanced outlook reflects a positive but cautious stance, awaiting clearer signals to shift decisively to a buy recommendation.

KARURVYSYA Price Action1. Trend Bullish
2. Set up: Rounding pattern
3. Strength - strong
4. Pull back and reversal

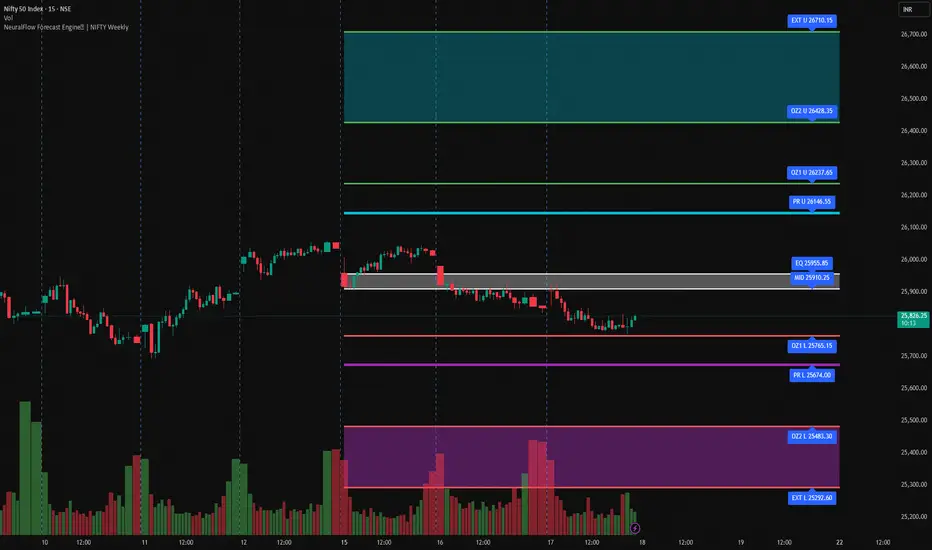
NIFTY Weekly AI Bands | Mid-Week Structure & Trade ContextWe are in middle of week and Wednesday market trading hours are going to close soon.
This chart shows weekly NeuralFlow AI bands plotted on a 15-minute NIFTY chart. These are contextual levels, not signals, designed to define where price matters as the week progresses.
By Wednesday, market behavior around these levels usually sets the tone for Thursday–Friday.
What These AI Bands Measure
The NeuralFlow Forecast Engine™ is a proprietary Artificial Intelligence framework trained to identify rebalancing zones, not breakout targets. It maps auction behavior, not trader sentiment.
The bands highlight:
Where price prefers to stabilize
Where expansion starts losing strength
Where moves historically exhaust
.................................................................................................................
Key Weekly AI Levels (This Week)
Upper Structure
Predictive Rail (Upper): 26,146
Outer / Extreme Upper Zone: 26,400 – 26,700
Balance
AI Equilibrium: 25,955
Mid-Equilibrium: 25,910
Lower Structure
Outer Lower Zone: 25,483
Extreme Lower Zone: 25,293
Please NOTE: These are weekly reference levels, not intraday targets.
.............................................................................................................
Mid-Week Read (Wednesday)
Earlier this week, NIFTY moved above equilibrium (25,955) but failed to hold.
Price has since:
Rotated back below equilibrium
Stabilized in the lower half of the weekly range
Shown controlled selling, not panic
This suggests value is shifting lower, not a trending breakdown.
...............................................................................................................
How to Use These Levels
Below Equilibrium (Below 25,955)
Long trades have lower probability
Rallies toward 25,955–26,146 are corrective
Prefer sell-on-rallies, not breakout longs
Middle of the Range (25,700–25,900 approx.)
Choppy price action
High stop-loss risk
Avoid trading here
Lower Zones (25,483 → 25,293)
Risk becomes better defined
Avoid fresh shorts into these levels
Watch for slowing momentum or rejection
These zones often produce end-of-week responses.
What Would Change the Structure?
Acceptance above 25,955
→ Balance restored, longs regain edge
Acceptance below 25,483
→ Downside discovery toward lower extremes
Rejection from 25,293–25,483
→ Likely rotation higher, not trend reversal
Acceptance means holding, not just touching.
................................................................................................................
Thursday–Friday Playbook
Below 25,955
→ Prefer selling rallies
→ Avoid chasing upside moves
Above 25,955 with acceptance
→ Shorts lose edge
→ Upside rotations toward 26,146 possible
Near 25,483–25,293
→ Reduce shorts
→ Watch for bounce or range formation
Final Takeaway
NIFTY has:
Tested fair value at 25,955
Failed to accept it
Settled lower in the weekly structure
................................................................................................................
The goal is not prediction.The goal is trading only at meaningful levels.
Wait for price to reach where risk makes sense. Everything else is noise.
Happy trading!
BSOFT — Double Bottom Formation | Waiting for Neckline Breakout BSOFT has gone through a sharp corrective phase and is now showing a clear double bottom structure near the demand zone.
Both lows were defended strongly, and price has started to move back toward the neckline resistance around the highlighted level.
Right now, the stock is at a decision point.
• A clean breakout and hold above the neckline would confirm the pattern and open the door for the next upside leg.
• Until that happens, patience matters — no anticipation, only confirmation.
This study is purely based on price behavior, structure, and reactions, not predictions or hype.
I prefer to wait for price to prove itself before taking any action.
Quality setups > random trades.

PAYTM: Rising Structure Under PressurePAYTM has been trading inside a rising structure, making higher highs and higher lows for several months. This trendline has acted as a strong guide for price, with buyers consistently stepping in on dips.
However, recent price behaviour near the upper boundary tells a different story. Multiple attempts to move higher have been met with rejection, and price is now struggling to hold above the short-term rising support.
What matters here is behaviour, not hope.
A rising trend remains valid only as long as price continues to respect its structure. The recent breakdown attempt below the internal support suggests that momentum is slowing and supply is becoming active at higher levels.
If price fails to regain strength and sustain above the rising support, a deeper retracement toward the next demand zone becomes a realistic possibility. On the other hand, acceptance back above the structure would keep the trend healthy.
This is not a buy or sell call.
This is a reminder to wait for confirmation and respect price action, especially when a stock is extended and emotional participation is high.

NAS100 Preparing for Wave 3 Rally After Healthy PullbackThe NAS100 chart shows that a larger corrective move has likely finished at the (Y) / C low, after which price started a new upward impulsive structure. The recent decline looks like a normal Wave 2 pullback, which has already reacted from the 0.5–0.618 Fibonacci support zone, a common area for corrections to end. This suggests buyers are stepping back in and the market is preparing for Wave 3, which is usually the strongest upward move. As long as price stays above the invalidation level near 23,836, the bullish Elliott Wave setup remains valid. Overall, the structure favors further upside toward new highs once Wave 3 gains momentum.
Stay tuned!
@Money_Dictators
Thank you :)

Nifty 50 Analysis for Short and Long TermIn the video, few points that are discussed are :
Nifty 50 is sustaining on long term chart.
Nifty 50 is sideways to bearish on short term chart.
Check the past chart and control your emotions in short term up and down moves.

Stories Shape the TradeMarkets move on belief before they move on numbers.
Behind every price movement is a story shaping how traders think, feel, and act. Below is a clear, point-wise and impressive explanation of how stories shape the trade in financial markets.
1. Markets Are Built on Human Psychology
Traders are humans, not machines.
Humans understand the world through stories, not raw data.
Prices reflect collective emotions—hope, fear, greed, and doubt.
2. Data Creates Facts, Stories Create Direction
Economic data shows what happened.
Stories explain what it means for the future.
Trades are placed based on expectations, not history.
3. Every Trend Has a Dominant Story
Bull markets thrive on stories of growth, innovation, and opportunity.
Bear markets feed on narratives of risk, slowdown, and collapse.
As long as the story survives, the trend continues.
4. News Is Powerful Because It Builds Narratives
A single headline can change market mood instantly.
The same news can be bullish or bearish depending on the story behind it.
Markets react more to interpretation than information.
5. Stocks Are Valued on Future Stories
Price is not just about current earnings.
Markets buy future potential wrapped in a compelling narrative.
Strong stories attract capital even before profits arrive.
6. Technical Levels Work Because Traders Believe Them
Support and resistance are psychological zones.
Breakouts succeed when the story says “momentum is strong.”
Charts work because belief becomes action.
7. Sentiment Moves Faster Than Fundamentals
Stories spread faster than financial reports.
Social media accelerates narrative-driven trades.
Price often moves first; fundamentals follow later.
8. Institutions Trade Stories at Scale
Big money positions itself before narratives go mainstream.
Retail traders usually enter once the story becomes popular.
Early story recognition creates the biggest profits.
9. Fake Stories Create Traps
Not all stories are true or sustainable.
Overhyped narratives lead to bubbles and sharp reversals.
Smart traders watch price confirmation, not just excitement.
10. Price Reveals Whether the Story Is Working
Strong story + weak price = warning sign.
Bad news + strong price = hidden strength.
Price action exposes belief strength.
11. Market Cycles Are Story Cycles
Accumulation: “No one cares”
Expansion: “This is the future”
Distribution: “It can’t fall”
Collapse: “It was obvious”
12. Successful Traders Trade Story Shifts
The biggest moves happen when the story changes.
Fear turning into confidence creates rallies.
Confidence turning into doubt creates crashes.
13. Emotional Control Beats Story Addiction
Traders lose when they fall in love with narratives.
Professionals stay flexible as stories evolve.
Adaptation is more powerful than conviction.
14. Stories Explain Volatility
Sudden moves happen when stories clash.
Markets reprice instantly when belief changes.
Volatility is the sound of narratives breaking.
15. Master the Story, But Follow the Price
Stories guide understanding.
Price decides truth.
Profitable trading lives at the intersection of both.
🔑 Final Insight
Markets don’t trade facts—they trade beliefs.
Those who understand stories early shape profits.
Those who ignore them chase prices.

SRF – Inverse Head & Shoulders Inside Falling WedgeSRF is forming a strong bullish reversal structure on the daily chart.
Within the current falling wedge, price has created a clean
Inverse Head & Shoulders (IHNS) pattern:
Left Shoulder – rounded bottom
Head – deepest low
Right Shoulder – higher low showing buyers stepping in
Neckline – down-sloping resistance drawn above the shoulders
Price is currently trading close to this neckline zone.
A breakout above the neckline will confirm the IHNS pattern
and can open a move toward the upper falling-wedge trendline,
as shown in the breakout projection drawn on the chart.
Structure shown in the drawing:
IHNS within wedge → bullish reversal setup
Neckline breakout = confirmation signal
Expected upward wave marked after breakout
📌 If the breakout happens with volume,
the trend reversal may accelerate sharply.

TATACONSUM: Patience at a Key Decision ZoneTATACONSUM is currently trading inside a well-defined structure. Price has been making higher lows, supported by a rising demand line, while repeated rejections near the upper zone show that supply is still active.
This behaviour has created a compression phase where buyers are defending dips, but sellers are not yet allowing a clean expansion. The recent bounce from support shows demand is present, but acceptance above the overhead supply is still missing.
At this stage, the chart is not about predicting direction. It is about waiting for confirmation.
A sustained move above the resistance would indicate strength and continuation, while rejection would keep price rotating inside the structure.
This study focuses purely on price behaviour at key levels, not on blind entries or assumptions.

HDFCLIFE: Waiting for Acceptance Above ResistanceHDFCLIFE is currently trading inside a well-defined structural range. Price has been respecting a rising demand line from below, while repeated rejections near the falling trendline show active supply at higher levels.
This combination has created a compression zone where higher lows are forming against descending resistance. Such behaviour reflects balance — buyers are stepping in earlier, but sellers are still defending the upper boundary.
The recent move brings price back toward this key resistance area. The focus here is not on predicting an upside move, but on observing whether price can sustain above the descending trendline. Acceptance above this level would indicate a shift in behaviour, while rejection would keep price rotating inside the structure.
This chart highlights how price reacts at important levels rather than forcing a directional bias.
Patience matters here — structure will decide the next phase

ABB: Descending Structure, Price Testing Acceptance ZoneABB has transitioned from a strong up-move into a corrective phase, where price has been consistently respecting a descending structure. Each attempt to move higher has faced supply near the falling trendline, forming a sequence of lower highs.
At the same time, downside has been supported by a well-defined demand zone, creating a narrowing price range. This shows that sellers are active at resistance, but buyers are still defending lower levels.
The recent move highlights an important point — price is once again testing the upper boundary of this structure. The focus here is not on prediction, but on acceptance versus rejection. Sustained acceptance above the descending trendline would indicate a shift in behavior, while rejection keeps the corrective structure intact.
This chart is about reading how price reacts at structure, not about chasing moves or forcing entries.
What separates my approach is waiting for price behavior to confirm the next phase rather than anticipating it.

#Mtar tech 10-12% coming #Mtar tech 10-12% coming , forming pattern ..smallcap index gaining rebound
use 2200 as stoploss with tgt upto 10-12%
after that new level will be initiated
