SYNGENE A Clean Reversal Structure DevelopingThe stock has been holding a strong support zone near the 600 level again and again. This tells us buyers are quietly defending this area.
Syngene is trying to break out after months of pressure. If buyers push a little more, the stock can easily travel toward the 670+ zone.
This is why this setup is interesting
Beyond Technical Analysis

BANKNIFTY Key Intraday Breakout Level in FocusBankNifty is currently trading just below an important intraday resistance zone around Fifty nine thousand four hundred forty to Fifty nine thousand four hundred sixty.
This level has acted as a supply barrier multiple times, and price is now attempting to reclaim it with improving volume.

M&M Update Price Trading Inside a Contracting WedgeMahindra and Mahindra is currently respecting both the upper and lower boundaries of a contracting wedge pattern on the one hour timeframe.
Each time price approaches the upper trendline, it is being rejected. Each touch on the lower trendline is showing signs of support and buyers stepping in.
This compression shows that the market is preparing for a larger directional move.
A clean breakout above the upper trendline with increasing volume can trigger a short term upward move.
Failure to break out may push the price back towards the lower support zone.

CENTURYPLY Big Structure Breakout After MonthsThe stock was trading inside a large symmetrical triangle
Multiple touchpoints on both trendlines , structure is valid
Price was getting squeezed between
A falling resistance line from the left
A rising demand line from the bottom
This compression created stored energy in the chart
Now, CenturyPly has broken above the falling trendline with strong bullish candles and volume backing the move. This is the first clean breakout after months of consolidation.

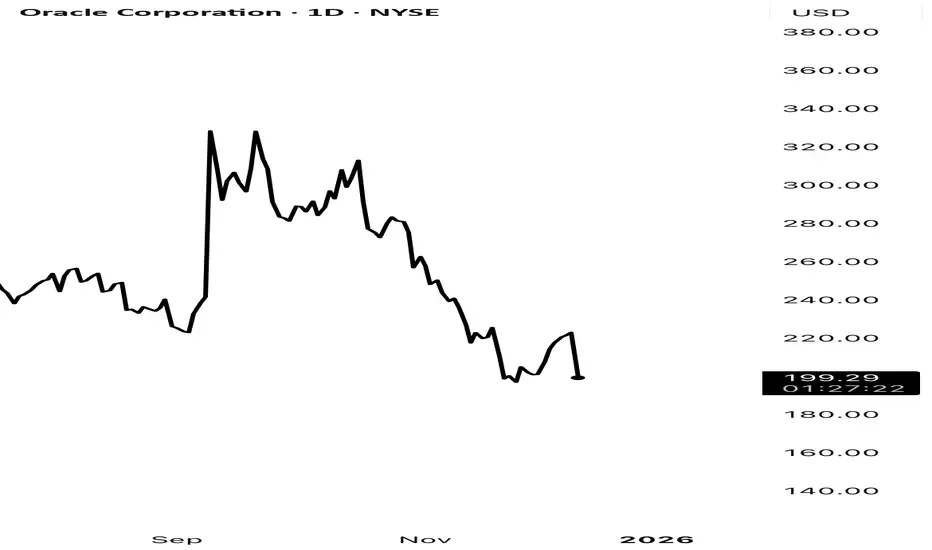
Oracle and the Quiet Warning Nobody Looked AtMost of us watch the stock first and everything else later.
But with Oracle, the first warning didn’t come from the chart at all — it came from the credit market.
A quick explanation for anyone new to this:
A Credit Default Swap (CDS) is just insurance on a company’s debt.
If people feel the company is getting riskier, the cost of that insurance goes up.
That’s it. Nothing fancy.
Over the last year, Oracle’s CDS cost has been climbing way faster than you’d expect for a big, steady name. It wasn’t front-page news, but it was unusual enough to pay attention to.
And then today’s 11% drop happened.
It honestly reminded me of that moment in The Big Short when Burry kept pointing at the CDS market while everyone else stared at the stock prices. He wasn’t predicting a disaster — he just noticed that the credit market was reacting long before the stock market cared.
Oracle isn’t a “Big Short” situation, obviously.
But the pattern is familiar: credit markets usually move first, stocks catch up later .
That’s really all there is to it.
No drama — just a quiet signal finally showing up on the chart.
Disclaimer: Educational only. Not investment advice. DYOR
Nifty 12th Dec OutlookThe last 3 sessions have been strangely quiet. Price barely moved, volume stayed flat, and Nifty just kept hovering inside the same range.
At first glance it looks like typical consolidation…but with everything happening around us, the silence feels a bit more intentional.
Here’s what I’m noticing:
1. Fed cut was priced in, but the market is still digesting the tone
The 25 bps cut wasn’t a surprise. What traders really care about is the Fed’s tone, and that usually takes a day or two to reflect in EM flows like ours. So the muted move here makes sense.
2. Sensex expiry completely distorted intraday behaviour
No one commits serious money on expiry days unless they have to. That explains some of the weird intraday swings and the lack of strong follow-through.
3. The US trade delegation being in India (Dec 10–12) is a bigger factor than people think
Institutions hate uncertainty. If the tone from these meetings affects tariffs, regulations, or market access, it directly impacts exporters and several index-heavy sectors.
So, yes — some funds simply stepped aside until they know what’s happening.
4. Mexico’s unexpected tariff hike (up to 50%) adds another layer
This came out of the blue and hits Indian auto exporters right where it hurts. But… even with that news, Nifty didn’t react violently. That tells me the market is waiting for more clarity, not panicking.
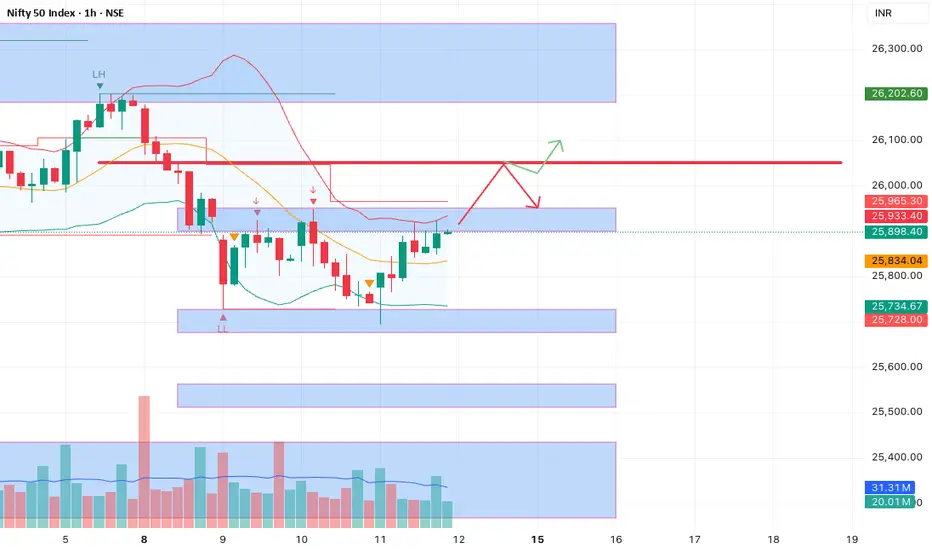
Technical Picture (Daily + 1H): Nothing Broken, Nothing Proven
Price held the 25,700 support beautifully (Fib 0.618)
Price rejected the 25,940–26,050 zone again (Fib 0.382)
Daily RSI bounced from the 50 line, which is normally a bullish behaviour
Volume has been eerily identical for 3 days straight
This is not bullish strength.
This is not bearish weakness.
It’s textbook neutrality until the macro dust settles.
About the Divergences
On the Nifty 1H chart, we had a hidden bearish divergence earlier — but that only signals momentum fatigue, not an immediate fall.
But on GIFT Nifty, we got something more meaningful:
✔ Hidden bullish divergence
✔ Price made a higher low
✔ RSI made a lower low
✔ And then price pushed up strongly
This usually leads to trend continuation, and the futures chart looks clean and confident right now. Not the behaviour of a market preparing for a big dump.
So why is the volume dead?
When multiple moving parts converge — Fed tone, international trade talks, new tariff shocks — institutions don’t gamble.
They stay flat.
They hedge.
They wait.
And the charts show exactly that.
Tomorrow’s Map
If GIFT Nifty stays firm:
→ we likely open slightly green
→ Nifty may try to break the 25,940–26,050 zone
→ A clean close above 26,050 opens 26,120–26,180
If nothing major hits the news:
→ we stay stuck between 25,700 and 25,940
→ the range continues
If negative news comes from trade talks or auto exporters:
→ only then we revisit 25,700
→ and breakdown needs VOLUME, which has been missing
Without volume, bears have no teeth.
My Final Take
The market isn’t weak — it’s cautious.
It isn’t bullish — it’s waiting.
GIFT Nifty looks strong right now, and unless a fresh headline drops overnight, Nifty will likely test the higher end of the range again.
But the real move — the one with conviction — probably comes after Dec 12, once everyone knows where the trade talks and sector implications stand.
Until then, this is not a market to be overly aggressive in either direction.
Nifty formed base to move upward in 26000 trajectoryNifty has formed base today and ready to take everyone surprise by upmove. Expecting a consolidation around 26850 range and then upward move till 26970, consolidating around 26930 and leaping towards 26050+ range. Basically touching earlier support/resistance in previous moves.

The Day I Trusted My Setup - And Finally Found Peace in TradingHello Traders!
Every trader remembers the day they finally stopped fighting the market and started trusting their setup.
Not because the setup became perfect, but because the trader stopped panicking, stopped doubting, and stopped reacting emotionally to every candle.
This post is about that mindset shift.
The shift that quietly turns chaos into clarity.
1. The Problem Was Never the Strategy
Most traders have decent setups, but terrible self-control.
They enter early, exit early, or avoid taking the trade completely.
They blame indicators, brokers, markets, everything except their own fear.
The truth is simple:
Your setup doesn’t fail. Your belief in the setup fails first.
2. The Market Became Peaceful the Day My Mind Did
I stopped questioning every candle.
I stopped comparing my trades to others on social media.
I stopped jumping from one strategy to another.
When the mind becomes quiet, the market stops feeling like a threat.
3. One Setup, Repeated Consistently, Is More Powerful Than 10 Indicators
When you trust your setup, you stop looking for confirmation everywhere else.
Your eyes automatically see the same pattern repeat again and again.
You develop confidence, not from winning, but from understanding.
A trader doesn’t need more tools.
A trader needs one tool they fully trust.
4. Peace Comes From Acceptance, Not Prediction
You stop trying to predict the market.
You stop expecting every trade to win.
You start accepting that your job is execution, not perfection.
Peace is not when trades stop losing
Peace is when losses stop scaring you.
5. Trusting the Setup Automatically Improves Discipline
You follow your entry rules without hesitation.
You respect your stop loss without fighting it.
You let profits run because you no longer fear giving them back.
Discipline is the natural outcome of trust.
Rahul’s Tip:
Your setup doesn’t need to be extraordinary, it just needs to match your personality.
Once you stop jumping strategies and commit to one approach fully, trading becomes quieter, calmer, and finally peaceful.
Conclusion:
The day you trust your setup is the day trading stops feeling like a battle.
You stop chasing the market and start flowing with it.
With clarity, discipline, and trust, profitability becomes a byproduct, not a target.
If this post reflects your trading journey, like it, share your experience, and follow for more psychology-based insights!
Part 9 Trading Master Class With ExpertsRisks in Option Trading Strategies
Options offer flexibility, but risks vary.
1 Premium Decay
Option buyers lose premium rapidly as expiry approaches.
2 Volatility Crush
IV drops after major events → huge loss for long straddle/strangle buyers.
3 Assignment Risk
Short options may be assigned early in American-style options.
4 Unlimited Loss Potential
Selling naked options exposes traders to large losses.

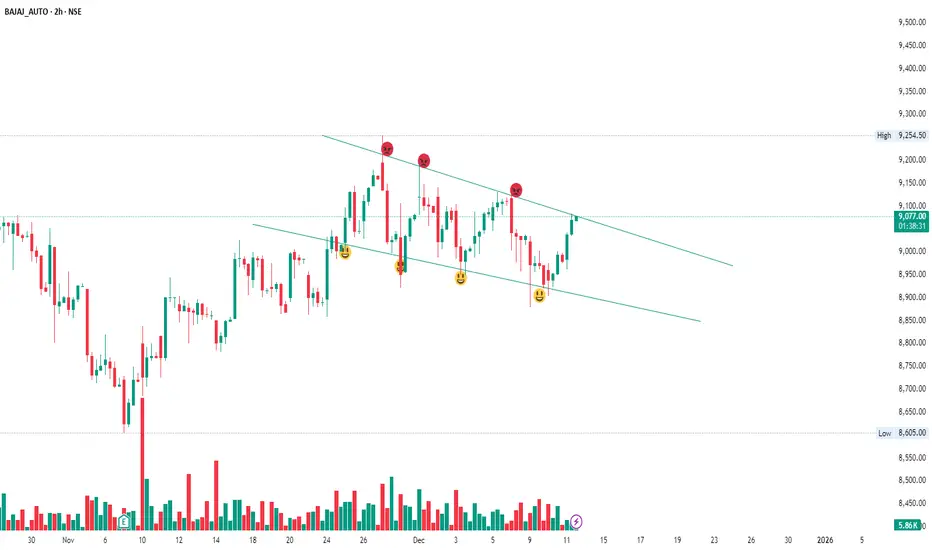
Bajaj Auto – Approaching a Key Breakout Zone Bajaj Auto has been moving inside a falling channel on the 2-hour timeframe. Every time price hits the upper boundary, sellers push it back down, and every time it touches the lower boundary, buyers step in.
This trendline has rejected price multiple times in the past — meaning a breakout will carry weight and can trigger:
Short covering
Fresh long positions
A sharp move toward 9,180 – 9,250 zones
PNBHOUSING – Clean Falling Channel Support Bounce SetupPNB Housing has been trading inside a perfect falling channel.
Price is respecting both the upper resistance and lower support exactly
Every time the stock touches the top line, it drops.
Every time it hits the bottom line, it bounces back up.
Price is back to the falling-channel support.
If buyers react again here, a short-term bounce can play out toward the upper channel.

VOLTAS – Support Touch Inside Rising Channel | Bounce SetupDescription
VOLTAS has been moving inside a rising channel for several months — creating higher highs and higher lows.
Both the top and bottom trendline's are respected multiple times (marked by circles), proving this channel is valid and strong.
Recently:
The stock fell from the top of the channel
Came down and touched the bottom support line again (blue circles at lows)
That support has always given a bounce previously
→ so buyers may step in again here
Also, a small falling channel has formed inside this bigger up-channel.
Price is now breaking out of that smaller falling channel, which hints at a possible bounce start.

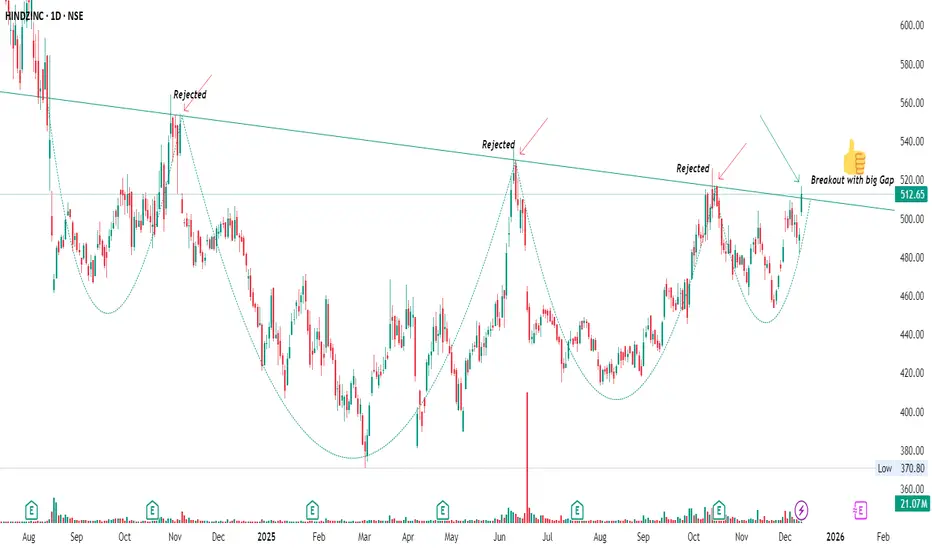
HINDZINC – Major Trendline Breakout with Gap-UpTF: Daily
Status: Fresh Breakout · High Volume · Momentum Building
Buyers have finally overpowered sellers
After 3 major rejections, HINDZINC has finally broken the trendline with a bullish gap-up.
BankNifty – Falling Wedge Breakout Attempt | Short-Term Upside iBankNifty is trading inside a falling wedge structure on the 15-minute timeframe — a pattern that often leads to sharp upside moves once price breaks above the upper trendline.

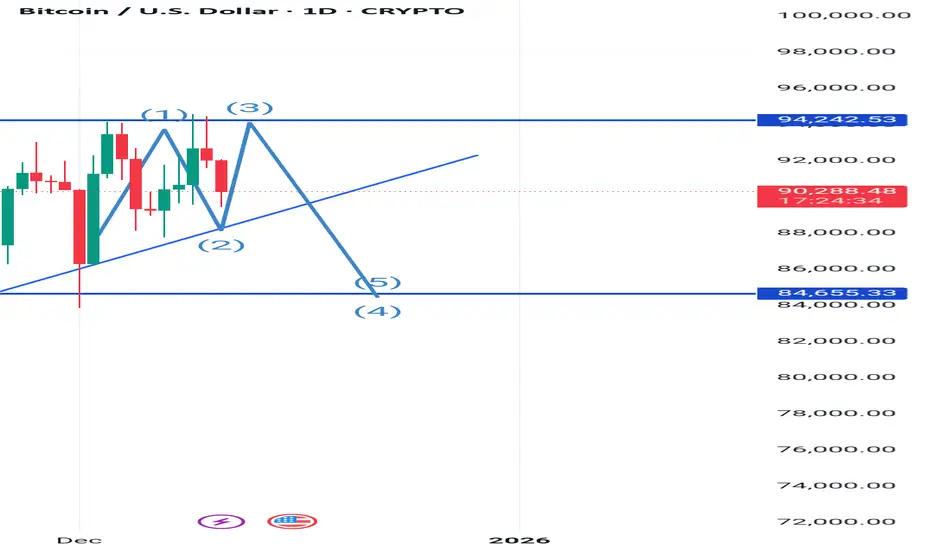
#BTC Showing a good down tredn move keep eye#BTC ON 1D
KEEP AN EYE BELOW 89350 WE CAN SEE BREAKDOWN AND GOOD SELLING MOVE TILL 87000....86000++
Here the logic
89350 is very big support its already tested many times so now its weak so we can see a good down trend move till 86000
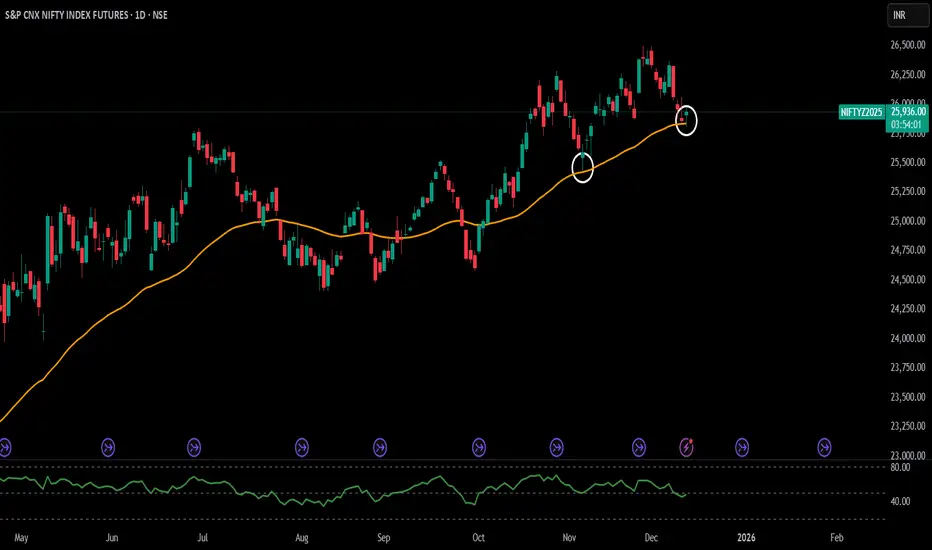
Nifty 50 SpotDate 11.12.2025
Nifty 50 Spot
Timeframe : Day Chart
(1) In the last one month, Nifty touched 50 Ema twice & took sharp bounce
(2) Thats the make or break for now
(3) Stoploss for longs & short intiate on breakdown
Regards,
Ankur
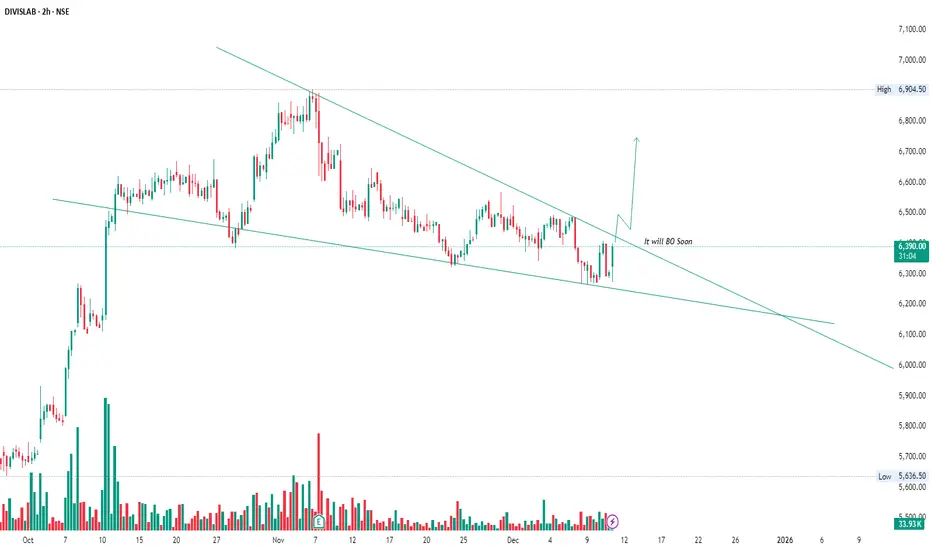
DIVISLAB – Tightening Inside a Falling Wedge | Breakout LoadingDIVISLAB is compressing beautifully inside a falling wedge, one of the strongest bullish reversal patterns.
Price has been making lower highs + higher lows, showing clear contraction. This usually means the stock is getting ready for a decisive move.
LOOKING FOR GOOD SETUP AND TIGHT RANGE NSE:JAMNAAUTO
It has repeatedly rejected resistance at ₹125 on the daily chart. A decisive breakout above ₹125 could trigger strong momentum. The weekly chart also shows bullish patterns, supporting potential swing and short-term gains. With an all-time high breakout likely soon, now's the time to watch closely.
now CMP is 121.80

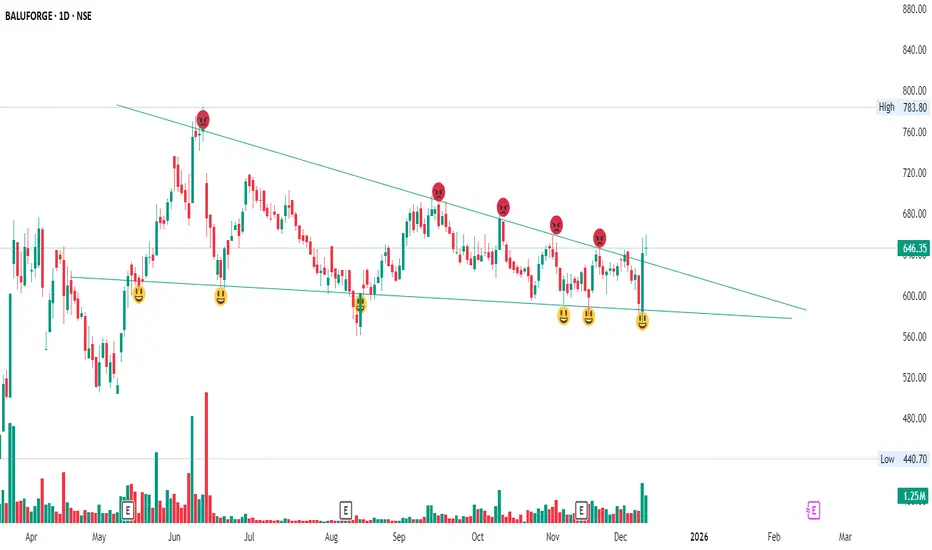
BALUFORGE – Falling Channel Reversal SetupTimeframe: Daily
Price has been moving in a falling channel for months
Every time it touched the upper trendline, sellers became aggressive 😡
Every time it hit the lower trendline, buyers stepped in with confidence 😊
A strong bullish reversal right at the support line — and volume exploded.
This is the first sign that buyers are gaining strength again.
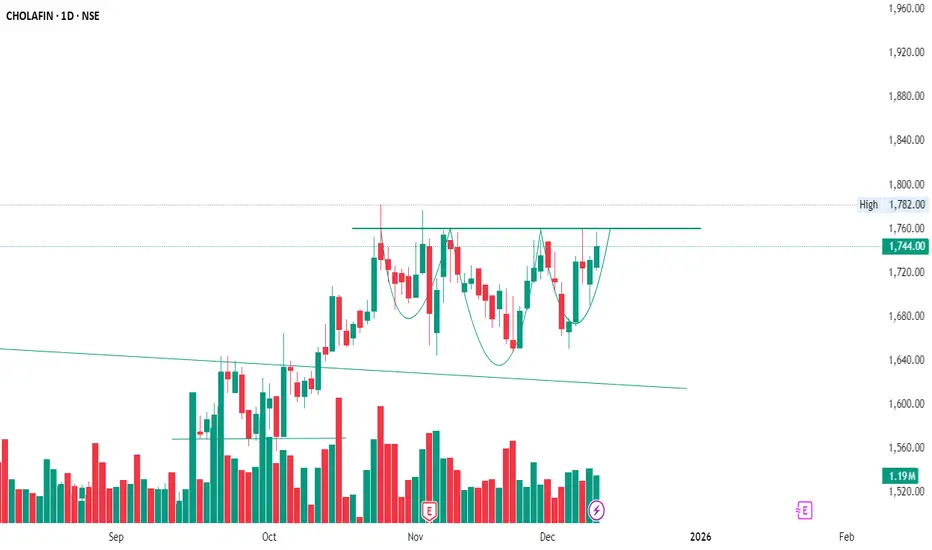
CHOLAFIN- IHNS Pattern ➝ Buyers are accumulating every dip
➝ Sellers are slowly losing control
There is a strong resistance around ₹1,775 – ₹1,785
Price has been rejected here multiple times
Each time, the pullback becomes shallower → buyers getting stronger
Breakout becomes more likely with time.
NZDUSD Short | 15m | Structural Breakdown After ExhaustionNZDUSD showed a clear loss of momentum after an extended upside leg. Price consolidated near the highs with diminishing impulsiveness, forming a distribution-style structure. The break back below the micro-range support confirmed weakness.
The short entry is based on:
• Rejection from the intraday premium zone
• Breakdown of the short-term support level
• Shift in orderflow as buyers failed to sustain higher pricing
Stop placed above the rejection block.
Primary target aligned with the liquidity pool near 0.5773.
This trade reflects a disciplined response to intraday exhaustion and a confirmed structure shift.

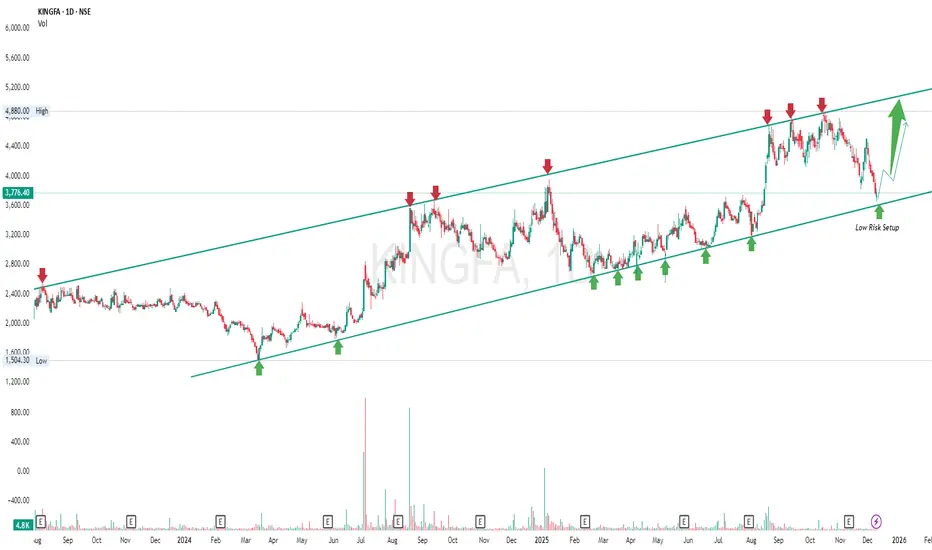
KINGFA – Low-Risk Swing Setup from Channel SupportKINGFA is moving in a well-defined rising channel — making higher highs and higher lows consistently.
Your chart clearly shows:
🔺 Red arrows → Price gets rejected from upper trendline
🟢 Green arrows → Price takes support from lower trendline
This confirms the channel structure is valid and respected for more than a year.
Now price has once again:
✔ Touched the bottom support line
✔ Buyers are reacting from the same zone
✔ Risk is very limited below this support
Because of this, it becomes a Low-Risk Swing Opportunity
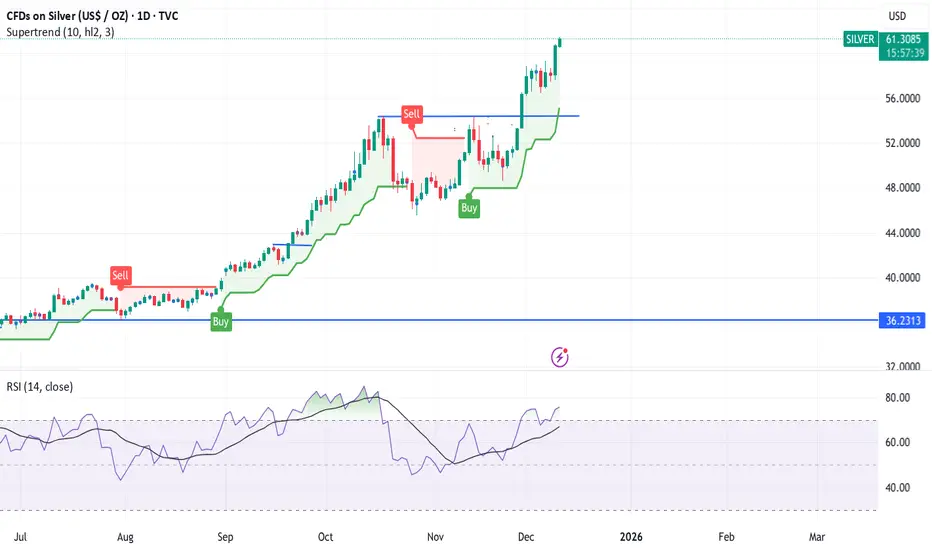
silver update after bulbs rally mcx or cme spotthere are some probability on chart which will briefly discuss.
Silver spot--- yesterday crossed or sweep all liquidity abv 59.40$ or made high 61$ almost ------ still as per gold silver ratio silver looking hot only abv 60-59.80$ up side tgt 62$ intact .or if sustain abv 63.55$ or close abv + weekly close than will see 67-72$ soon. Or if mkt take 63$ hurdle or revert than again down side expect 58$ near in mcx 193000 laxman rekha for silver if sustain abv or close than expect tgt 199-205000+++ no if and but---or if mkt fail to close or hold abv 193000 than down side door open through profit booking till 187-185000++++