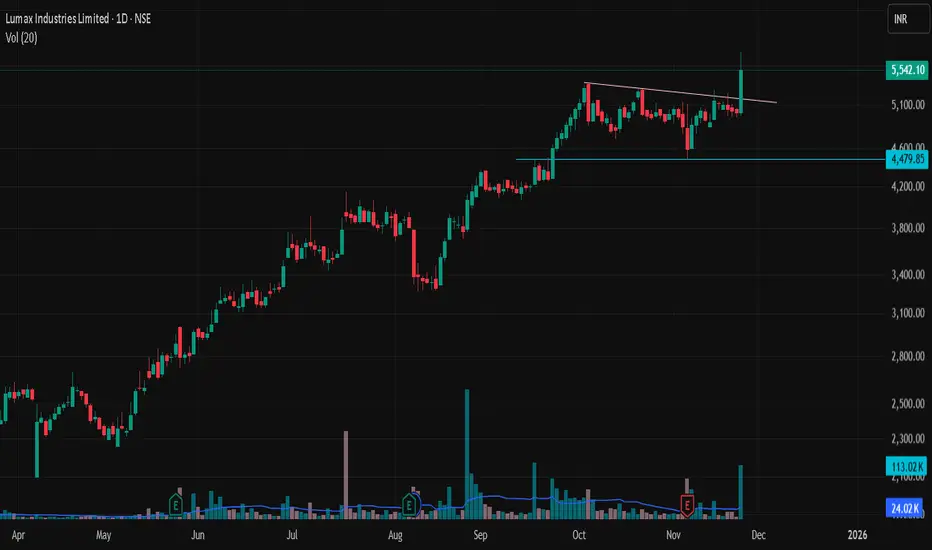
LUMAXIND - continue to rise with rising strength -Positional BuyLUMAXIND
KEY HIGHLIGHTS
good for positional buy
at its all time high
rising strength on strength meter
passes daily and weekly mark minervini trend template criteria
SCORING
Core Fundamentals (Sales + Profit + Margins + ROE/ROCE) – 20% weight
EPS Trend & Consistency – 20% weight
Multi-year EPS breakout & new highs: ~85/100
Institutional Trend (Promoter, FII, DII) – 20% weight
Stable 75% promoter, strong DII build-up, small but rising FII: ~80/100
Technicals / Momentum (Price vs MAs, 1Y performance, RSI) – 40% weight
Strong uptrend, above key MAs, 1Y 142% but some overextension risk: ~80/100
Weighted together, this gives around:
Overall ≈ 81 / 100
Quick Take
Positives
Strong, consistent topline growth (20–25%+).
EPS has broken out post-COVID and is hitting new highs.
ROE/ROCE in high-teens – healthy quality.
DIIs have aggressively accumulated over the last 2 years.
Stock is in a clear technical uptrend, outperforming the market sharply.
Watch-outs
Valuation is rich vs. historical and vs. typical auto-ancillary.
Debt has increased meaningfully to fund growth – fine if cycle stays strong, a risk if it doesn’t.
1-year move (142%) means any small disappointment in future quarters can trigger sharp corrections.
Beyond Technical Analysis
Daily Macro, Market Mood Swings, and the Stories Behind the NoisGlobal Markets: Three’s a Trend
Global stocks pushed higher for a third straight session on Tuesday, fueled by growing confidence that the Federal Reserve will slip in a December rate cut like an early holiday present. U.S. Treasury yields eased as well, giving investors one more reason to feel optimistic — or at least less grumpy.
Wall Street’s Tech Glow-Up
Over on Wall Street, stocks climbed with the help of Silicon Valley’s usual superheroes — Alphabet and Meta. Google’s parent company surged 1.53% to a record close of $323.44, inching closer to the absolutely casual milestone of $4 trillion in market cap.
The Dollar Takes a Tumble
The dollar index dropped 0.44% as weaker-than-expected U.S. data — including September retail sales, core PPI, and ADP employment — boosted bets on a December Fed cut. Add in falling bond yields (with the 10-year sliding to a 3.5-week low of 3.987%), plus consumer confidence hitting a 7-month low, and the dollar had all the reasons it needed to slump politely into a corner. Retail sales rose just 0.2% versus the expected 0.4%, reminding everyone that the American consumer may finally be getting tired of carrying the global economy on their back.
The Fed Repricing Whiplash & Consumer Mood Swings
Markets have repriced December rate-cut expectations with the grace of a roller coaster: from the low 30% range to 90% an hour ago, now cooling at 87%. A month ago? Also 90% — before collapsing and then bouncing back. The main culprit: nonstop Fed commentary, proving once again that “forward guidance” is more of a suggestion than a plan. Meanwhile, fresh U.S. sentiment data didn’t help the mood. The headline index missed badly at 88.7 (vs 93.3 expected), current conditions hit the lowest since 2021, and future expectations slid to their April 2025 low — courtesy of stubborn inflation worries and rising job-income anxiety.
Global Highlights: Gold Glitters, Rupee Stutters & Data Storm Ahead
Germany delivered a flat Q3 GDP print, which, considering last quarter’s contraction, counts as… stability. Gold edged up 0.3% to $4,150.09 as weak retail sales strengthened the case for a December cut. Global equities mostly turned green, shrugging off AI-overinvestment and debt concerns as if the Fed’s 25-bps cut-in-waiting is a magic eraser. India, however, bucked the trend: the Sensex fell 314 points and the Nifty slipped 75. The rupee ended nearly unchanged at 89.22 as importer demand offset regional currency strength.
Today’s data docket is a global buffet — Australia CPI, New Zealand rate decision, Japan’s BoJ core CPI, a heavy U.S. lineup (GDP, durables, core PCE, spending, home sales, jobless claims), plus ECB’s Lagarde and Lane holding the mic in the Eurozone.

Sensex - 84700 CE and PE for expirySir/Mam,
Please buy CE and PE of strike price 84700. For best price wait for the value (-75% of both)
The best time for buying is after 1 PM or breakout points.
Today, it is closed at 84587.01 - It will go upside up to 84700 and then down till 84500 - 84400.
I am bearish if it is below 84800 levels.
Hope you have booked profits in Nifty as I suggested in my previous Idea chart.
Stay safe and keep smiling.
Thank you for taking time to read my ideas and your support really helps me a lot.

Gold Maintains Bullish Momentum,Watching for Breakout Above 4150📊 Market Overview:
Gold is currently trading around 4140. Market sentiment remains tilted toward buying due to expectations of an upcoming Fed rate cut, while the USD shows mild weakening during the session.
📉 Technical Analysis:
• Key resistance: 4150 – 4162
• Nearest support: 4125 – 4130
• EMA: Price is above the EMA-09, indicating the bullish trend is still intact.
• Candlestick / Momentum:
– The 4150 zone is forming a strong resistance; H1 candles show upper wicks → short-term profit-taking pressure.
– If H1 closes above 4150 → gold may extend to 4175 – 4190.
– If it fails, price may retest 4130.
📌 Outlook:
Gold may continue rising if it breaks above 4150 with a confirmed candle.
Otherwise, if it cannot break 4150 in the next 2–3 H1 candles, the market could retrace to 4130 before rising again.
________________________________________
💡 Suggested Trading Strategy:
🔺 BUY XAU/USD
Entry: 4128 – 4132
🎯 TP: 40 / 80 / 200 pips
❌ SL: 4125

NIFTY 50 Nifty could test below white line or 24920 most probably within 27th Nov
if it moves sideways to bearish then it could reach within 8th Dec
Disclaimer:
It's a personal view not a financial advice and I assume no responsibility and liability whatever outcome arises.

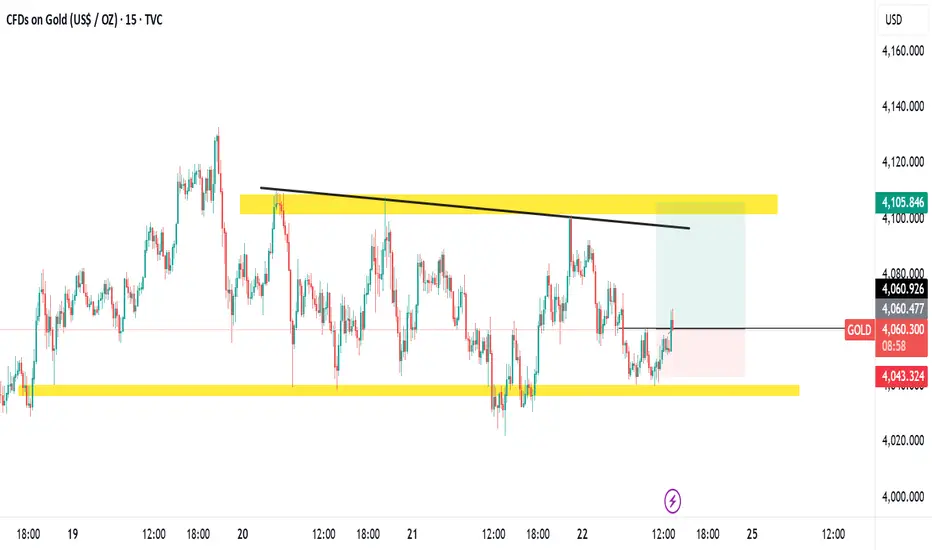
XAU/USD (gold) has achieved the TARGET. As we analyzed before gold was in a Sideways Zone consolidation and upside liquidity was pending to hunt. And also is was trending at the support as well.


Warren Buffett Core Rules for Building Wealth!Hello Traders!
Warren Buffett is known as the “Oracle of Omaha” not because he picks magical stocks, but because he follows timeless principles that build wealth slowly and safely.
His rules are simple, but powerful, and every trader or investor can learn from them.
1. Rule No. 1: Never Lose Money
Buffett’s first rule is all about capital protection.
Before entering any investment, ask one question: “What is my real downside here?”
Building wealth starts with protecting what you already have.
2. Rule No. 2: Never Forget Rule No. 1
Most people break this rule because emotions take over.
They underestimate risk and overestimate their confidence.
A smart investor never lets their guard down.
3. Invest Only in What You Understand
Buffett only invests in businesses he clearly understands.
If you don’t understand how a company makes money, you shouldn’t invest in it.
Confusion always adds risk.
4. Be Fearful When Others Are Greedy, and Greedy When Others Are Fearful
When the crowd is celebrating, assets are usually overpriced.
When the market is in panic, opportunities quietly appear.
A contrarian mindset creates long-term winners.
5. Focus on Long-Term, Not Short-Term Noise
Short-term ups and downs are temporary.
Long-term business growth is what builds real wealth.
Buffett thinks in decades, not months.
6. Buy Great Businesses at a Fair Price
Don’t chase cheap stocks, chase quality.
A great business may look expensive today, but it can reward you for years.
Price is what you pay; value is what you get.
7. Do Not Rely on Market Predictions
Buffett ignores forecasts, experts, and predictions.
He studies the business, not opinions.
You don’t need to predict the market, you need to understand what you own.
8. Build an “Inner Scorecard”
Your decisions should follow your own principles, not public opinion.
Integrity and independence are at the core of Buffett’s philosophy.
Winning long-term requires your own standards.
9. Keep Emotions Out of Money Decisions
Emotional investing leads to guaranteed mistakes.
Patience, discipline, and consistency create long-term winners.
A calm mind makes better decisions.
10. Your Best Investment Is in Yourself
The strongest returns come from your skills, knowledge, and mindset.
Books, learning, and personal development give lifelong compounding.
A smarter you creates better financial choices.
Rahul’s Tip:
Wealth-building is not complicated, staying disciplined is.
Once you start thinking long-term, the market automatically starts rewarding you.
Conclusion:
Buffett’s rules are not just investing rules, they are life rules.
Protect your capital, stay patient, stay disciplined, and invest in becoming better every day.
Wealth grows slowly… until the day it grows suddenly.
If this post helped you understand Buffett’s principles better, like it, share your thoughts in comments, and follow for more timeless wisdom!
Bear - Bulls Fight Nifty ExpirySir/Mam,
Last published Idea worked perfectly to all my viewers/followers.
For tomorrow, if Nifty opens below 25900 < then the levels opens for 25700. For safe Trading buy 26150 PE and CE now it is 200.65 + 15.45 = 216.1
That's it !
Tomorrow expiry, Volume timing as follows -
9.15 - 10.00 am - Price flow
10.00 - 1.45 PM - No Trade zone, watch the market support and resistance.
1.45 - 2.00 PM - Choose best strike price (both CE and PE should be -80 to 85% negative)
2.00 PM - 3.00 PM - Buy CE and PE of same strike price and sell with one side profit.
3.00 PM - 3.30 PM - Just watch the Profit !
Hope you have nice trading day tomorrow.
Stay safe and Take care.

Unlocking the True Secrets of DivergenceRisks in Option Trading
1. Time Decay (Theta)
Premium drops every minute—bad for buyers.
2. Sudden Market Moves
Can destroy option sellers if unhedged.
3. Wrong Strike Selection
Most beginners fail due to improper strike selection.
4. Overtrading
Fast premium movement makes traders impatient.
5. Emotional Trading
Fear and greed amplify mistakes.

BtcBtc i am going long here even higher than this swing high. Will look best place to sell on upper side

Part 2 Introduction to Candlestick PatternsImportant Trading Principles in Options
1. Don’t Buy Far OTM Options
They look cheap but rarely become profitable.
Most expire worthless due to Theta decay.
2. Focus on ATM and Slightly ITM Options
They respond better to price movement.
3. If You Are a Beginner, Avoid Selling Options
Sellers need:
high capital
strict hedging
risk management
psychological control
4. Never Trade Without a View
Options need direction OR volatility.
5. Avoid Holding to Expiry Unless Experienced
Expiry movement is very fast, risky, and unpredictable.

Gold Analysis for upside movement. Gold trading in a sideways zone. buyer's liquidity has already been grabbed. targeting for
sell side pending liquidity.
MARUTI 1 Month Time Frame 📊 Key Metrics
Current price around ₹16,000 region.
One-month return: approximately –2.5% to –3%.
52-week high around ~₹16,660 and low around ~₹10,725.
🔍 Approximate Support & Resistance Levels (1-month timeframe)
From recent charts and technical data:
Immediate resistance: ~ ₹16,172 (R1), then ~ ₹16,368 (R2) and ~ ₹16,585 (R3)
Immediate support: ~ ₹15,759 (S1), then ~ ₹15,542 (S2) and ~ ₹15,346 (S3)
Pivot zone: ~ ₹15,955

Unlock India’s Derivatives Power1. The Rise of Derivatives in India
Derivatives—such as futures, options, and swaps—derive their value from underlying assets like stocks, indices, commodities, currencies, and interest rates. India’s derivatives journey began in the early 2000s when SEBI introduced index derivatives to modernize capital markets and reduce speculation in cash segments. Over time, the market matured, attracting domestic retail traders, institutional investors like mutual funds, FPIs, and corporate hedgers.
Today, the Indian derivatives market on the NSE and BSE records billions of dollars worth of contracts daily, with index options (especially Nifty and Bank Nifty) leading global volumes. The democratization of trading platforms, reduction of brokerage costs, and increased financial literacy have further strengthened participation.
2. Why Derivatives Matter for India’s Financial System
Unlocking India’s derivatives power requires recognizing the major roles derivatives play:
a. Risk Management
Derivatives allow traders and businesses to hedge against price volatility in stocks, commodities, interest rates, and currencies.
For example:
A gold importer hedges price movements using MCX gold futures.
A portfolio manager uses Nifty options to guard against market downturns.
This reduces uncertainties in business operations and enhances economic stability.
b. Price Discovery
Futures markets incorporate expectations about future prices, interest rates, demand changes, and macroeconomic events.
For example:
Rising crude oil futures may signal anticipated geopolitical tensions.
Falling index futures may reflect market caution before major policy announcements.
Thus, derivatives become a leading indicator for spot markets.
c. Liquidity Enhancement
The derivatives market trades massive volumes daily, which increases liquidity. High liquidity ensures:
Low transaction costs
Tight bid-ask spreads
Efficient entry and exit
This attracts even more participants, creating a virtuous growth cycle.
d. Leveraged Opportunities
Derivatives allow exposure to large positions with a small margin.
However, leverage is double-edged—working for and against traders. Proper risk discipline is essential.
3. Key Segments Driving India’s Derivatives Strength
a. Equity Derivatives
These dominate India’s markets.
Index Options
Nifty and Bank Nifty options are the backbone of derivatives trading.
Advantages:
Deep liquidity
Lower manipulation risk
Suitable for hedging and speculation
Single Stock Futures and Options
Used heavily by institutional players.
b. Currency Derivatives
India’s growing global trade and foreign investments make currency futures vital for:
Exporters hedging USD/INR or EUR/INR
Importers mitigating forex risk
Traders capturing arbitrage opportunities
c. Commodity Derivatives
MCX, NCDEX, and BEE provide platforms for commodity futures across:
Metals (gold, silver, aluminium)
Energy (crude oil, natural gas)
Agriculture (soybean, cotton, sugar)
This reduces volatility for farmers, industries, and logistics players.
d. Interest Rate Derivatives (IRD)
This segment supports:
Banks
NBFCs
Corporate treasuries
IRD helps stabilize bond markets and strengthen monetary policy transmission.
4. Technological Drivers Unlocking India’s Derivative Power
India’s derivatives boom is heavily powered by technology:
a. High-Speed Trading Platforms
Advanced order-matching engines on NSE and BSE allow microsecond-level execution.
b. Algorithmic and Quant Trading
AI and mathematical models enable:
Auto-trading systems
Statistical arbitrage
Options strategies like iron condors, butterflies, spreads
These bring efficiency and sophistication.
c. Mobile Trading Revolution
Retail participation surged due to:
Zero-commission brokers
Mobile trading apps
Real-time charts and indicators
This democratizes access to derivatives for small investors.
d. Big Data Analytics
Traders now rely on:
Options chain analytics
Market depth
Implied volatility indicators
Open interest interpretation
These help decode market sentiment.
5. How Policy and Regulation Support Derivative Market Growth
a. SEBI’s Robust Regulatory Framework
SEBI ensures transparency, limits manipulation, and protects investors through:
Strict margining systems
Daily settlement
Position limits
Surveillance mechanisms
b. Stock Exchanges’ Risk-Management Systems
NSE and BSE maintain:
Real-time risk monitoring
Market-wide circuit breakers
SPAN and peak margins
These prevent destabilizing events.
c. Government Initiatives
Reforms supporting derivatives growth:
Unified market regulator
Introduction of new derivative products
Increased FPI limits
Commodity market integration with mainstream markets
6. Retail Traders: The New Power in Indian Derivatives
Retail traders now form a major part of index options volume due to:
a. Low Capital Requirements
Options require very low capital at entry compared to futures.
b. Easy-to-use platforms
Everything from charting to algo tools is readily accessible.
c. Increasing financial education
YouTube channels, apps, and online courses fuel interest.
d. Popular intraday strategies
Like:
ATM/OTM straddle-strangle
Trend-following options
Breakout futures trading
Open interest analysis
Retail participation expands market depth and liquidity.
7. Challenges Before India Fully Unlocks Derivatives Power
India must overcome several hurdles:
a. Over-Speculation Risk
Excessive speculation in weekly options can lead to:
High losses for inexperienced traders
Market volatility
b. Low Understanding of Risks
Many traders jump into derivatives without:
Risk management
Position sizing
Stop-loss planning
Education is crucial.
c. Limited Institutional Depth
While retail dominates volume, institutional participation in options is still evolving.
d. Regulatory Overhang
Frequent rule changes (like margin norms) sometimes disrupt traders.
8. The Future: Where India’s Derivatives Market Is Heading
The next decade promises massive growth through:
a. Introduction of New Products
More sectoral index derivatives
Long-term options
Interest rate swaps
Commodity options expansion
b. Retail + Institutional Balance
A healthier mix of FPIs, DIIs, and retail will bring stability.
c. Global Integration
India may become a major derivatives hub like:
Chicago
London
Singapore
d. AI-Driven Derivatives Trading
AI systems will automate:
Strategy generation
Position management
Sentiment analysis
This transforms how derivatives are traded.
Conclusion
Unlocking India’s derivatives power is not just about trading; it is about strengthening the entire financial ecosystem. Derivatives offer tools for hedging, speculation, price discovery, and economic stability. With technological innovation, rising retail participation, strong regulation, and diversified product offerings, India is positioned to become a global leader in derivatives.
For traders, investors, businesses, and policymakers, understanding derivatives is essential for navigating and benefiting from India’s fast-evolving markets. As the country continues to grow economically and digitally, derivatives will play a central role in shaping the next era of financial empowerment.

IPO Mania – The Emotional Trap That Costs Crores!Hello Traders!
Whenever a big IPO hits the market, excitement spreads across India like wildfire.
You’ll hear people in offices, metros, and even chai stalls saying:
“Bhai, isme allotment mil gaya toh life ban jayegi!”
But behind the hype, most people forget one simple truth, IPOs are more psychological than financial.
This is why IPO mania traps thousands of investors every year.
1. The Illusion of Guaranteed Profit
Most new investors believe every IPO will list at a premium.
They confuse “subscription numbers” with “profit certainty.”
In reality, even heavily subscribed IPOs can list at a loss.
Hype does not equal returns.
But emotions make it feel like a sure-shot win.
2. Fear of Missing Out, India’s Biggest IPO Problem
When a big brand launches an IPO, everyone wants a piece of it.
People don’t analyse profits, cash flow, or debt, they buy because the crowd is buying.
This FOMO is what leads to overpriced valuations and poor listing performance.
If you enter because “everyone else is excited,” you’re already late.
3. The Oversubscription Trap
Retail sees 20x–50x subscription and thinks it guarantees listing gains.
But heavy oversubscription means demand is emotional, not rational.
Often, the listing day profit goes to institutional players, while retail gets stuck in pullbacks.
Oversubscription tells you one thing: the crowd is emotional, not smart.
4. When You Pay for the Brand, Not the Business
IPOs of famous companies attract blind buyers who trust the “brand name” more than the balance sheet.
But the price you pay on IPO day is usually the highest price the company has ever been valued at.
You’re paying for the story, not the actual numbers.
Brand popularity doesn't guarantee long-term returns.
5. How IPO Mania Costs Crores Every Year
Retail traders enter at peak excitement and exit at peak fear.
Most IPO investors sell at the first sight of red, turning temporary corrections into permanent losses.
Millions of rupees vanish each year because people trade IPOs emotionally, not strategically
The market punishes emotional decisions, especially in IPO season.
Rahul’s Tip:
Treat IPOs like any other investment, check fundamentals, valuation, debt, promoter quality, and long-term stability.
If you buy just because it’s “new,” you’re not investing, you’re gambling.
Conclusion:
IPOs are not guaranteed money machines.
They’re emotional traps disguised as opportunities.
If you learn to stay calm when the crowd gets excited, you’ll avoid the biggest IPO mistakes and protect your capital.
If this post opened your eyes to the reality behind IPO hype, like it, comment your thoughts, and follow for more honest trading psychology insights!

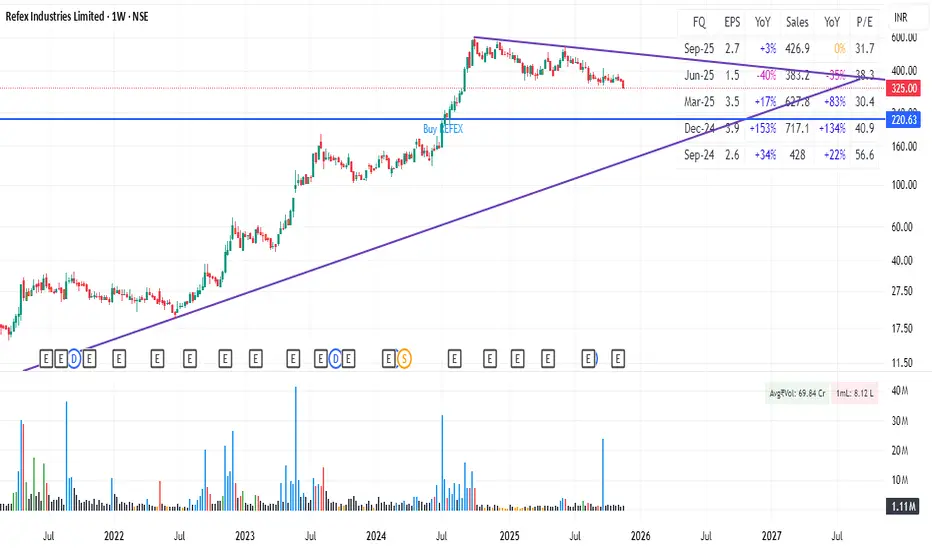
A DIRTY SCAM - DECODED BY GOOGLE GEMINI AIThe connection between Refex Industries and Gensol Engineering is not just a random business deal; it traces back to a tight-knit relationship between their promoters and a failed attempt to "bail out" Gensol from its mounting debt crisis.
The "smoking gun" is a specific transaction in early 2025 that was announced and then abruptly cancelled when regulatory heat increased.
The "Rescue Act" Chronology
1. The Personal Link (The Foundation)
The Players: Anmol Singh Jaggi (Promoter of Gensol & BluSmart) and Anil Jain (MD of Refex Industries).
The Connection: Anil Jain was an early angel investor in BluSmart, the ride-hailing app founded by the Jaggi brothers.
The Business: Refex Industries (via its subsidiary Refex Green Mobility) was already a vendor to BluSmart, leasing over 1,000 electric cars to them. This created a symbiotic relationship: Gensol made the cars (allegedly), and Refex leased them to the Jaggi brothers' other company, BluSmart.
2. The "Bailout" Attempt (January 16, 2025)
The Crisis: By late 2024, Gensol was drowning in debt and facing questions about "missing" EV assets. They needed to get debt off their books fast.
The Deal: Gensol announced it would sell 2,997 EVs to Refex Green Mobility.
The Catch: Refex wouldn't just pay cash; they agreed to take over ₹315 Crore of Gensol's loan liabilities.
The Optic: This would have instantly cleaned up Gensol's balance sheet, making it look debt-light to investors. Gensol stock jumped 7% on this news.
3. The Cancellation & SEBI Probe (March 28, 2025)
The Trigger: SEBI’s investigation deepened. The regulator found that Gensol had taken loans for 6,400 cars but only physically bought ~4,704. The "missing" cars were a major red flag.
The U-Turn: On March 28, just days before the SEBI interim order, Refex and Gensol "mutually cancelled" the deal.
The Result: Refex walked away safe. Gensol was left holding the toxic debt and the "ghost" assets. Gensol stock crashed 5% immediately.
The Verdict: Is Refex "Dirty"?
While Gensol is the primary offender (accused of fraud/diversion), Refex’s role raises valid concerns about Capital Allocation.
The "Friendly" Risk: Refex management was willing to take on ₹300Cr+ of debt from a related party (where their MD is an investor) just to help them out. This is a classic "Corporate Governance" yellow flag—using public company money to help a friend’s distressed company.
The Saver: To their credit, Refex did back out before the deal closed, protecting their shareholders from the actual loss. This suggests they have a "kill switch" when risks get too high, unlike Gensol.
Actionable Insight for You
Gensol: Uninvestable. The "missing cars" and SEBI ban on promoters are fatal flaws.
Refex: Watch with Caution. They are not "fraudulent" like Gensol, but their willingness to entertain such a risky deal suggests their Board might be too cozy with the Jaggi ecosystem. If you own Refex, monitor their Related Party Transactions closely in the next quarterly report.
$btc bitcoin All TARGET & resistance LEVEL 2025-2026
bitcoin Support/Resistance & all future TARGET level marked.
If you are here before Christmas, happy Profit Trailing :)
If you know, You know
want to Learn: Join X & let's conect

Bearish Nifty ExpirySir/Mam,
My view for this expiry is bearish. "Buy ONLY PE"
Buy PE whenever it goes up. You will see the levels crossing below 26000 and 25800 till Tuesday.
"MARK MY WORDS"
For safe Option Traders buy CE and PE of strike price 26200 which is approx. 177+50 = 227. Book profit - 250 (23 points) 100%
Get back to me with your comments if this goes accordingly.
Stay safe and healthy.

price action for Aether Industries Ltd on a weekly timeframe.The above chart shows price action for Aether Industries Ltd on a weekly timeframe.
Trend Analysis
The stock is trading within a clear descending channel, marked by upper and lower parallel trend lines.
The current price action shows a significant bullish move, with the latest weekly candle closing strongly near the channel's upper resistance.
Key Levels
Immediate resistance is seen near ₹960, where the price touches the upper boundary of the descending channel.
Above this, potential breakout levels are indicated at ₹1,071 and ₹1,209 as marked horizontal lines. These can act as future resistance if the channel breakout holds.
Support levels are at the lower boundary of the channel, found near ₹705.
Momentum and Volume
The sharp 9.59% gain this week, with volume at 2.76 million, suggests strong buying interest, possibly signaling a test of the channel resistance.
Sustained volume above the channel could confirm a bullish breakout and open up targets at ₹1,071 and ₹1,209.
Outlook
Watch for price reaction at the ₹960 channel resistance. A breakout and weekly close above this could indicate a trend reversal with upside targets.
If rejected, price may revert to range-trading within the channel, with support near ₹705.
This analysis strictly relies on price structure and does not account for fundamentals or news events.

technical analysis of Anupam Rasayan India Ltd.The below chart shows the technical analysis of Anupam Rasayan India Ltd.
. The chart indicates a strong bullish breakout above a consolidation zone, with a projection toward higher price levels.
Key Technical Features
The stock broke out of a long-term resistance zone around ₹1,100-₹1,250, turning this area into a new support.
There was a significant price surge (+16%) with high trading volume, confirming bullish momentum.
The price action successfully overcame the downtrend channel and multi-month resistance, which historically acted as a selling area.
Support and Resistance Levels
New support is established near ₹1,100-₹1,250.
Next resistance is projected near ₹1,300-₹1,400, as marked by previous supply zones.
If the price sustains above the breakout region, further upside is probable.
Future Price Projection
The annotated green arrow suggests a bullish price target above ₹1,500, possibly reaching ₹1,700 if momentum continues.
A retest of the breakout zone is possible before further upward movement.
Trend Summary
The overall trend is now bullish, with the higher highs and higher lows formation resuming.
Technical signals support the continuation of the uptrend, provided the price remains above key support.

BTC SELL SIDE TRADE WHY? BTC sell side trade
* why choose to sell?
* All over trend is sell side.There was 1hr -ve POI. we required to make sure in smaller time frame as well, in 15 mins three was a Liquidity cluster, so hit all sell side people, and that we want.
* In 1min time frame there was trendline breakout as well structure break.
* so we took sell trade and target would be nearest liquidity as we discussed online.
thanks

Nifty - 150 number LogicSir/Mam,
The market specially options are very hard to book profits as we have to be very clever of the NUMBERS GAME - 150
Let me make it clear as we all know the Nifty closing 26068.15. We need to keep 26050 CE and PE in your watchlist. Buy when both calculated value comes 150 or below (CE + PE) for e.g. now it is - 116+92 = 208 wait until it comes near - 150. Maybe it will come on Monday or Tuesday, you will have chunk of profit of sure.
Option trading is just a number which we need to capture it perfectly. The chart is just to make traders distract from the fear of upside or downside. The real trading is in the value which you buy and sell.
Agree that some make profit and loss. But when you have the correct number caught up then it is hard to get loss in it.
Now let's jump to Chart what we can visualize from that is,
26200 - Sell Zone
26050 - Not to Trade Zone
25900 - Support Zone
The above is levels where all traders get panic. So, we have to be smart to buy CE and PE as discussed above. When market comes to that level the values changed horribly as the value keep on changing to know the interest of the buyers and sellers at this point only levels get running upside or downside.
Sharing this idea, which is beyond logic, but this is best way to earn profit and to stay in Option Trading for coming days.
Hope you will like this idea.
Thanks for taking time.
