Banknifty Structure Analysis & Trade Plan: 28th October4-Hour Chart (Macro Trend)
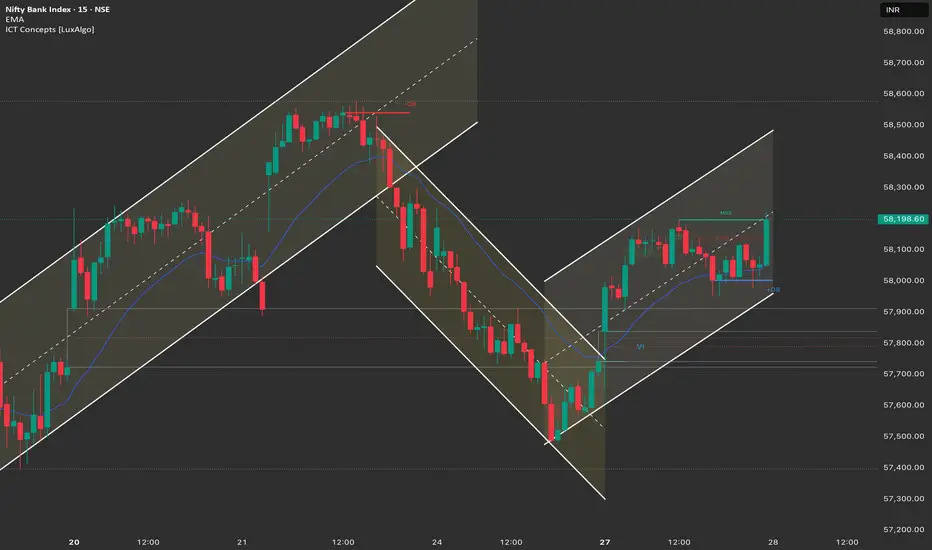
Structure: The Bank Nifty is back in a Strong Bullish Momentum phase. The price successfully found strong buying interest at the lower trendline of the corrective channel on Monday (Oct 27) and has surged higher, reclaiming the previous supply zone. The structure is now trading within a newly established ascending channel.
Key Levels:
Major Supply (Resistance): 58,500 - 58,600. This area (the ATH of 58,577) is the immediate overhead hurdle. A decisive breakout above this level is critical.
Major Demand (Support): 57,600 - 57,800. This area, which aligns with the lower channel trendline and the strong momentum start point, is the must-hold level for the short-term uptrend.
Outlook: The bias is Strongly Bullish. The market is poised to challenge the All-Time High.
1-Hour Chart (Intermediate View)
Structure: The 1H chart shows a clear V-shaped recovery and a Break of Structure (MSS) back to the upside, following the successful defense of the 57,400 low. The price has reclaimed the 9-period EMA and is now trading strongly within the new ascending channel.
Key Levels:
Immediate Resistance: 58,300 (Upper channel boundary).
Immediate Support: 57,800 (Recent consolidation support/lower channel boundary).
15-Minute Chart (Intraday View)
Structure: The 15M chart confirms the strong reversal. The price is trading at the upper end of the daily range, forming a small bullish consolidation right below the upper channel trendline, suggesting immediate follow-through strength is likely.
Key Levels:
Intraday Supply: 58,300.
Intraday Demand: 57,900 (Recent consolidation zone).
Outlook: Aggressively Bullish.
📈 Structure Analysis & Trade Plan: 28th October
Market Outlook: Bank Nifty has shown massive resilience, completely negating Friday's correction. The focus is on a breakout above the ATH.
Bullish Scenario (Primary Plan: Continuation)
Justification: The successful retest of support and resumption of momentum strongly favors a continuation towards the ATH.
Entry: Long entry on a decisive break and 15-minute candle close above 58,300 (breaking the upper channel). Alternatively, look for a dip entry near 57,800 - 57,900 (the immediate support zone).
Stop Loss (SL): Place a stop loss below 57,600 (below the previous day's swing low).
Targets:
T1: 58,577 (All-Time High retest).
T2: 59,000 (Psychological extension target).
Bearish Scenario (Counter-Trend/Reversal)
Justification: High-risk. Only valid if the rally fails aggressively at the 58,300 mark.
Trigger: A sustained break and 1-hour close back below 57,600.
Entry: Short entry below 57,600.
Stop Loss (SL): Above 58,000.
Targets:
T1: 57,300 (Major FVG support).
T2: 57,000 (Psychological support).
Key Levels for Observation:
Immediate Decision Point: 57,800 - 58,300 zone.
Bullish Confirmation: Sustained trade above 58,300.
Bearish Warning: A move below 57,600.
Line in the Sand: 57,500.
Note: New, reduced lot sizes for Bank Nifty futures and options come into effect today (Oct 28) for the Jan 2026 expiry onwards.
Beyond Technical Analysis
Nifty Structure Analysis & Trade Plan: 28th October4-Hour Chart (Macro Trend)
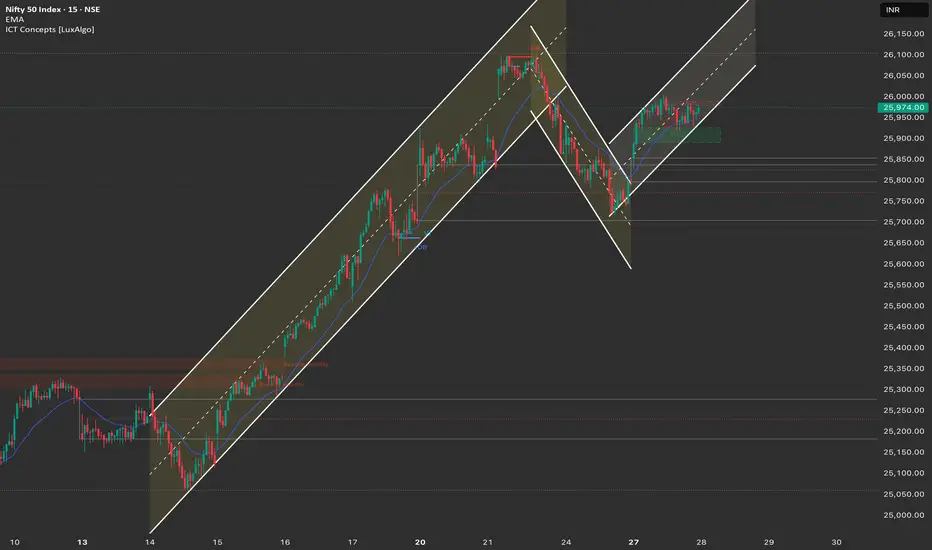
Structure: The Nifty is back in its Bullish Momentum phase. The price successfully found strong buying interest at the lower trendline of the steep ascending channel (the point of the rejection on Friday's chart). The current price action indicates a successful retest and bounce, reversing the corrective sentiment.
Key Levels:
Major Supply (Resistance): 26,100 - 26,200. This area encompasses the recent high and is the critical hurdle. A decisive breakout above 26,100 would target the ATH of 26,277.
Major Demand (Support): 25,600 - 25,750. This area, which includes the lower channel trendline and a strong FVG (Fair Value Gap), is the must-hold level for the overall bullish trend.
Outlook: The bias is Strongly Bullish. The market is poised to re-challenge the 26,000 - 26,100 resistance band.
1-Hour Chart (Intermediate View)
Structure: The 1H chart shows a clear Break of Structure (MSS) back to the upside, following the successful defense of the lower channel boundary. The price has reclaimed the 9-period EMA and is now trading in a fresh, steep ascending channel.
Key Levels:
Immediate Resistance: 26,000 (Psychological mark and immediate high).
Immediate Support: 25,850 (Recent consolidation support/lower channel boundary).
15-Minute Chart (Intraday View)
Structure: The 15M chart confirms the reversal, showing a V-shaped recovery from the Friday low. The price is currently trading at the upper end of the daily range, setting up for a strong open.
Key Levels:
Intraday Supply: 26,000 - 26,050.
Intraday Demand: 25,850 - 25,900.
Outlook: Aggressively Bullish.
📈 Structure Analysis & Trade Plan: 28th October
Market Outlook: Nifty has shown strong resilience, negating Friday's bearishness. The primary strategy will be to buy on continuation/dips to capitalize on the resumed bullish momentum.
Bullish Scenario (Primary Plan: Continuation)
Justification: The strong V-shaped recovery and the successful defense of the macro support favor continuation toward the ATH.
Entry: Long entry on a decisive break and 15-minute candle close above 26,000. Alternatively, look for a dip entry near 25,850 - 25,900 (the immediate support zone).
Stop Loss (SL): Place a stop loss below 25,750 (below the key intraday swing low).
Targets:
T1: 26,100 (Recent swing high).
T2: 26,277 (All-Time High).
Bearish Scenario (Counter-Trend/Reversal)
Justification: High-risk. Only valid if the market fails aggressively at the 26,000 mark.
Trigger: A sustained break and 1-hour close back below 25,800.
Entry: Short entry below 25,800.
Stop Loss (SL): Above 25,950.
Targets:
T1: 25,650 (Lower channel support/FVG).
T2: 25,500 (Major weekly support).
Key Levels for Observation:
Immediate Decision Point: 25,900 - 26,000 zone.
Bullish Confirmation: Sustained trade above 26,000.
Bearish Warning: A move below 25,800.
Line in the Sand: 25,750. Below this level, the short-term bullish bias is nullified.
DABUR INDIA – AT A CRUCIAL SUPPORT ZONE1. Company Overview
Dabur India Ltd is one of India’s leading FMCG companies with deep roots in Ayurveda and natural healthcare.
It operates across Home Care, Personal Care, Healthcare, and Foods, serving both domestic and international markets.
The company’s ongoing strategy focuses on rural distribution expansion, premiumisation of products, and margin improvement through operational efficiency and cost control.
2. Technical Analysis
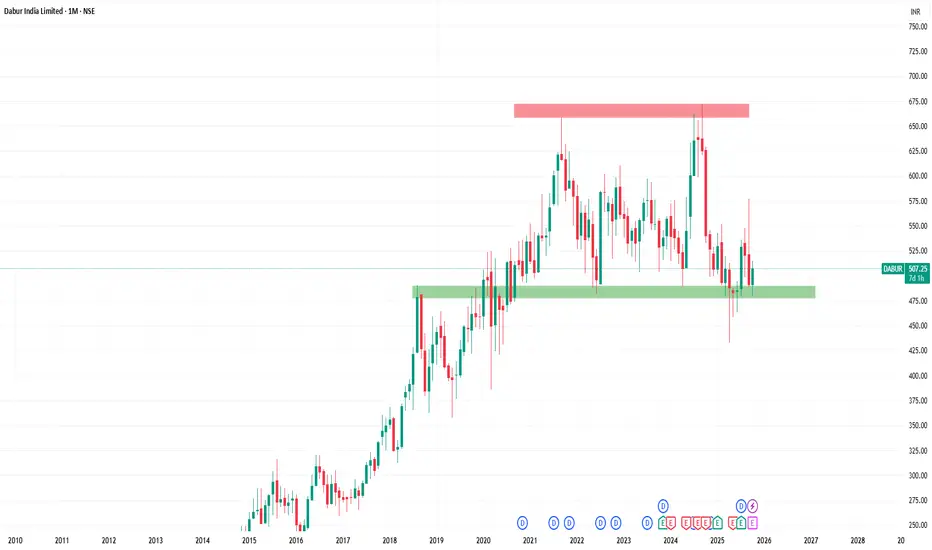
On the monthly timeframe, Dabur’s long-term trend shows a strong up-move — from below ₹10 in 2001 to an all-time high of ₹658 in 2021.
Since 2021, the ₹658–₹672 zone has acted as a major resistance, while the ₹470–₹490 zone has consistently provided strong support.
The same zone, which acted as resistance in 2018, has now turned into a demand zone.
Currently, the stock is trading around ₹511, exactly near the support region and showing signs of reversal from the demand zone.
Projection & Key Levels:
If Q2 FY 2025–26 results come positive, the stock may move toward:
1st Target: ₹550
2nd Target: ₹600
3rd Target: ₹650
However, if this zone fails to sustain, there should be no further expectations, as the maximum swing low lies near ₹430.
This gives a clear roadmap for both upside potential and downside risk.
3. Financial & Fundamental Analysis (FY 2024–25)
Revenue (FY 2024–25): ₹ 12,563 crore vs ₹ 12,404 crore in FY 2023–24 (+1.3% YoY)
Net Profit (FY 2024–25): ₹ 1,740 crore vs ₹ 1,811 crore in FY 2023–24 (–3.9% YoY)
Revenue growth remained modest, while profit declined slightly due to margin pressures and cost factors.
Q1 FY 2025–26: Reported steady performance with stable volumes and controlled expenses.
Q2 FY 2025–26: Yet to be declared — this quarter will be crucial in deciding near-term price direction.
Debt Levels: Long-term borrowings have continued to decline, reflecting financial discipline and improved leverage.
Valuation: Dabur trades at a moderate premium to the FMCG sector average due to its strong brand portfolio and steady financial track record.
4. Technical Indicators Summary
RSI (14): ~63 — showing underlying strength, not overbought.
MACD: In buy mode, supporting short-term bullish sentiment.
Moving Averages:
MA 50 – ₹ 495
MA 100 – ₹ 492
MA 200 – ₹ 510 (currently acting as short-term resistance)
Support Zone: ₹ 470 – ₹ 490
Resistance Zone: ₹ 658 – ₹ 672
5. Combined View — Technicals + Fundamentals
Technically, the stock is taking support at a strong demand zone with clear upside potential if the next results are favorable.
Fundamentally, Dabur remains financially stable with a robust brand base and controlled debt.
A positive Q2 FY 2025–26 can act as a catalyst for a rally toward ₹ 550 / ₹ 600 / ₹ 650, whereas a break below ₹ 470 may extend the fall toward ₹430.
6. Conclusion
Dabur India stands as a fundamentally strong and technically interesting setup within the FMCG space.
The stock is trading near a long-term support zone, offering a good risk–reward setup for investors.
If Q2 FY 2025–26 results are strong, the stock may begin a fresh upward leg toward ₹ 650 levels.
Conversely, if the stock breaks below ₹ 470, the trend may remain weak toward the ₹ 430 zone.
For long-term investors, this zone offers a strategic accumulation opportunity backed by stability, strong distribution, and consistent brand power.
Disclaimer: aliceblueonline.com
Corrective Rise Up | Daily chartBitcoin seems to be forming a diametric pattern and we've entered Wave F
Wave F itself will be a corrective leg and is related in price to Wave B.
Long positions could be taken on dips.
The move will be invalidated below 103,500

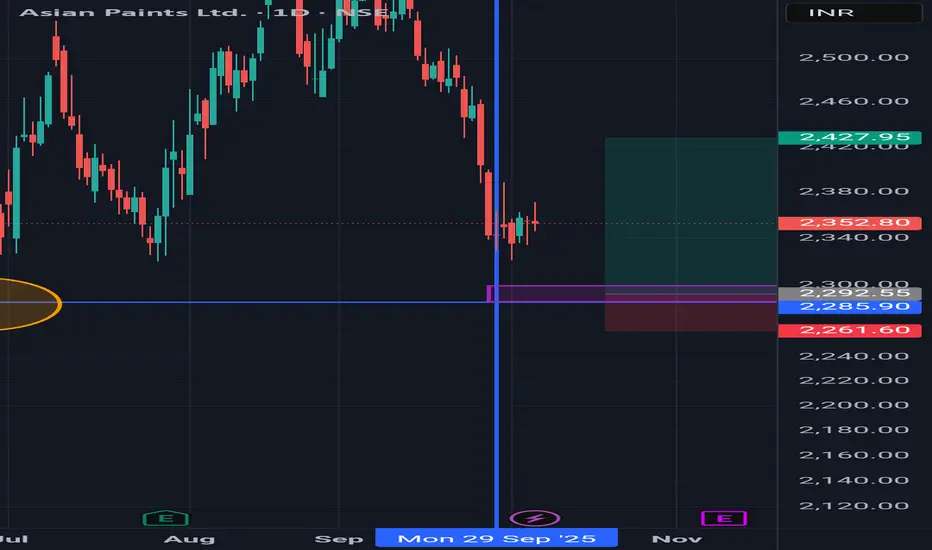
Asian Paints- Buy limit orders I don't want to write long story to describe the idea.
Simple institutional interest can push the price upside for sometime.
This is not a long term idea.
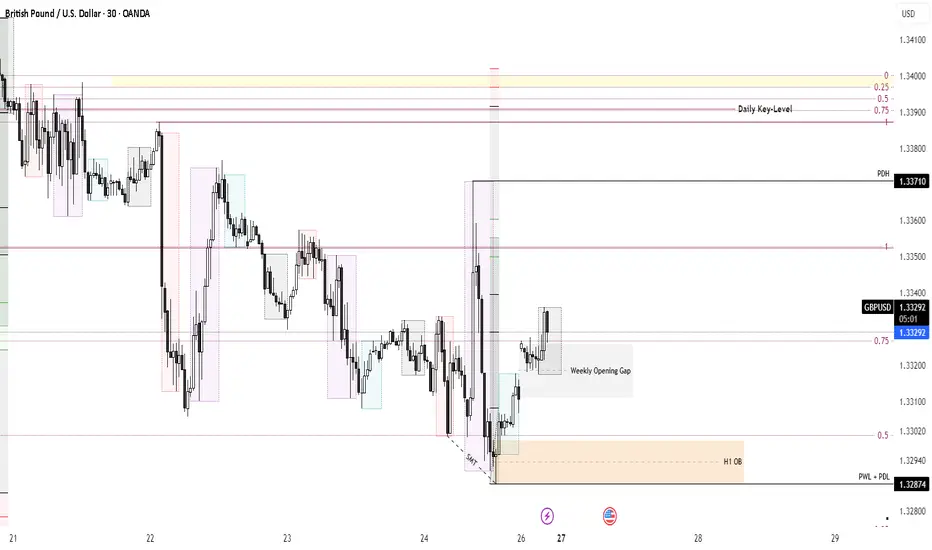
GBPUSD retracement towards higher timeframe key levelGBPUSD is retracing in higher timeframe towards an important Key level before giving the seasonal November expansion. It also is the resetting phase of the October's monthly candle as we are in the las week of October. We are anticipating a Classic expansion till Wednesday and we may purge the sell side liquidity by Wednesday. However, the retracement at the Key level today (Monday) and a bearish order-flow there onwards will confirm this narrative.
ATULAUTO in Upward Trend on large timeframeATULAUTO seems to be forming a diametric pattern on monthly timeframe.
Price wise wave D has achieved a healthy retracement.
Could see the stock rising further in upcoming days and weeks.
Price below ~400 would signal a warning sign.
Study would be invalidated below ~270

This stock is at support and resitance level may give 6 % moveStock will likely experience a significant move next week.
Here's a trading plan:
* **Upside Trade:** If the price rises above ₹1010, initiate an upward trade. Set a target price of ₹1079 and place a stop-loss at the recent swing low.
* **Downside Trade:** If the price falls below ₹1010, initiate a downward trade. Set a target price of ₹943 and place a stop-loss at the recent swing high.

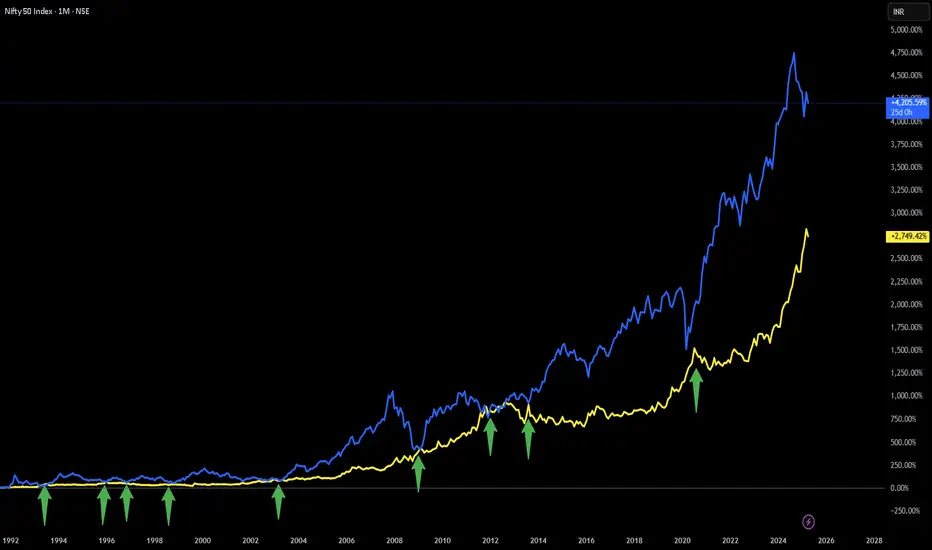
Strange Observation between NIFTY and GOLD...Since August 1, 1991: When ever NIFTY and GOLD return are same NIFTY gives handsome return in coming months.
Good examples of above statement are years 2003, 2009, 2013 and 2020.
Since August 1, 1991: NIFTY has given approx 4200% return and GOLD has given approx 2750% return. Difference in return is approx 1450%.
Going by the above observation either NIFTY has to come down or GOLD has to go up (or both) for NIFTY to give handsome return.
NOTE: This is just a strange observation/correlation.
Disclaimer: This is for demonstration and educational purpose only. This is not buying or selling recommendations. I am not SEBI registered. Please consult your financial advisor before taking any trade.
A market Wrap Up on Fx, Rates, Geo- economic & Geo-PoliticsGlobal Wrap
Geo-economics was back on center stage.
The U.S. slapped new sanctions on Russia, broke off trade talks with Canada, upped its financial lifeline to Argentina’s President Milei, and geared up for the Trump–Xi meeting — which Trump insists will deliver a deal. (He’s clearly betting on optimism over precedent.)
U.S. — Soft Inflation, Fed in Focus
September inflation came in cooler than expected, boosting odds of a Fed rate cut on Wednesday. But both core and headline readings still hover a full point above the 2% target.
PMIs were upbeat; the University of Michigan survey… not so much. Consumers are clearly not feeling the vibes yet.
U.K. — Inflation Cools, Borrowing Heats Up
U.K. inflation eased to 3.8%, below forecasts, with wages also softening — pushing yields lower and giving the budget a breather. Still, borrowing for the first half of the fiscal year hit its highest since the pandemic. Less “Great British rebound,” more “Great British recalculation.”
China:
Slower, but on Target
China’s Q3 GDP growth slowed to 4.8%, bringing year-to-date expansion to 5.2% — enough to meet the official goal. Not thrilling, but Beijing will take it.
Markets:
Gold Stumbles, Oil Shines
Equities extended gains, yields stayed calm, and gold finally slipped after nine weeks of rallying. Oil had the opposite mood — both Brent and WTI closed above $60 a barrel as U.S. sanctions tightened on Russian exports.
The Week Ahead:
All eyes on geo-economics round two: the Trump–Xi summit, Argentina’s elections, and a flurry of central bank decisions.
The Fed is expected to trim rates by 25 basis points as job growth cools. Chair Powell’s press conference will be the week’s must-watch — especially with political heat still on the Fed.
The ECB is likely to stay on hold, while the Bank of Japan keeps its famously patient stance.
Meanwhile, the U.S. government shutdown drags into week four, delaying GDP and inflation data yet again — the statistical version of “please hold, your data is important to us.”
Oh BtW, there is the Bank of Canada rate decision too- no mystery there. They will cut another quarter.
Asia & Europe — Data Watch
China PMIs: Services likely up, manufacturing a tad softer.
Eurozone: Q3 GDP and inflation seen hovering near 2%.
U.K.: Consumption data to guide the late-November budget.
India — Still Strong, Slightly Softer
India’s forex reserves rose $4.5 billion to a record $702.3 billion, thanks to valuation gains.
The flash composite PMI slipped to 59.9 from 61.0 — the slowest in five months but still solidly expansionary. Services cooled, manufacturing ticked up, exports softened.
Markets flirted with record highs before mild profit-taking, as everyone awaits progress in U.S.–India trade talks.
Geopolitics — Quiet Resolve and Fiscal Reality
China: The Communist Party’s Fourth Plenum reaffirmed the 15th Five-Year Plan and doubled down on tech leadership. Tariffs may sting, but Beijing’s message is clear: “We’re not blinking.”
Japan: Sanae Takaichi took office as Prime Minister, promising stimulus — but markets aren’t buying it. With public debt at 236% of GDP, Tokyo may be out of fiscal runway. Appointing two ex-finance ministers suggests “prudence now, promises later.”

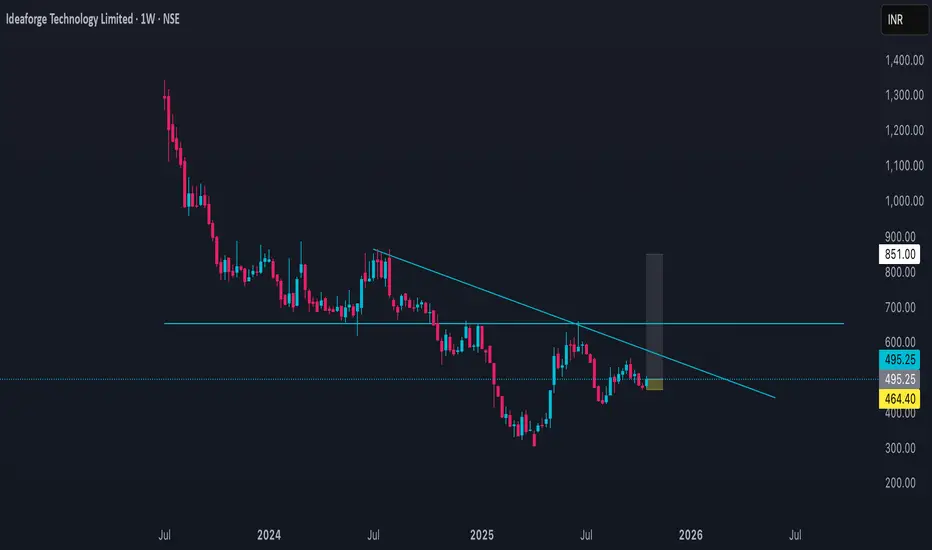
IDEAFORGE Price ActionAs of **October 24, 2025**, **ideaForge Technology Ltd (NSE: IDEAFORGE)** closed at **₹495.25**, gaining around **4.9%** on the day after trading between **₹473.40 and ₹503.00**. The session saw strong activity with over **13.2 lakh shares** traded, suggesting renewed investor interest before the upcoming quarterly results release later in the month.
The company has a **market capitalization** near **₹2,115 crore**. Its current **P/E ratio** is negative (around **–34**) due to losses in recent quarters, while the **P/B ratio** stands near **3.7**, reflecting modest valuation for a small-cap aerospace technology firm. The **book value per share** is around **₹131.5**, with a **52-week range** between **₹301 and ₹660.6**, indicating recovery from its April 2025 low.
From a technical perspective, IDEAFORGE shows early signs of rebound following a multi-month decline. The current price has moved above the **20-day moving average (₹485)** but still lags behind the **200-day average (₹525)**—pointing to medium-term consolidation. The **RSI near 56** shows balanced momentum, with potential upside if the price holds above ₹490. Key **support** levels lie at ₹475 and ₹460, while **resistance** stands near ₹505–₹515. A breakout above ₹515 could open short-term targets toward ₹540–₹550.
Overall, **ideaForge** maintains a **neutral to cautiously bullish** short-term outlook. Market expectations remain tied to its performance in defense drone orders and export growth, which will determine whether its recent recovery can sustain toward pre-2024 highs.
GBPUSD LongPrice has reacted strongly from a previous weekly low, forming a solid session Low within the P Line area. The 15-minute and 1 Hr CapWave criteria confirm bullish intent, suggesting potential bullish intent.

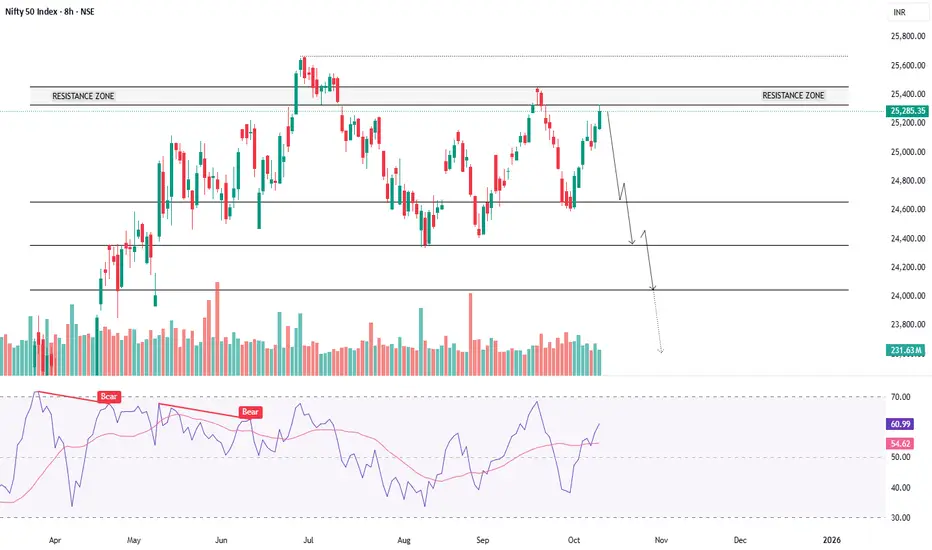
NIFTY50 - VULNERABLE TO 20% CORRECTIONSymbol - NIFTY50
NIFTY50 has been trading within a defined range for the past several months, unable to generate any meaningful trending move due to the absence of strong fundamental or macroeconomic catalysts on either side. Both bullish and bearish drivers have remained largely muted, resulting in a period of indecision and lackluster volatility.
While the index itself has shown little directional progress, distribution patterns are increasingly visible across the broader market, which continues to exhibit a consolidation to bearish bias. This suggests that institutional participation may be shifting, and underlying sentiment is weakening despite the Nifty50’s apparent stability.
There are several macroeconomic and geopolitical factors that could contribute to a potential correction in global equity markets. Although listing them all would make this analysis excessively long, some of the key concerns include:
1. Rising inflationary pressures driven by US tariffs implemented under Trump’s economic policy.
2. Weak US fiscal policy and growing concerns that the US government could default on its debt obligations.
3. Elevated recession expectations in the United States.
4. Gold and Silver simultaneously hitting historic highs, signaling a clear risk-off sentiment, even as US equity markets trade at record levels.
5. Overvaluation and speculative euphoria in AI and machine learning related stocks, indicating a potential bubble in select sectors.
At current levels, valuations appear moderately high, and the 'smart money' or true value buying zones remain significantly lower. Based on these factors, my personal bias leans toward a major correction in the coming months. I anticipate a potential downside of around 20% or more in NIFTY50.
This is a positional view, so I am not sharing immediate support or resistance levels. However, the 20-21K zone and below may represent attractive long term accumulation levels for investors once the correction plays out.
It’s worth recalling that in my previous outlook last year, when Nifty50 traded near 26000, I projected a 10–15% correction, which materialized shortly after. This time, however, the downside potential could be even deeper - though only time will tell how the broader macro picture unfolds.
Disclaimer: This analysis is shared purely for educational purposes and should not be considered trading or investment advice.
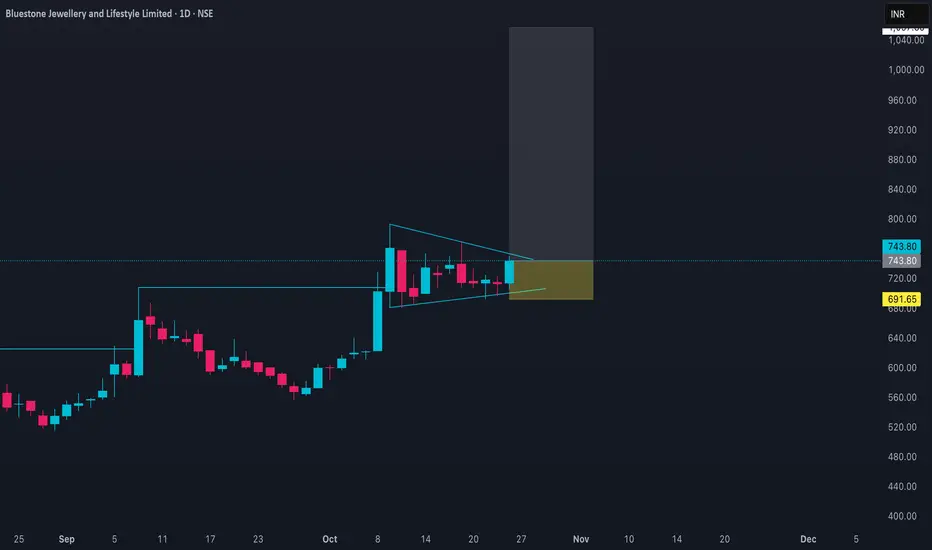
BLUESTONE Price ActionAs of **October 25, 2025**, **Bluestone Jewellery & Lifestyle Ltd (NSE: BLUESTONE)** closed at around **₹743.80**, reflecting a strong **4.4% daily gain** from the previous close of ₹712.60. The day’s range was **₹705.35–₹750.00**, with heavy trading volume around **16 lakh shares**, indicating strong investor participation.
The company’s **market capitalization** is approximately **₹11,255 crore**, placing it in the upper mid-cap segment of the gems and jewellery industry. Bluestone is currently **trading near the upper half of its 52-week range**, between ₹508.10 (low) and ₹793.00 (high). Despite operational progress, the firm’s **EPS (TTM)** stands at **–₹9.57**, leading to a **negative P/E ratio of –77.7**, while its **P/B ratio** is a steep **28.8**, suggesting rich valuations given the company’s retail expansion phase.
Technically, the trend remains **firmly bullish**, supported by continued higher highs and the stock’s position above both the **20-day (₹720)** and **50-day (₹690)** moving averages. Momentum indicators such as RSI, near **64**, point to sustained strength but with potential for short-term consolidation near ₹740–₹750. **Immediate support** is seen around ₹725, and **resistance** around ₹760–₹770. A decisive breakout above ₹770 could propel the next target zone towards ₹790–₹800, which coincides with its 52-week high.
Fundamentally, Bluestone’s short-term profitability remains under pressure due to scaling costs, but revenue momentum from its omni-channel expansion and brand recall continues to improve. The medium-term outlook stays **constructive**, with investors focusing on upcoming quarterly results for clarity on the path to profitability and sustained retail margin improvement.
Institute pump and dump Explain I have analysis this pattern by myself and i like to share with you .
Institute sell there stocks to retail and exit there position.
This thing happens in 3 stage .
Below share in detail-
# 1st Leg – Big Institutional Buying
Price breaks out sharply above previous resistance zone.
Huge volume spike clear sign of institutional buying.
Candle structure long bullish candles, often with wide range.
Psychology:
Institutions step in aggressively — they don’t hide accumulation here.
Breakout attracts early smart participants or some retail momentum traders.
#Stage 2: Partial Profit Booking + Retail Entry
After the first upmove, institutions book a small portion of profits.
This causes a minor correction or sideways movement — which you’ve marked as “small correction.”
Then, volume pops up again — but this time driven by retail traders who see the price breakout or recent rally and jump in late.
Institutions use this liquidity from retail buying to offload more of their holdings (distribution phase).
Hence the second leg’s rise is often less strong internally — despite visible volume.
#Stage 3: Retail Trap & Sharp Decline
Once institutions have sold enough to retail, they stop supporting the price.
This results in a sharp fall — large red candles, pointed out.( Here we know fake buying by institute and this is just trap)
Retail traders, who entered during the 2nd leg thinking it’s another rally, now get trapped.
Volume still appears high, but now it’s mostly panic selling or stop-loss triggers.
This confirms institutional distribution is complete and the next cycle may start again from lower levels.
This post may help you understand fake institute buying, but we identify this in 3rd stage .
I have purchased This stock at 2nd leg and trapped exit at 3rd stage.
All ready post available in my profile post tradingview

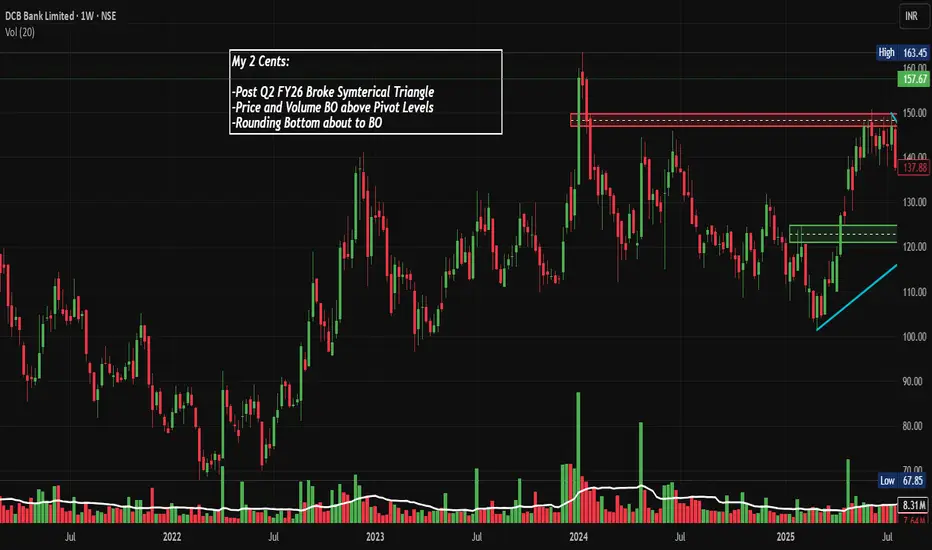
DCBBANK: Strong Q2 FY26 Numbers, Triangle BO, Chart of the MonthNSE:DCBBANK This Banking Stock Just Broke Out After a Year of Consolidation - Is a 30% Rally Coming? Posted Strong Q2 FY26 Numbers, Let's Analyse in the Chart of the Month.
As per the Latest SEBI Mandate, this isn't a Trading/Investment RECOMMENDATION nor for Educational Purposes; it is just for Informational purposes only. The chart data used is 3 Months old, as Showing Live Chart Data is not allowed according to the New SEBI Mandate.
Disclaimer: "I am not a SEBI REGISTERED RESEARCH ANALYST AND INVESTMENT ADVISER."
This analysis is intended solely for informational purposes and should not be interpreted as financial advice. It is advisable to consult a qualified financial advisor or conduct thorough research before making investment decisions.
Price Action Analysis:
Overall Trend Structure:
- The stock demonstrates a year consolidation pattern from 2024 to mid-2025, creating a strong base for accumulation
- Post-Q2 FY26 results, DCB Bank has broken out decisively from a symmetrical triangle pattern that formed during the consolidation phase
- The current price of ₹157.67 represents a significant move above the resistance zone of ₹150, which acted as a ceiling multiple times since early 2024
- A notable ascending trendline (marked in cyan) has been providing dynamic support from early 2024, suggesting sustained buying interest
Recent Price Movement:
- The stock witnessed a dramatic 23% surge in just two trading sessions (October 21-22, 2025) following the Q2 FY26 earnings release
- Current price of ₹157.67 is approaching the 52-week high of ₹163.70, demonstrating strong upward momentum
- The breakout candle shows strong conviction with increased volume participation, validating the move
- Price has successfully reclaimed and is sustaining above the critical ₹150 psychological and technical resistance level
- The stock is still 38% below its all-time high of ₹244.65, providing substantial room for upside potential
Historical Context:
- From 2021 lows around ₹70, the stock rallied to ₹150 levels by mid-2022
- A prolonged correction and consolidation phase lasted from mid-2022 through early 2024
- Multiple attempts to break the ₹150 resistance were rejected during 2024, creating a strong supply zone
- The recent breakout in October 2025 marks the first successful breach of this multi-year resistance with volume confirmation
Volume Action Analysis:
Volume Characteristics:
- Current daily volume stands at 98.79 million shares against an average of 11.07 million shares, representing an 8x surge
- Volume spike coincides perfectly with the breakout above ₹150 resistance, confirming institutional participation
- Consistent volume bars during the consolidation phase suggest steady accumulation by long-term investors
- Volume at key support levels during corrections has been relatively lower, indicating a lack of panic selling
- The volume profile shows the heaviest concentration between the ₹120-130 range, which now acts as a strong demand zone
Volume-Price Relationship:
- Breakout above resistance, accompanied by massive volume expansion, validates the bullish move
- Volume on up days significantly exceeds volume on down days during the recent rally, showing strong buying pressure
- Green volume bars dominating red volume bars in the recent price action indicate bullish accumulation
- Volume during the triangle formation was progressively declining, which is characteristic of a valid continuation pattern
- Post-breakout volume sustaining above average levels suggests continuation rather than exhaustion
Support and Resistance Levels:
Key Resistance Zones:
- Immediate Resistance (R1): ₹163.70 (52-week high and recent high)
- Medium-term Resistance (R2): ₹175-180 (Fibonacci extension level and psychological resistance)
- Major Resistance (R3): ₹200 (round number psychological barrier)
- Long-term Resistance (R4): ₹244.65 (all-time high)
Key Support Zones:
- Immediate Support (S1): ₹150 (previous resistance turned support, breakout level)
- Strong Support (S2): ₹138-140 (50% retracement of recent rally and pivot level marked on chart)
- Major Support (S3): ₹125 (ascending trendline support and breakout point from triangle)
- Critical Support (S4): ₹110-115 (bottom of recent consolidation range)
Support Strength Assessment:
- The ₹150 level has now transformed from a stubborn resistance to a new support base
- The ascending trendline from 2024 lows provides dynamic support that has been tested multiple times successfully
- The ₹125-130 zone represents a confluence of horizontal support, trendline support, and a high-volume node
- Gap support around ₹147 from the recent breakout provides a short-term cushion against minor corrections
Base Formation and Accumulation:
Base Characteristics:
- A well-defined multi-year base formation spanning approximately 2.5 years (mid-2022 to October 2025)
- The base exhibits characteristics of a symmetrical triangle consolidation pattern
- Lower highs and higher lows converging towards the apex created compression, leading to the explosive breakout
- This extended consolidation period allowed for the distribution of weak hands and accumulation by strong hands
- The base depth of approximately 35-40% from top to bottom indicates significant energy buildup
Accumulation Evidence:
- Declining volume during consolidation, followed by expansion on breakout, is a textbook accumulation pattern
- Multiple false breakouts were absorbed without panic selling, indicating patient accumulation
- Price holding above ascending trendline throughout 2024-2025 shows consistent buying support
- The rounding bottom formation visible from mid-2024 through September 2025 is a bullish accumulation pattern
- Improved fundamentals during the consolidation period attracted smart money accumulation
Technical Patterns:
Symmetrical Triangle Pattern:
- A clear symmetrical triangle pattern formed from June 2024 through October 2025
- The pattern shows converging trendlines with at least 4-5 touch points on each side
- Breakout occurred near the apex with strong volume, which is the ideal scenario for this pattern
- The pattern duration of approximately 16 months makes it a highly reliable formation
Ascending Triangle Elements:
- An ascending triangle component is visible in the chart with a flat top resistance at ₹150
- Rising lows forming the ascending trendline show progressive buying interest
- This bullish continuation pattern typically resolves to the upside, which has now been confirmed
- The pattern suggests strong demand overwhelming supply at higher levels
Breakout Pattern Validation:
- The breakout above ₹150 was accompanied by a large bullish engulfing candle
- Gap-up opening on breakout day shows urgency and conviction among buyers
- No immediate throwback to retest breakout level indicates strength
- The breakout occurred with 8x normal volume, validating the move
- Price sustaining above the breakout level for multiple sessions confirms pattern validity
Sectoral Backdrop - Private Banking Industry:
Sector Overview and Trends:
- The Indian banking sector has shown resilience with credit growth in the range of 15-17% year-on-year
- Private sector banks are gaining market share from PSU banks due to superior asset quality and technology adoption
- Small and mid-sized private banks like DCB Bank are carving niches in specific lending segments
- Net Interest Margins (NIMs) are stabilising after compression in 2023-2024, providing earnings visibility
- Asset quality metrics across the banking sector have improved, with Gross NPA levels at multi-year lows
Sector Valuations and Outlook:
- Banking sector trading at reasonable valuations with an average P/B ratio of 2-3x for private banks
- Small-cap private banks trading at a significant discount to large private banks, offering a value opportunity
- Sector outlook remains positive, driven by India's GDP growth trajectory of 6-7%
- Expected rate stability from the RBI in 2025 will help banks maintain margins
- Increasing digital adoption and financial inclusion are driving deposit and loan growth
Competitive Landscape:
- DCB Bank competes with peers like RBL Bank, South Indian Bank, Karur Vysya Bank, and CSB Bank
- Focus areas include retail lending, MSME lending, and specialised products like gold loans
- Technology adoption and digital banking are becoming key differentiators in the competitive landscape
- Consolidation trend in small banks may create M&A opportunities for well-positioned players
- Customer acquisition cost is declining with digital channels gaining prominence
Fundamental Backdrop:
Recent Financial Performance:
- Q2 FY26 results showed a robust 16.2% YoY growth in net profit to ₹184 crore
- Net Interest Income (NII) grew 17% YoY to ₹596 crore, indicating healthy core business growth
- Advances increased by 19% YoY, demonstrating strong loan book expansion
- Total operating income rose 16.22% to ₹1,822.75 crore in Q2 FY26
- Return on Assets (ROA) at 0.85% and Return on Equity (ROE) at 11.4% showing steady improvement
Asset Quality Metrics
- Gross NPA ratio improved to 2.91% as of September 30, 2025, down from 3.29% YoY
- Net NPA ratio at healthy 1.21%, indicating strong recovery and collection mechanisms
- Slippages are moderating sequentially, suggesting improved underwriting standards
- Provision coverage ratio remains adequate, providing a buffer against potential stress
- Management expects credit cost to remain below 45 basis points for the full year, indicating confidence in asset quality
Capital and Liquidity Position:
- Capital Adequacy Ratio (CAR) at strong 16.41% (Tier I: 13.97%, Tier II: 2.44%) as per Basel III norms
- Well-capitalised to support planned 20%+ loan growth without dilution
- CASA ratio at 23.52% as of September 2025, though lower than the desired 25%+
- Cost of deposits declining, helping NIM expansion despite a competitive deposit environment
- Liquidity coverage ratio and statutory ratios comfortably above regulatory requirements
Strategic Initiatives and Growth Drivers:
- Increased focus on gold loans and co-lending partnerships, driving fee income
- Emphasis on employee productivity and technology adoption, reducing Cost to Average Assets
- Digital transformation is improving customer experience and operational efficiency
- Targeting ROA of 1% and ROE of 14-15% by FY27 as per management guidance
- Niche focus areas like school finance, retail microfinance, and supply chain finance, providing growth levers
Valuation Metrics:
- Trading at P/E ratio of 7.30-7.58x, significantly below sector average of 15-20x
- Price to Book Value of 0.85x, below 1x, suggesting undervaluation
- PEG ratio of 0.51 indicates the stock is undervalued relative to the growth rate
- Dividend yield of 0.81-0.87% with a consistent dividend payout history
- Market capitalisation of approximately ₹5,065 crore classifies it as a small-cap bank
- Attractive valuation multiple offers significant re-rating potential as performance improves
Management and Governance:
- Leadership under MD & CEO Praveen Kutty is showing strong execution capabilities
- Management has consistently delivered on stated guidance parameters
- Board composition includes experienced banking professionals and independent directors
- No major governance concerns or regulatory issues flagged
- Transparent communication with stakeholders through regular investor calls and updates
Key Risks to Monitor:
- Small-cap bank status means higher vulnerability to market sentiment and liquidity shocks
- CASA ratio below peers indicates higher cost of funds and margin pressure risk
- Geographic concentration in certain states may lead to regional economic exposure
- Competition from larger banks and fintech players in key product segments
- Regulatory changes impacting small banks could affect operations
- Slower-than-expected economic growth could impact loan demand and asset quality
Technical Sentiment:
- Technical indicators, including MACD and Bollinger Bands, show bullish signals across timeframes
- Golden cross formation (50-day MA crossing above 200-day MA) has bullish implications
- Momentum indicators suggest the stock remains in a bullish zone with room to run
- Pattern completion targets align with brokerage fundamental price targets around ₹175-200
- Short-term overbought conditions may lead to consolidation, but don't negate the bullish thesis
Trade Monitoring and Review Framework:
Daily Monitoring Checklist:
- Check price action relative to key support and resistance levels identified
- Monitor volume patterns - declining volume on pullbacks is healthy, rising volume on breakdowns is concerning
- Track broader market indices (Nifty, Bank Nifty) for sector correlation
- Review any news flow specific to DCB Bank or the banking sector
- Ensure stop loss orders are active and properly placed in the system
Weekly Review Points:
- Assess whether the stock is respecting the ascending trendline support
- Compare DCB Bank's performance relative to the Bank Nifty index and peer banks
- Review any changes in FII/DII holdings or institutional activity
- Check for any upgrades/downgrades from research analysts
- Evaluate whether to book partial profits or adjust stop losses based on price movement
Quarterly Assessment:
- Deep dive into quarterly results when announced against expectations
- Review management commentary and guidance for any changes in outlook
- Assess asset quality trends, NIM trajectory, and expense management
- Compare performance metrics with peer group banks
- Re-evaluate position size and allocation based on updated fundamentals
Red Flags to Watch:
- Any close below the ascending trendline support on high volume
- Significant deterioration in asset quality (GNPAs rising above 3.5%)
- Margin compression beyond 10 basis points in a quarter
- Negative management commentary or guidance revision downwards
- Broader banking sector entering correction phase with systematic risks emerging
My 2 Cents:
- DCB Bank presents a compelling risk-reward opportunity at current levels following a clean technical breakout
- Multi-year base formation and pattern completion project has significant upside potential
- Strong fundamentals with improving profitability, asset quality, and capital ratios support the technical picture
- Attractive valuations at 0.85x P/B and 7.5x P/E provide substantial margin of safety
- Positive sectoral tailwinds and company-specific growth initiatives enhance medium-term outlook
Full Coverage on my Newsletter this Week
Keep in the Watchlist and DOYR.
NO RECO. For Buy/Sell.
📌Thank you for exploring my idea! I hope you found it valuable.
🙏FOLLOW for more
👍BOOST if you found it useful.
✍️COMMENT below with your views.
Meanwhile, check out my other stock ideas on the right side until this trade is activated. I would love your feedback.
As per the Latest SEBI Mandate, this isn't a Trading/Investment RECOMMENDATION nor for Educational Purposes; it is just for Informational purposes only. The chart data used is 3 Months old, as Showing Live Chart Data is not allowed according to the New SEBI Mandate.
Disclaimer: "I am not a SEBI REGISTERED RESEARCH ANALYST AND INVESTMENT ADVISER."
This analysis is intended solely for informational purposes and should not be interpreted as financial advice. It is advisable to consult a qualified financial advisor or conduct thorough research before making investment decisions.
Which stock you should buy and when?1. Before Major Events (e.g., “Before Corona Come”)
Stock was in a downtrend or sideways zone, forming resistance levels (horizontal blue lines).
No buying yet — this phase helps identify historical resistance and potential breakout zones.
2. Breakout During a Key Period (e.g., “Corona-Time Breakout”)
Stock breaks out of its long-term resistance with strong volume.
This indicates accumulation and trend reversal.
✳️ Ideal action: Watch for a confirmed breakout with a daily or weekly close above resistance.
3. Re-testing and Consolidation
After breakout, price usually comes back to test the breakout level (support retest).
If it holds above that level instead of falling below — it confirms strength.
✳️ Ideal action: This is the best buy zone — when the stock retests the breakout successfully.
4. New Higher Highs and Breakouts
Stock makes new highs and again breaks minor resistances (smaller breakout levels).
Each breakout, followed by successful retest, builds a strong uptrend structure.
✳️ Ideal action: You can add on every breakout and retest in a trending stock.
5. Corrections & Retests (Mid-2024 to 2025 example)
Healthy corrections happen — price may fall to earlier support zones.
If it bounces back strongly from support and breaks previous highs again → trend continuation.
✳️ Ideal action: Buy on dips when price holds above strong supports.
6. Fresh Breakout Again (Recent Phase)
The latest breakout (2025) from ~₹175–₹185 zone to above ₹300 indicates a new long-term bullish phase.
Strong volume and structure show renewed investor interest.
✳️ Ideal action: Enter on pullback near ₹255–₹275 zone if retested, or hold for long-term if already in.
✅ Summary – How to Identify and Buy Such Stocks
Look for multi-year resistance breakout on weekly charts.
Confirm with high volume during breakout.
Wait for retest and hold above support — that’s your best entry.
Add on every breakout and successful retest.
Avoid buying after a big rally without retest — wait for price to cool down.

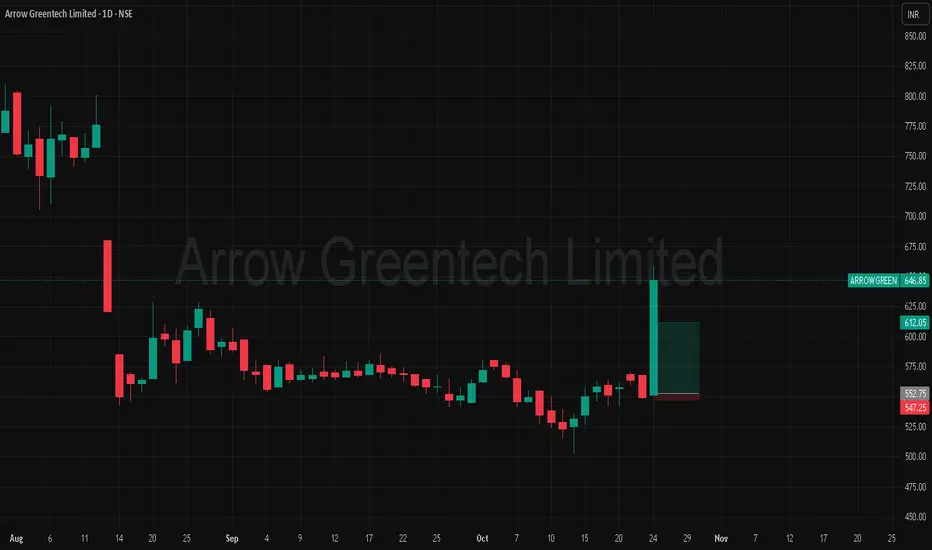
ARROWGREEN - INTRDAY, Target analysis
Arrow Greentech Ltd
Looks Like A Good Stock, And It's Going Ex-Dividend Soon
a mjor momentum is seen day after the company's largest shareholder sees 19% reduction in holdings value.The group holding the most number of shares in the company, around 66%
#intraday #swing
follow for future target.
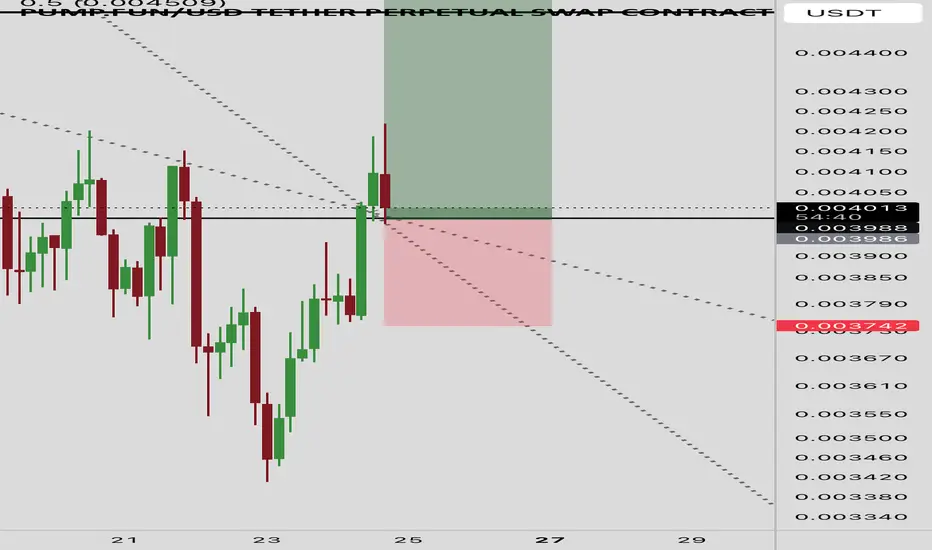
$PUMP TRADE IDEA Pump successfully broke out from its trendline and now retesting expecting rally on it
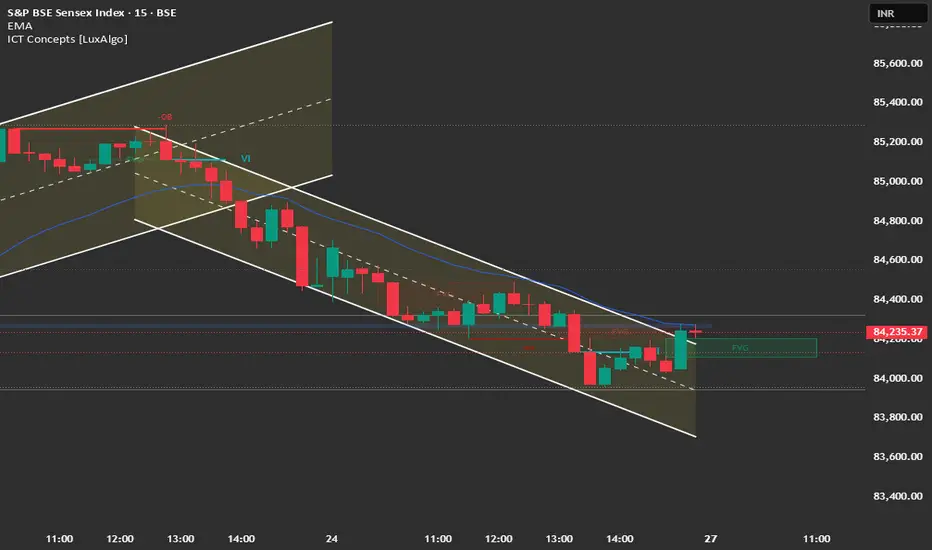
Sensex Structure Analysis & Trade Plan: 27th October4-Hour Chart (Macro Trend)
Structure: The Sensex has confirmed a Break of Structure (MSS) on the aggressive short-term momentum, breaking below the lower trendline of the steep ascending channel. The price has corrected deeply, with the final 4H candle closing as a large bearish candle.
Key Levels:
Major Supply (Resistance): 84,800 - 85,000. This area (the high from Friday and the FVG on the chart) is the immediate overhead resistance.
Major Demand (Support): 83,600 - 83,900. This area aligns with the lower trendline of the corrective pattern and the FVG (Fair Value Gap), making it the must-hold zone for the overall bullish structure .
Outlook: The bias is Corrective within an Uptrend. We expect the market to continue correcting towards the 83,600 - 83,900 support zone before finding significant buying interest.
1-Hour Chart (Intermediate View)
Structure: The 1H chart shows a clear breakdown from the steep ascending channel. The price is now trading within a newly formed descending channel (or a bearish flag), confirming the short-term correction.
Key Levels:
Immediate Resistance: 84,400 (Upper boundary of the descending channel/FVG).
Immediate Support: 83,800 - 84,000 (Lower channel boundary).
15-Minute Chart (Intraday View)
Structure: The 15M chart confirms the sharp descending channel and strong intraday bearish control. The final close was near the lows, indicating selling pressure remains.
Key Levels:
Intraday Supply: 84,400.
Intraday Demand: 83,800.
Outlook: Bearish for the session open. A "Sell on Rise" strategy is favorable.
📈 Structure Analysis & Trade Plan: 27th October
Market Outlook: Sensex is undergoing a short-term correction after hitting the 85,290 high, driven by renewed trade fears. The primary strategy is to sell the rally/breakdown or buy a major reversal at strong support.
Bearish Scenario (Primary Plan: Correction Continuation/Sell on Rise)
Justification: The sharp breakdown below the channel favors a deeper correction toward the major demand zone.
Entry: Short entry on a retest and rejection of the 84,400 - 84,600 zone (breakdown level/FVG) OR Short a decisive break and 15-minute candle close below 84,000.
Stop Loss (SL): Place a stop loss above 84,800 (above the last swing high/FVG).
Targets:
T1: 83,800 (Lower channel support).
T2: 83,600 (Major FVG support).
T3: 83,200 (Next major support).
Bullish Scenario (Counter-Trend/Reversal)
Justification: Only valid if strong buying emerges, likely on positive global or corporate news.
Trigger: A sustained move and close above 85,000.
Entry: Long entry on a confirmed 15-minute close above 85,000.
Stop Loss (SL): Below 84,500.
Targets:
T1: 85,290 (All-Time High retest).
T2: 85,600 (Extension target).
Key Levels for Observation:
Immediate Decision Point: 83,800 - 84,600 range.
Bearish Confirmation: Sustained trade below 84,000.
Bullish Warning: A move back above 84,800.
Line in the Sand: 83,600. A break below this level shifts the medium-term bias to a deeper corrective phase.
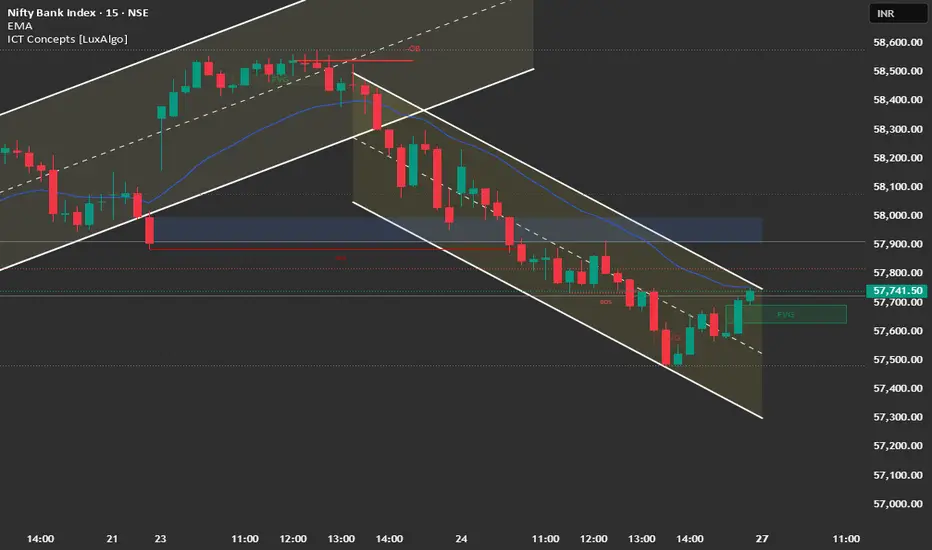
Banknify Structure Analysis & Trade Plan: 27th October4-Hour Chart (Macro Trend)
Structure: The Bank Nifty has experienced a sharp correction, breaking below the lower trendline of the aggressive ascending channel. This signals a clear Market Structure Shift (MSS) on the steep short-term momentum. The aggressive bearish candle (Oct 24th) shows strong profit-booking from the ATH. The current price is testing the 57,750 - 58,000 zone, which now acts as overhead resistance.
Key Levels:
Major Supply (Resistance): 58,100 - 58,300. This area (the breakdown level and the FVG on the chart) is the immediate overhead resistance.
Major Demand (Support): 57,100 - 57,300. This area, which includes the lower channel trendline and a strong FVG (Fair Value Gap), is the must-hold zone to prevent a further large correction.
Outlook: The bias is Corrective within an Uptrend. We expect the market to consolidate or retest the 57,100 support before any bullish move.
1-Hour Chart (Intermediate View)
Structure: The 1H chart shows a clear breakdown from the steep ascending channel. The price is now trading within a descending channel, confirming the short-term correction. The close is just above the 57,600 support level.
Key Levels:
Immediate Resistance: 57,900 - 58,000 (Psychological mark and breakdown level).
Immediate Support: 57,500 - 57,600 (Lower channel boundary/FVG zone).
15-Minute Chart (Intraday View)
Structure: The 15M chart confirms the steep descending channel and strong intraday bearish control. The price closed right on the lower boundary of a small FVG area, suggesting a temporary bounce is possible at the open, but the overall bias is to the downside.
Key Levels:
Intraday Supply: 57,900.
Intraday Demand: 57,200.
Outlook: Neutral-to-Bearish for the session open. A "Sell on Rise" strategy is favorable.
📈 Structure Analysis & Trade Plan: 27th October
Market Outlook: Bank Nifty is undergoing a sharp correction after hitting a new ATH. The key battleground is the 57,100 - 57,300 FVG zone.
Bearish Scenario (Primary Plan: Correction Continuation/Sell on Rise)
Justification: The sharp breakdown below the channel and the loss of momentum from the ATH favor a deeper correction toward the major demand zone.
Entry: Short entry on a retest and rejection of the 57,900 - 58,100 zone (breakdown level) OR Short a decisive break and 15-minute candle close below 57,500.
Stop Loss (SL): Place a stop loss above 58,300 (above the last swing high).
Targets:
T1: 57,300 (Major FVG support).
T2: 57,100 (Strong Demand Zone).
T3: 56,800 (Deeper FVG).
Bullish Scenario (Counter-Trend/Reversal)
Justification: Only valid if strong buying emerges to defend the major structural support and reclaim the bullish momentum.
Trigger: A sustained move and close above 58,200.
Entry: Long entry on a confirmed 15-minute close above 58,200.
Stop Loss (SL): Below 57,800.
Targets:
T1: 58,577 (All-Time High retest).
T2: 59,000 (Psychological extension target).
Key Levels for Observation:
Immediate Decision Point: 57,500 - 58,100 zone.
Bearish Confirmation: Sustained trade below 57,500.
Bullish Warning: A move back above 58,100.
Line in the Sand: 57,100. A break below this level shifts the medium-term bias to a deeper corrective phase.
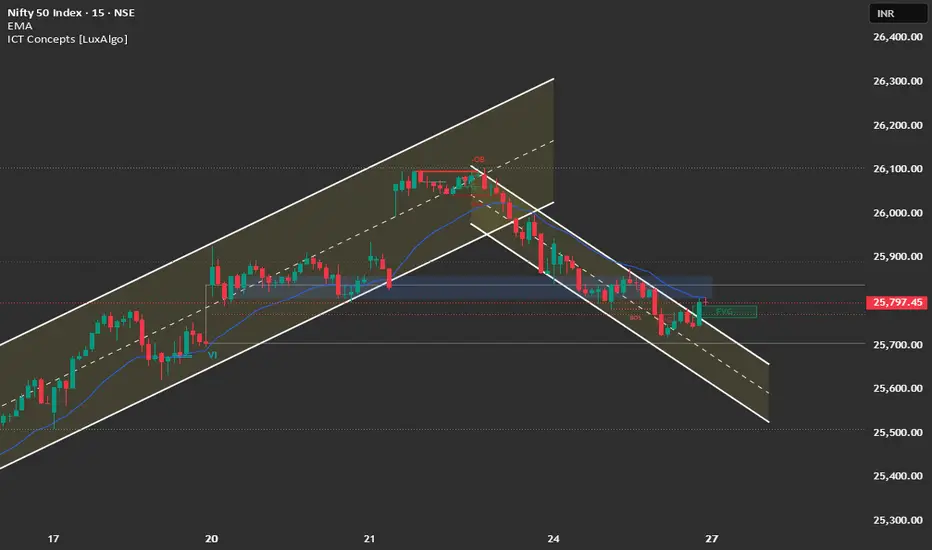
Nifty Structure Analysis & Trade Plan: 27th October4-Hour Chart (Macro Trend)
Structure: The Nifty is in an Aggressive Bullish Momentum phase, but the recent 4H candle shows a deep correction that broke below the lower trendline of the steep ascending channel. This signals a Market Structure Shift (MSS) on the aggressive short-term momentum. The correction closed right on the FVG (Fair Value Gap), suggesting this zone will be critical.
Key Levels:
Major Supply (Resistance): 25,950 - 26,100. This area (the high from Oct 23) is the immediate overhead hurdle. A break above 26,100 would target the ATH.
Major Demand (Support): 25,400 - 25,550. This area, which includes the largest FVG and a strong accumulation zone, is the must-hold level for the overall weekly bullish bias.
Outlook: The bias is Corrective within an Uptrend. We expect consolidation or a retest of the lower support levels before the bulls can attempt a fresh ATH breakout.
1-Hour Chart (Intermediate View)
Structure: The 1H chart shows a clear descending channel formed during Friday's trading, confirming the short-term correction. The index has lost momentum and closed near the day's low.
Key Levels:
Immediate Resistance: 25,900 (Previous swing low/upper channel boundary).
Immediate Support: 25,600 (Lower channel boundary/FVG zone).
15-Minute Chart (Intraday View)
Structure: The 15M chart confirms the steep descending channel. The price is currently testing the lower end of the channel, having already broken the immediate short-term support and leaving an FVG overhead (around 25,900).
Key Levels:
Intraday Supply: 25,900.
Intraday Demand: 25,600.
Outlook: Bearish for the session open. A "Sell on Rise" strategy near the channel resistance is favorable.
📈 Trade Plan (Monday, 27th October)
Market Outlook: Nifty is undergoing a sharp correction, fueled by a renewed focus on global risks. The key lies in defending the 25,600 - 25,700 support zone.
Bearish Scenario (Primary Plan: Correction Continuation/Sell on Rise)
Justification: The breakdown of the steep channel and the formation of a descending channel favor continuation toward the 25,500 support.
Entry: Short entry on a retest and rejection of the 25,900 - 25,950 level (upper channel/FVG) OR Short a decisive break and 15-minute candle close below 25,750.
Stop Loss (SL): Place a stop loss above 26,000 (above the last swing high).
Targets:
T1: 25,600 (Lower channel support/Major FVG).
T2: 25,500 (Major weekly support).
Bullish Scenario (Counter-Trend/Bounce)
Justification: The macro trend remains bullish. A strong bounce from support is possible.
Trigger: A sustained move and close above 26,000.
Entry: Long entry on a confirmed 15-minute close above 26,000.
Stop Loss (SL): Below 25,850.
Targets:
T1: 26,100 (Retest of previous high).
T2: 26,277 (All-Time High).
Key Levels for Observation:
Immediate Decision Point: 25,750 - 25,900 zone.
Bearish Confirmation: Sustained trade below 25,750.
Bullish Warning: A move back above 26,000.
Line in the Sand: 25,500. Below this level, the risk of a deep correction increases significantly.
DABUR INDIA – AT A CRUCIAL SUPPORT ZONE1. Company Overview
Dabur India Ltd is one of India’s leading FMCG companies with deep roots in Ayurveda and natural healthcare.
It operates across Home Care, Personal Care, Healthcare, and Foods, serving both domestic and international markets.
The company’s ongoing strategy focuses on rural distribution expansion, premiumisation of products, and margin improvement through operational efficiency and cost control.
2. Technical Analysis
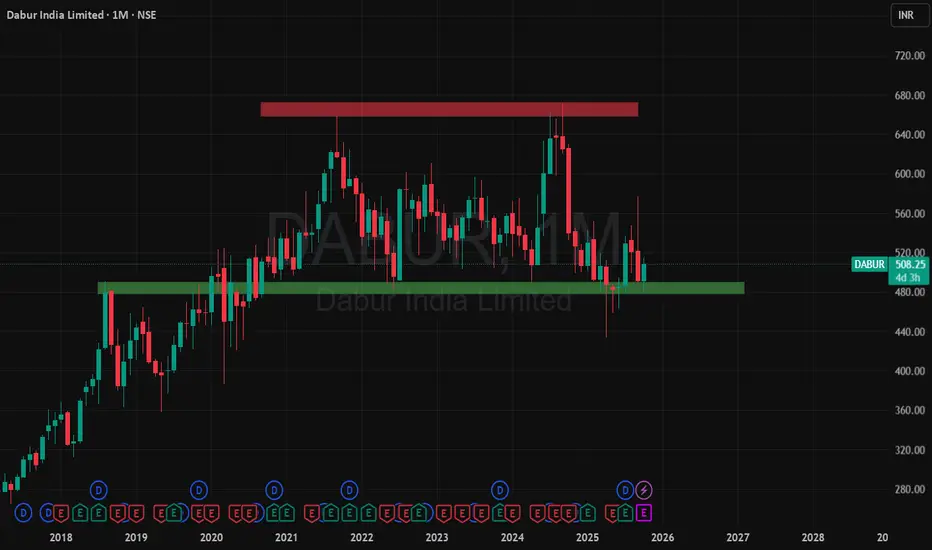
On the monthly timeframe , Dabur’s long-term trend shows a strong up-move — from below ₹10 in 2001 to an all-time high of ₹658 in 2021.
Since 2021, the ₹658–₹672 zone has acted as a major resistance , while the ₹470–₹490 zone has consistently provided strong support.
The same zone, which acted as resistance in 2018 , has now turned into a demand zone.
Currently, the stock is trading around ₹511 , exactly near the support region and showing signs of reversal from the demand zone. Projection & Key Levels:
If Q2 FY 2025–26 results come positive , the stock may move toward:
1st Target: ₹550
2nd Target: ₹600
3rd Target: ₹650
However, if this zone fails to sustain, there should be no further expectations, as the maximum swing low lies near ₹430.
This gives a clear roadmap for both upside potential and downside risk.
3. Financial & Fundamental Analysis (FY 2024–25)
Revenue (FY 2024–25): ₹ 12,563 crore vs ₹ 12,404 crore in FY 2023–24 (+1.3% YoY)
Net Profit (FY 2024–25): ₹ 1,740 crore vs ₹ 1,811 crore in FY 2023–24 (–3.9% YoY)
Revenue growth remained modest, while profit declined slightly due to margin pressures and cost factors.
Q1 FY 2025–26: Reported steady performance with stable volumes and controlled expenses.
Q2 FY 2025–26: Yet to be declared — this quarter will be crucial in deciding near-term price direction.
Debt Levels: Long-term borrowings have continued to decline, reflecting financial discipline and improved leverage.
Valuation: Dabur trades at a moderate premium to the FMCG sector average due to its strong brand portfolio and steady financial track record.
4. Technical Indicators Summary
RSI (14): ~63 — showing underlying strength, not overbought.
MACD: In buy mode, supporting short-term bullish sentiment.
Moving Averages:
MA 50 – ₹ 495
MA 100 – ₹ 492
MA 200 – ₹ 510 (currently acting as short-term resistance)
Support Zone: ₹ 470 – ₹ 490
Resistance Zone: ₹ 658 – ₹ 672
5. Combined View — Technicals + Fundamentals
Technically, the stock is taking support at a strong demand zone with clear upside potential if the next results are favorable.
Fundamentally, Dabur remains financially stable with a robust brand base and controlled debt.
A positive Q2 FY 2025–26 can act as a catalyst for a rally toward ₹ 550 / ₹ 600 / ₹ 650, whereas a break below ₹ 470 may extend the fall toward ₹ 430.
6. Conclusion
Dabur India stands as a fundamentally strong and technically interesting setup within the FMCG space.
The stock is trading near a long-term support zone, offering a good risk–reward setup for investors.
If Q2 FY 2025–26 results are strong, the stock may begin a fresh upward leg toward ₹ 650 levels.
Conversely, if the stock breaks below ₹ 470, the trend may remain weak toward the ₹ 430 zone.
For long-term investors, this zone offers a strategic accumulation opportunity backed by stability, strong distribution, and consistent brand power.