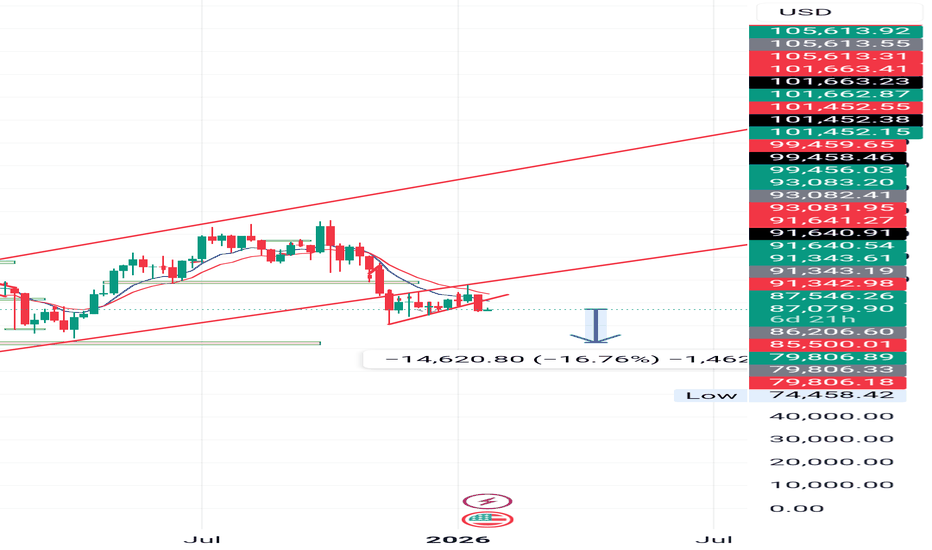
Bitcoin Is Reacting, Not Breaking, Patience Before the Next MoveWhen I look at this chart, I don’t see panic or trend failure. I see price pulling back into a clearly defined demand area within a rising structure and responding from it. That matters. If sellers were truly in control, price wouldn’t pause here, it would slice through demand without hesitation. In
Key stats
About Bitcoin
Bitcoin is the world’s most traded cryptocurrency, and represents the largest piece of the crypto market pie. It was the first digital coin and as such, remains the most famous and widely-adopted cryptocurrency in the world. It's the original gangster in whose footsteps all other coins follow. The birth of Bitcoin was the genesis of an entirely new asset class, and a huge step away from traditional, centrally controlled money. Today, many advocates believe Bitcoin will facilitate the next stage for the global financial system, although this — of course — remains to be seen.
Related pairs
Intraday Institutions Trading Option Pricing – How Premium Moves
Factors affecting premium
Underlying price movement.
Volatility levels (IV).
Time remaining for expiry.
Demand–supply and liquidity.
Strike price distance from spot.
How premium reacts
If underlying moves towards strike → premium increases.
If underlying mo
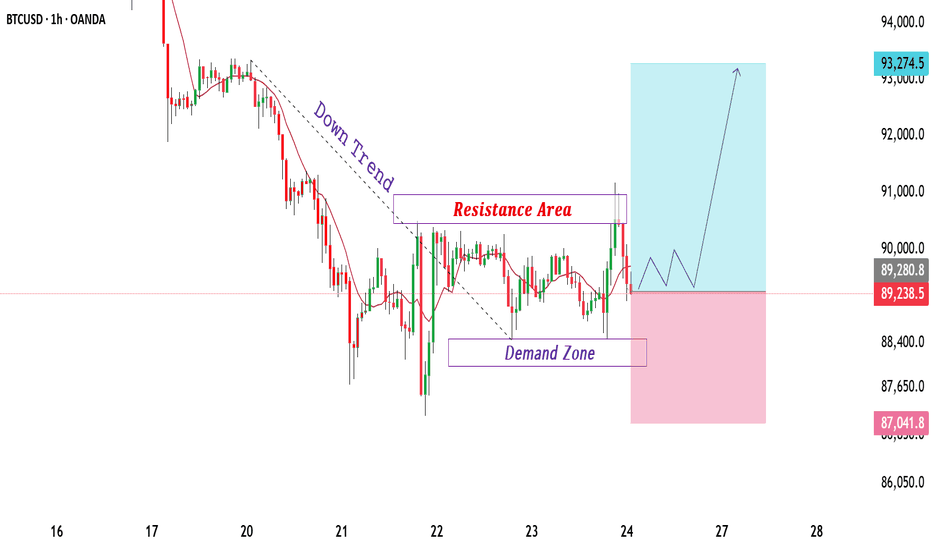
BTCUSD Trades Between Demand and Resistance Bearish Structure.BTCUSD is currently trading within a corrective structure after a strong bearish move, clearly respecting a descending trend. Price action shows lower highs and lower lows, confirming short-term bearish control. The marked resistance area near 90,800–91,200 has acted as a selling zone where price pr
Part 4 Technical Analysis Vs Institution Option TradingA. When to Buy Options
Breakout from consolidation
High volume at breakout
Trend confirmed
IV low → premiums cheap
Clear direction available
B. When to Sell Options
Range-bound market
No trending structure
IV high → premiums expensive
Event after event → IV crash expected
BTCUSD – Let the Structure DecidePrice is currently trading inside a well-defined rising channel, where both demand and supply are clearly respected.
This is not random volatility — it’s organized price movement.
After a strong impulsive move, Bitcoin has shifted into a controlled consolidation, allowing the market to absorb suppl
Rejection vs Acceptance🔎 Overview
Price interaction with a level does not automatically imply rejection or continuation.
One of the most common misinterpretations in price action is assuming that a sharp wick equals rejection or that a slow reaction equals weakness.
In reality, rejection and acceptance are defined by fo
See all ideas
Summarizing what the indicators are suggesting.
Oscillators
Neutral
SellBuy
Strong sellStrong buy
Strong sellSellNeutralBuyStrong buy
Oscillators
Neutral
SellBuy
Strong sellStrong buy
Strong sellSellNeutralBuyStrong buy
Summary
Neutral
SellBuy
Strong sellStrong buy
Strong sellSellNeutralBuyStrong buy
Summary
Neutral
SellBuy
Strong sellStrong buy
Strong sellSellNeutralBuyStrong buy
Summary
Neutral
SellBuy
Strong sellStrong buy
Strong sellSellNeutralBuyStrong buy
Moving Averages
Neutral
SellBuy
Strong sellStrong buy
Strong sellSellNeutralBuyStrong buy
Moving Averages
Neutral
SellBuy
Strong sellStrong buy
Strong sellSellNeutralBuyStrong buy
Displays a symbol's price movements over previous years to identify recurring trends.
Discover funds exposed to Bitcoin and find another way to access the coin.
Frequently Asked Questions
The current market capitalization of Bitcoin (BTC) is 1.68 T USD. To see this number in a context check out our list of crypto coins ranked by their market caps or see crypto market cap charts.
Bitcoin (BTC) reached its highest price on Oct 6, 2025 — it amounted to 126,272.0 USD. Find more insights on the BTC price chart.
See the list of crypto gainers and choose what best fits your strategy.
See the list of crypto gainers and choose what best fits your strategy.
Bitcoin (BTC) reached the lowest price of 2.2 USD on Oct 20, 2011. View more Bitcoin dynamics on the price chart.
See the list of crypto losers to find unexpected opportunities.
See the list of crypto losers to find unexpected opportunities.
The safest choice when buying BTC is to go to a well-known crypto exchange. Some of the popular names are Binance, Coinbase, Kraken. But you'll have to find a reliable broker and create an account first. You can trade BTC right from TradingView charts — just choose a broker and connect to your account.
Crypto markets are famous for their volatility, so one should study all the available stats before adding crypto assets to their portfolio. Very often it's technical analysis that comes in handy. We prepared technical ratings for Bitcoin (BTC): today its technical analysis shows the strong sell signal, and according to the 1 week rating BTC shows the sell signal. And you'd better dig deeper and study 1 month rating too — it's neutral. Find inspiration in Bitcoin trading ideas and keep track of what's moving crypto markets with our crypto news feed.
Bitcoin (BTC) is just as reliable as any other crypto asset — this corner of the world market is highly volatile. Today, for instance, Bitcoin is estimated as 7.17% volatile. The only thing it means is that you must prepare and examine all available information before making a decision. And if you're not sure about Bitcoin, you can find more inspiration in our curated watchlists.
You can discuss Bitcoin (BTC) with other users in our public chats, Minds or in the comments to Ideas.


