S&P 500Hello & welcome to this analysis
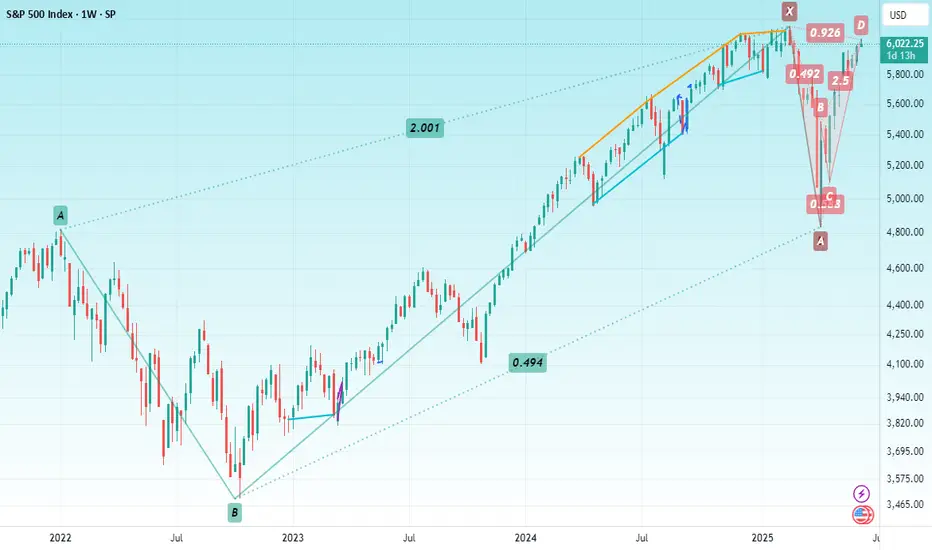
After making a monthly time frame Bullish Harmonic Reciprocal ABCD in April, the index has now formed a Bearish Harmonic Bat in daily time frame.
A pullback till 5800 - 5750 should not be ruled out as long as its below 6100
All the best
Bluechips4u
Nifty Mid_Select IndexHello & welcome to this analysis
From July 2022 to Sep 2024 it appears to have completed an impulse 5 waves up structure forming a Primary Wave 1
From Sep 2024 to Apr 2025 is a corrective ABC wave that has done a 38 Fibonacci retracement.
While it is too early to suggest whether that zigzag fall was a Primary Wave 2 or Wave A of B. The unfolding in the daily time frame suggest the probability of the former and start of a Primary Wave 3.
A weekly close above 13250 would increase the conviction of an impulse wave for probable levels where it could make swing highs along its path at approx 14300, 15000, 18000 & 20000.
Keep in mind where I have plotted Intermediate Wave 3 could also be an expanded Wave B. Therefore, keep an alternate count in hand till it gives more and more confirmation for bullishness.
I am going with the probability of this being a bullish structure as of now
All the best

BANKNIFTYHello and welcome to this analysis
Bank Nifty appears to be in its Elliott Wave 5 that is likely headed for 57500-58000
Approximate date as per Ichimoku Time & Wave theory is around 18th June
This rally is most likely initially going to be lead by large PVT banks and towards its end by PSU Banks
Plan your trade, trade your plan

NIFTYHello & welcome to this analysis
There is a good chance of the narrow range bound action that we are witnessing in the index to continue probably till the RBI policy, after that it could attempt a break on the upside.
The triangle outlook will be invalid if spot breaks 24525 on the downside.
Broader market specially Mid & Small caps continue to seeing buying.
Regards

MEDPLUS HEALTHHello & welcome to this analysis
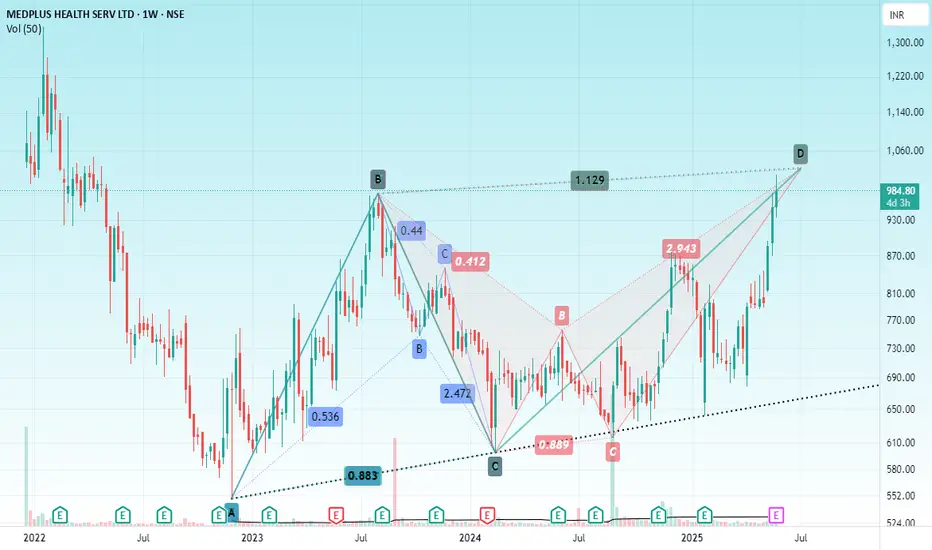
From a bullish Harmonic Bat pattern to a bearish Harmonic Alt Bat & bearish Harmonic ABCD in the weekly time frame.
Stock has entered in to potential reversal zone (PRZ) 1010-1050 of a bearish reversal probability.
Also note the 52w high and recent surge in price has come with low volumes.
A daily close below 940 could further pull it down towards 850-775.
Pattern negates if price moves above 1075
All the best
BANK NIFTYHello & welcome to this analysis
The index is completing its pullback forming a falling trendline.
It has good support between 54500-54000 while the trendline breakout would happen above 55500.
The upside potential for this expected breakout is 57500-58000
One could either wait for the trend line breakout or buy this last leg of dip.
Whenever Bank Nifty rallies it accelerates the Nifty trend also along with other sectors. Rarely does the index move in isolation.
All the best

MAX FINANCIAL SERVICES LTDHello & welcome to this analysis
The stock has entered the potential reversal zone (PRZ) in monthly time frame of double bearish harmonic patterns - ABCD & Deep Crab. The probable zone is between 1460 - 1500.
Since this is a monthly time frame pattern a bearish derivative trade would be risky as it could firstly take a lot of time to reverse after distribution and secondly the stop loss for the trade would be very high since the range is big.
This signal should be initially be taken as an alert not to attempt a fresh long at the current level and wait for some weekly to daily time frame weak signals to take a short trade if it reverses for 1300-1200.
The pattern would become invalid above 1600. The acceleration for downside would happen once it starts sustaining below 1400 (as of now), this will keep changing week on week till the pattern is valid.

JIO FINANCIAL SERVICESHello & welcome to this analysis
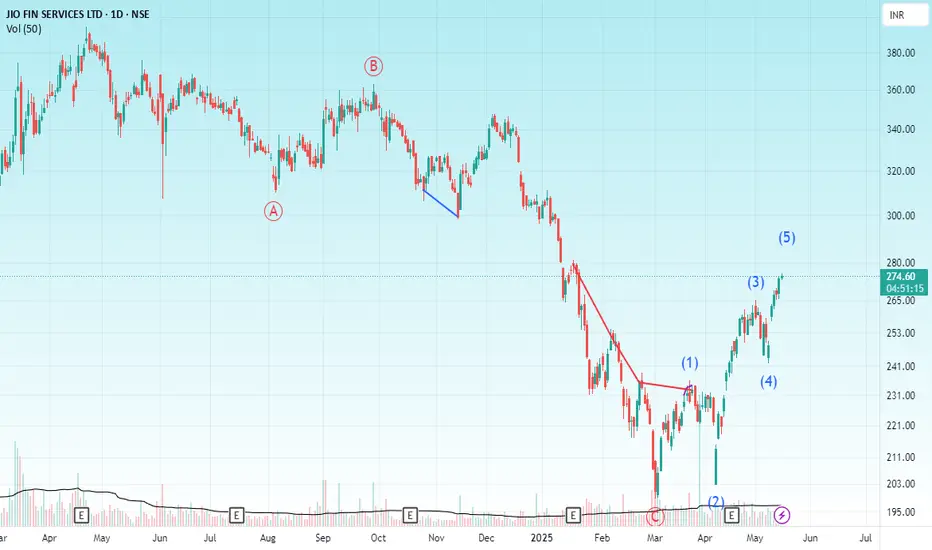
The decline from May 2024 till Mar 2025 appears to be an Elliott Wave corrective ABC that went on to make its all time lows breaking the previous one made in Oct 2023.
The rally in Mar 2025 was a Leading Diagonal Impulse Wave 1
It was followed by Wave 2 - a corrective ABC which did a 88% retracement giving a double bottom in early April 2025.
From there started the strongest & most reliable Elliott Wave - 3 that lasted the full month of April 2025.
Since Wave 2 was deep the corrective Wave 4 did a zigzag and ended quickly mid May 2025.
The terminal wave 5 of the larger Wave I is coming to an end around 275 - 280.
This could lead to another round of corrective ABC which could be the larger Wave II in the making. Likely levels till where it could retrace its formation could be 255 at least, 240 probable & 205 hopefully maximum. Anything below Mar 2025 lows will make the Impulse wave rise as invalid.
On the other hand, if the current wave continues to sustain beyond 285-290 then it could be unfolding a Wave 3 extension that could lead to much higher levels.
Conclusion
For buyers - wait for it to sustain above 285-290 to add, else wait for a dip to 255 - 240 and then review
For sellers - between 275-280 wait for a bearish candle follow through keeping 285-290 as a stop loss.
All the best
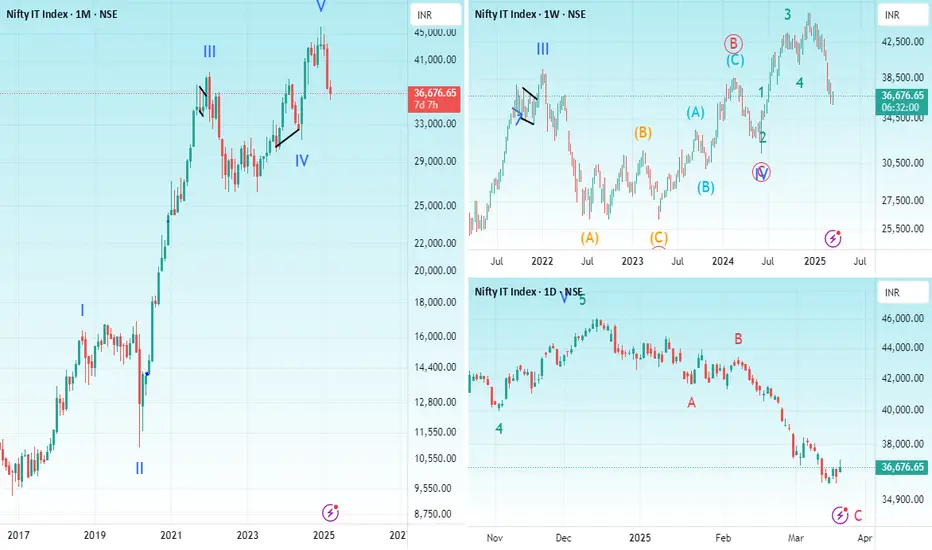
NIFTY ITHello & welcome to this analysis
NIFTY IT (CNXIT) appears to have completed in
Monthly from 2016 lows an impulse 5 waves up
Weekly shows a running flat wave 4 followed by sub waves of the terminal 5th wave
Daily indicates post the impulse an ABC corrective ended (ending)
is this A of abc down after a monthly 5 up or is it wave 2 complete with this ABC?
It is too early to say the latter. Normally the corrective tends to retest the start of the preceding sub wave 4 that is around 31000 but that is not mandatory as per Elliott Wave rules.
An early indication of which wave is unfolding will depend on how the sub waves come out now, either they will be corrective, then it would be B of abc or they will be impulse then wave 2 has ended and index is into Wave 3.
Interesting days ahead for IT index
All the best
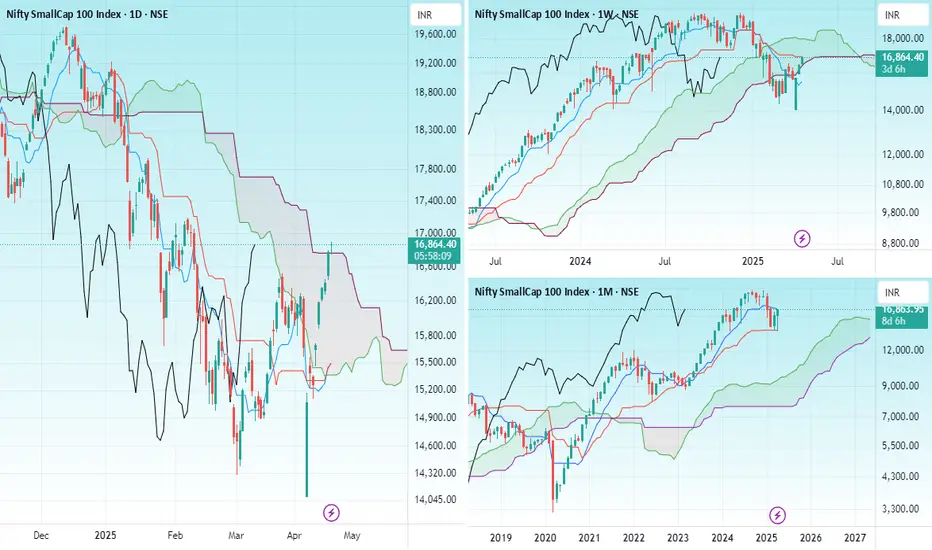
SMALL CAP INDEXHello & welcome to this analysis
The index gave a sharp bounce back like the rest of the market and is now near a cluster resistance - monthly, weekly & daily @ 16900.
It could consolidate in this zone before trying a breakout for 17500 else dip down to 16000 where it has good support.
Fresh buying in small caps at current levels for short term should be done with caution else wait for breakout above 16900 or dip down to 16000 approx.
ICICI BANKHello & welcome to this analysis
A bearish Harmonic Crab pattern has been activated in the daily time frame suggesting downside levels till 1350-1300 probable if it starts sustaining below 1390 which is a line of support as of now.
Its made a gap down today, any pullback till the gap area could witness another round of selling.
The pattern negates above 1465

DLFHello & welcome to this analysis
In the hourly time frame after a steep correction followed by consolidation its now on the verge of an Inverse Head & Shoulder breakout above 695 for probable upward levels of 740 & 800.
It has very good support near 670 as shown by the Ichimoku Kumo
All the best

CRUDE Hello & welcome to this analysis
WTI OIL is at the PRZ of a bullish Harmonic Cypher pattern suggesting a bounce/reversal from current levels.
Crude (MCX) however does not have any bullish harmonic patterns at the moment, normally, we do see them in sync, however, this time maybe due to a strong INR the pattern is not seen.
One can take a trade tracking USOIL / WTI either above $57.85 (60m close) with swing low as stop loss or take a bullish trade here with $55.95 as stop loss.
The targets are 38-50-62 Fibonacci levels as marked in the chart
All the best

USD INRHello & welcome to this analysis
USDINR topped out on 10th Feb @ 88 to see a sharp reversal all the way till 4th April when it formed a bullish Harmonic Deep Crab pattern @ 85 that too lead to a more sharper bounce back till 9th April when it formed a bearish Harmonic Reciprocal ABCD pattern near the top end of the slanting channel.
From there we have witnessed yet another steep downward move which is currently resting at the lower end of the slanting channel. Failure to hold 84.45 - 84.35 could lead to a further downward move till 83.70 where it would attempt to form a bullish Harmonic ABCD pattern that could coincide with DXY bullish harmonic pattern near 95.
So if you have exposure to currency for any reasons whatsoever - overseas trips, college fees, business, commodities trading, etc - this might be of help to you.
Disclaimer - Not a trading advise, kindly do your study carefully before taking a decision

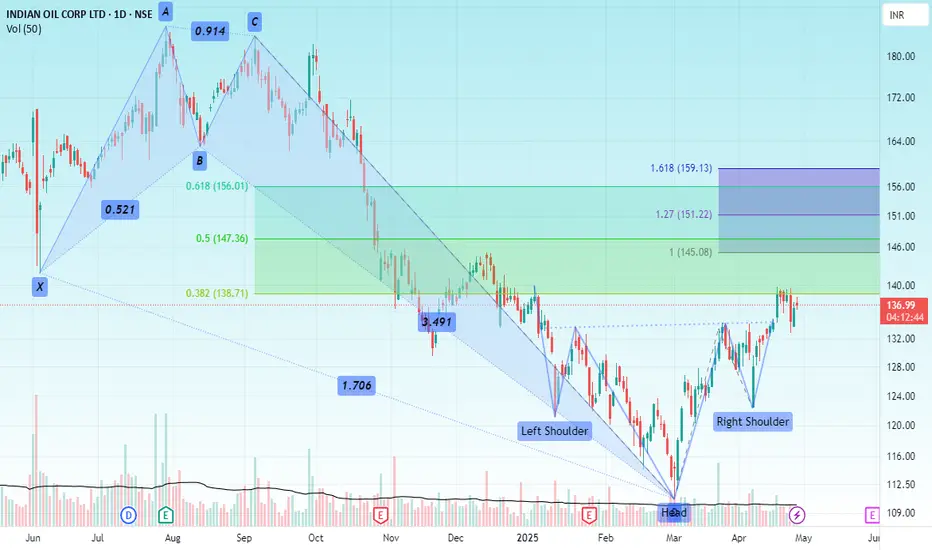
IOCHello & welcome to this analysis
A deep 6 months correction lead to the formation of a Bullish Harmonic Crab pattern in March 2025 post which during accumulation (consolidation) phase formed an Inverse Head & Shoulder.
A 38% retracement of the bullish harmonic pattern has been done and now its completing a pullback of the IHS breakout by retesting the neckline.
Potential upside levels are 145 and 160 for both the IHS & Bullish Harmonic Crab
All the best
GOLDHello & welcome to this analysis
GOLD is giving a hourly H&S breakdown suggesting targets of $3134 (Comex) / 91000 (MCX) with a pause near $3190 / 92750

GOLD / SILVER SPREADSHello & welcome to this analysis
GOLD/SILVER (COMEX) ratio charts has done 1.62 Fibonacci of its Inverse Head & Shoulder breakout.
It has immediate parallel channel resistance near 109, if it breaks above it then next resistance is at 118 where it has a Bearish Harmonic Bat.
Current support is at 102, below that it could test the breakout level at 92

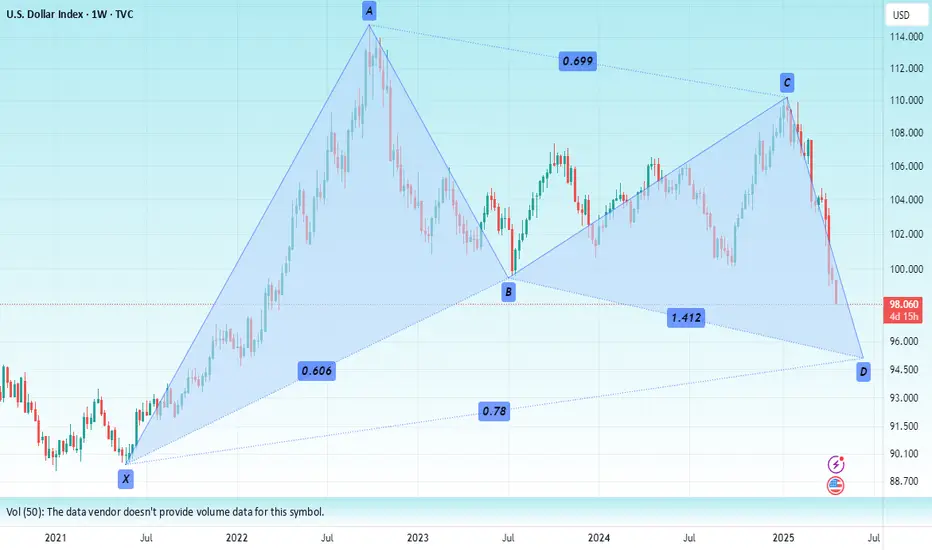
Dollar IndexHello & welcome to this analysis
Current decline in DXY could still continue all the way till 95 where it has a Bullish Harmonic Gartley.
At the current moment big resistance at 99-100, only above that a move towards 101.50 & then 1003
USDJPYHello & welcome to this analysis
It failed to reverse from the Bullish Harmonic Cypher pattern.
Now next bullish harmonic pattern is the Alt Shark at 137.75 while 141.80 appears to be a very strong resistance now

ZYDUS LIFE SCIENCEHello & welcome to this analysis
The co gets 50% of its revenue from USA where new policies appear to be hurting the top and bottom line of the stock.
Narrow range 840 - 950, wider range 650 - 1025.
Idea is to buy either after it sustains above 950 or near 650
Happy Investing and all the best with your trading

MphasisHello & welcome to this analysis
Stock could be forming a cup & handle pattern in the monthly time frame with the lower leg of the handle coming to an end.
2000 is an extremely important level for the stock in the short term, while it has loads of resistance between 2300-2800 on the upside as it attempts to complete the handle.
Overall weakness continues below 2000, else one could expect stock to rise steadily towards completion of the bullish pattern

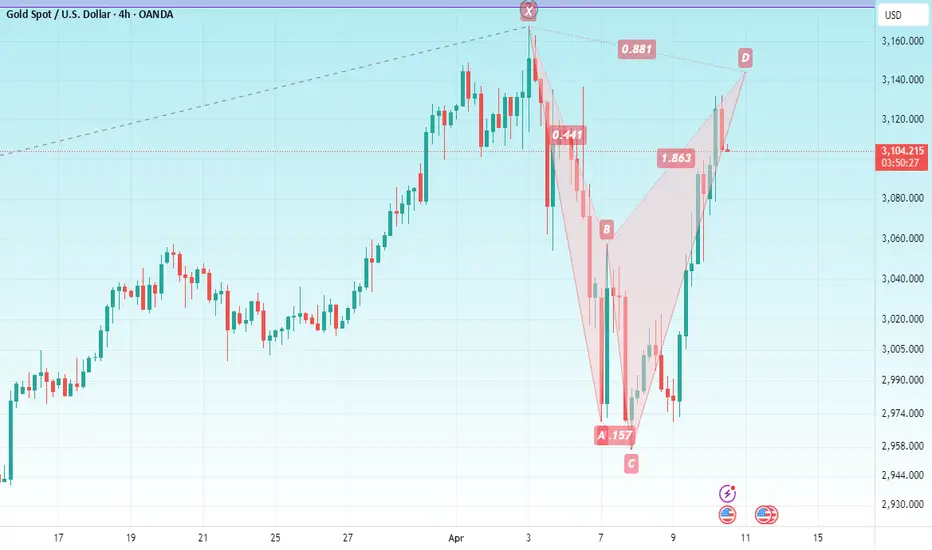
GOLDHello & welcome to this analysis
GOLD (Comex) 4hrs is going to enter the potential reversal zone of a bearish Harmonic Shark pattern between $3135 - $3155. Pattern negates above $3167.
Probable retracement levels $3100 / $ 3075 / $3025 / 2950
If it sustains above $3170-$3200 it gets v strong and will attempt $3300
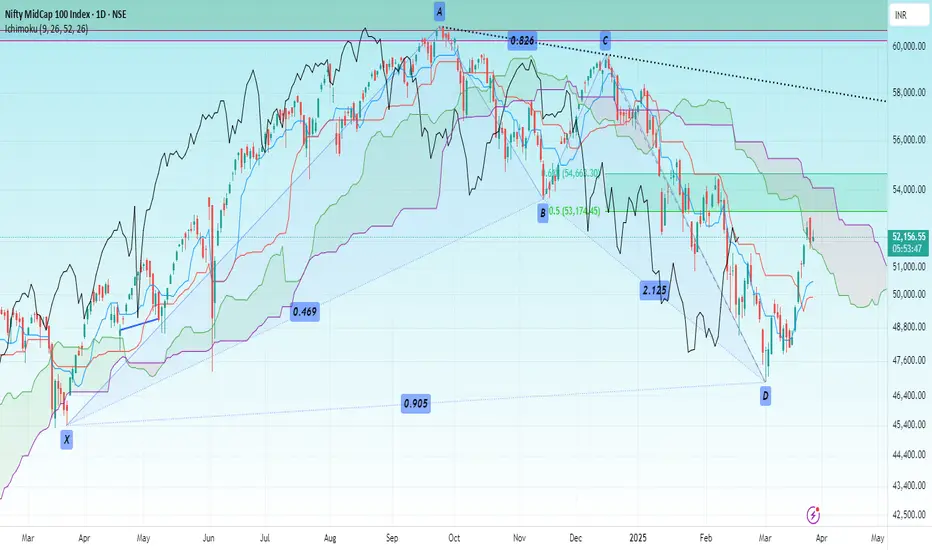
MIDCAP INDEXHello & welcome to this analysis
The index after a steep decline formed a bullish Harmonic Bat reversal pattern.
At the 50% retracement level it has formed a three candlestick bullish signal - Upside Tasuki Gap suggesting further upside.
As long as it sustains above 51500 it could continue its up move till 54500 that is the 62% retracement and above that 57500 that coincides with the trend line resistance.
All the best