XAUUSD – Short-Term Bearish Momentum Strengthens After US DataOANDA:XAUUSD is under clear short-term selling pressure after yesterday’s stronger-than-expected US data. Both PPI and Core PPI for July rose by 0.9% month-on-month, far above the 0.2% forecast, signaling higher producer inflation. At the same time, Initial Jobless Claims fell to 224K, better than the 225K estimate, showing a resilient labor market.
This combination has strengthened expectations that the Fed will stay cautious on rate cuts, boosting the USD and weighing on gold.
Technical picture:
Price has broken out of its previous uptrend and is now moving entirely inside a descending price channel.
The 3,358 USD zone is acting as dynamic resistance, aligned with the upper boundary of the channel and EMA 34/89.
Current structure favors selling on rallies towards resistance, with a target at 3,320 USD – near the recent swing low and lower channel boundary.
If bearish momentum holds, a further drop towards 3,300 USD remains possible in the short term.
Short-term idea: Sell zone 3,355–3,358 USD, stop above 3,365 USD, take profit around 3,320 USD.
Breakout!

RALLIS - Ready for Momentum BurstNSE:RALLIS
Technical Analysis
⦿ Its moving in a good uptrend with stair pattern in a Wide channel.
⦿ On 15th of July company posted good results but since than - the stock is just consolidating now its been 1 month, Now it will be time to capitalize on that good earning.
⦿ The current base is clean and a static resistance is formed @386
⦿ Price is Approaching for 3rd time and from last 3 days upmove volume has surged.
⦿ Planning a trade above resistance and keeping a simple 2% stoploss to capture 10% Move.
🟢Entry - 386
♦️Stop - 375
🎯Tgt - 400,425+
The above information is for educational purposes only.
Before acting on any investment idea please do your own analysis and follow proper risk-to-reward, position sizing rules
⦿ If you found this idea Useful, please like and comment 👍💬
Keep Learning,
Happy Trading 🤞**

STAR CEMENT LTD | Strong Breakout After Long-Term Consolidation 📝 Description:
📌 Stock: STAR CEMENT LTD (NSE)
📅 Timeframe: 1D (Daily)
📈 Breakout Date: 04-Aug-2025
💼 Sector: Cement / Infrastructure
⚡️ Technical Setup:
Breakout Above Long-Term Resistance:
Price has finally broken through the ₹240–₹256 resistance zone, which had capped upside for nearly a year.
Strong Volume Confirmation:
The breakout is accompanied by a significant rise in volume, adding credibility to the move and indicating strong buyer interest.
Bullish Market Structure:
Price has shifted into a higher high–higher low structure over the last few weeks, confirming momentum build-up.
Range Built-Up Base:
Price consolidated within ₹190–₹240 for over 10 months, creating a solid foundation for the breakout.
🔍 Key Observations:
📊 Chart Pattern:
The chart shows a horizontal breakout from a long-term consolidation zone between ₹240–₹256. This breakout signals a bullish continuation, as the stock pushes above a multi-month supply zone with strong momentum.
📈 Recent Price Action:
• The stock gave a clean breakout on 04-Aug-2025, closing above the resistance zone required with strong follow-through.
• The rally was supported by 2.5× surge in volume, indicating institutional interest.
• Price structure shows confirming trend reversal from range-bound to bullish.
• This breakout comes after 10+ months of consolidation, adding more weight to the move.
Add-ons:-
✅ Clean breakout with follow-through above ₹256.
🔼 No immediate supply zone until ₹280–₹290 range.
🔁 ₹240 now becomes a key support level.
📊 Increasing volume supports institutional accumulation possibility.
📌 Trade View:
Aggressive Entry:
• Entry around current levels if price holds above the breakout zone (₹256+).
• Use a stop-loss as per your risk plan.
Conservative Entry:
• Wait for a retest of the breakout zone (₹240–₹256) with confirmation through price action and volume support.
• Ideal for traders preferring high conviction and lower risk.
•Bias: Bullish
•Support: ₹240 (flip level), ₹225 (minor swing)
•Invalidation: Close below ₹240
🧠 Rationale:
The long base, clean breakout, and strong volume together suggest a high-probability bullish continuation. Absence of nearby resistance offers a decent runway towards the ₹280–₹290 zone. This move is also backed by strength in the broader cement sector.
🚨 Disclaimer: This is not financial advice. All views are shared for educational purposes only. Always do your own research and manage risk responsibly before making any trading decisions.
What is your view please comment it down and also boost the idea this help to motivate us.

HINDUSTAN UNILEVER LTD – Technical Analysis________________________________________
🧠 HINDUSTAN UNILEVER LTD – Technical Analysis
Ticker: NSE: HINDUNILVR | Sector: FMCG
Current Price: ₹2,521.20 ▲ (+3.44% on July 31, 2025)
Technical View: ⭐⭐⭐⭐ | Chart Pattern: Volume-Driven Range Breakout
________________________________________
Latest News & Developments
Hindustan Unilever (HUL) reported strong Q1 FY26 results, with standalone net profit rising 7.6% YoY to ₹2,732 crore and consolidated profit up ~6%. Revenue grew ~4–5% YoY, aided by a rural demand rebound and volume-led gains in home care and beauty segments. While demand recovery is still gradual and margin guidance has been trimmed, the company is ramping up investments for future growth. A key structural change includes the demerger of its Kwality Wall’s ice-cream business by FY26-end. Leadership transition is also underway, with Priya Nair set to take over as CEO & MD from August 1, 2025. Shares surged 3.5% on July 31 to ₹2,521.85, outperforming the market.
________________________________________
Technical Analysis & Chart Pattern
Hindustan Unilever Ltd (HUL) has broken out above a key resistance zone of ₹2,440–2,445 on the daily chart, supported by strong volume and a bullish candle. This move ends the prior consolidation phase between ₹2,136–2,602. Momentum indicators such as RSI (~70), MACD, and moving averages show a bullish bias. If the price sustains above ₹2,500, the stock may trend toward resistance levels at ₹2,573, ₹2,625, and ₹2,702. Key support levels lie at ₹2,445, ₹2,368, and ₹2,316.
________________________________________
Trade Analysis (SEBI-Compliant | Educational Purpose Only)
As per the chart structure, the stock has shown a breakout above the ₹2,440–2,450 zone on strong volume, currently near ₹2,521. If momentum sustains, potential price zones to watch are ₹2,575–2,625 in the near term and ₹2,700+ in the medium term. A logical risk level could be around ₹2,395 or near the breakout point of ₹2,440.
________________________________________
Technical & Sentiment Snapshot
The stock recently broke out with strong volume, indicating accumulation post-consolidation. A pullback toward ₹2,440–2,430 may test the breakout zone, while a move to ₹2,360–2,316 could signal range re-entry. Sustained trade above ₹2,500–2,520 may indicate trend continuation. Market participants are watching volume behaviour on dips and potential sentiment shifts under new leadership. Key risks include broader market weakness, margin pressures, and rural/urban demand trends.
________________________________________
Educational Insight for Learners
A classic breakout occurs when a stock trades within a defined range (support and resistance) and then moves sharply beyond that range with strong volume. To identify such setups, observe the range boundaries, wait for a confirmed close outside the range, and ensure volume rises on the breakout. Entry is ideally near the breakout, with a stop just inside the range and targets based on the range height. The recent price action in HUL aligns well with this rectangle breakout concept — a valuable pattern for learners to study.
________________________________________
⚠️ Disclaimer & Educational Note
This content is strictly for educational and research purposes only. I am not a SEBI-registered advisor, and no buy/sell recommendations are being provided. All insights are based on personal analysis and experience and are not financial advice.
📘 This setup illustrates how combining price action (candlesticks), support/resistance zones, volume, and indicators like RSI or MACD can help build conviction in trades. However, trading—especially in derivatives like options—involves high risk, and losses can exceed the initial investment.
👉 Always do your own research and consult a SEBI-registered advisor before taking any position.
👉 Use strict risk management and only trade with capital you can afford to lose.
The author assumes no liability for any losses incurred.
By engaging with this content, you agree to these terms.
________________________________________
💬 Found this helpful?
Drop your thoughts, questions, or insights in the comments below ⬇️ — let’s learn together!
🔁 Share this post with your trading friends and community — help them discover clean charts, structured setups, and zone-based learning.
✅ Follow simpletradewithpatience for clear setups, educational content, and a no-nonsense approach to price action, supply-demand zones, and risk-managed trades.
🚀 Trade with patience. Trust your charts. Stay clear-headed.
Because the goal is not just to trade — it's to trade better.
Be Self-Reliant | Trade with Patience | Learn with Charts & Zones 📊
________________________________________

Behind the Inverted Head & Shoulders – Beyond the ObviousThe Inverted Head & Shoulders isn’t just a pattern—it’s a storyline of market sentiment shifting gears.
Here’s the anatomy:
Step 1: Price creates a low and bounces.
Step 2: It returns to the same zone but pushes deeper, making traders believe a downtrend is locked in.
Step 3: The market snaps back with a V-shaped recovery—a sign of aggressive buying pressure.
Step 4: A higher low forms, confirming that sellers are losing control.
Step 5: Price revisits the neckline (trendline resistance), testing whether buyers can truly take charge.
This isn’t prediction—it’s recognition. Recognizing this shift early is what separates reactive traders from strategic ones.

MYROUSDTThe chart shows MYRO/USDT (Daily timeframe) breaking above a long-term descending trendline, signaling a potential bullish breakout.
Key observations:
Price has been in a prolonged downtrend but is now attempting to reverse.
A clean breakout above the descending resistance line is visible with strong bullish momentum.
The breakout is accompanied by increased volume (32.65M), adding strength to the move.
Immediate resistance is seen around the 0.03076 USDT level.
Sustaining above the breakout zone could lead to further upside, while falling back below the trendline may signal a false breakout.
This is a classic trendline breakout setup, and traders may watch for retests or confirmation candles for potential entries.

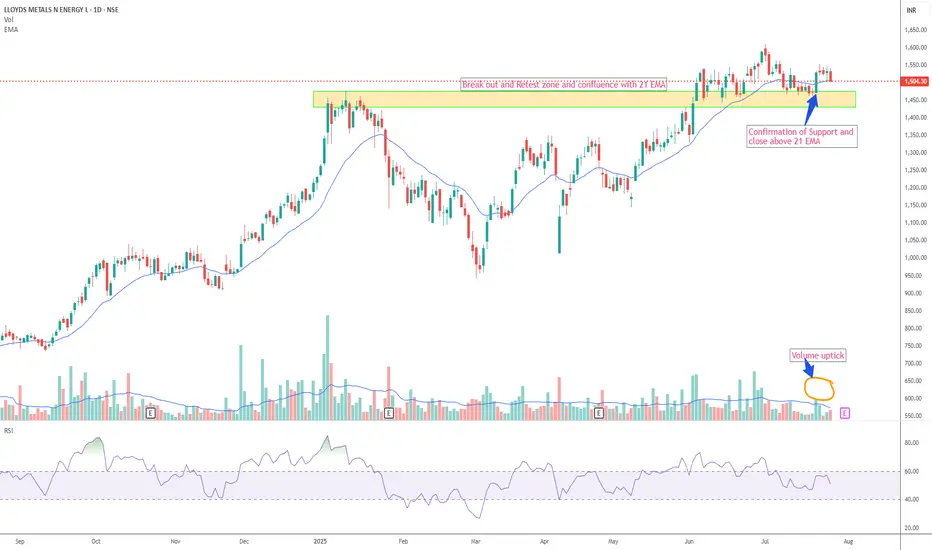
LLOYDSME – Breakout Retest with 21 EMA ConfluenceAs part of my personal trading strategy, I am closely watching LLOYDSME, which is currently retesting a recent breakout zone and hovering near a key support level. This area also coincides with the 21 EMA on the daily chart, adding to the technical confluence.
I am considering a long position if the price action confirms support at this level, in line with my predefined risk management rules. From my perspective, the current chart structure offers a potentially favorable risk-reward setup, with scope for upward movement if the retest holds.
Disclaimer
This analysis reflects my personal views and is shared for educational and informational purposes only. It does not constitute investment advice or a recommendation. I am not a SEBI-registered investment advisor. Please consult a qualified financial advisor and do your own due diligence before making any investment decisions.
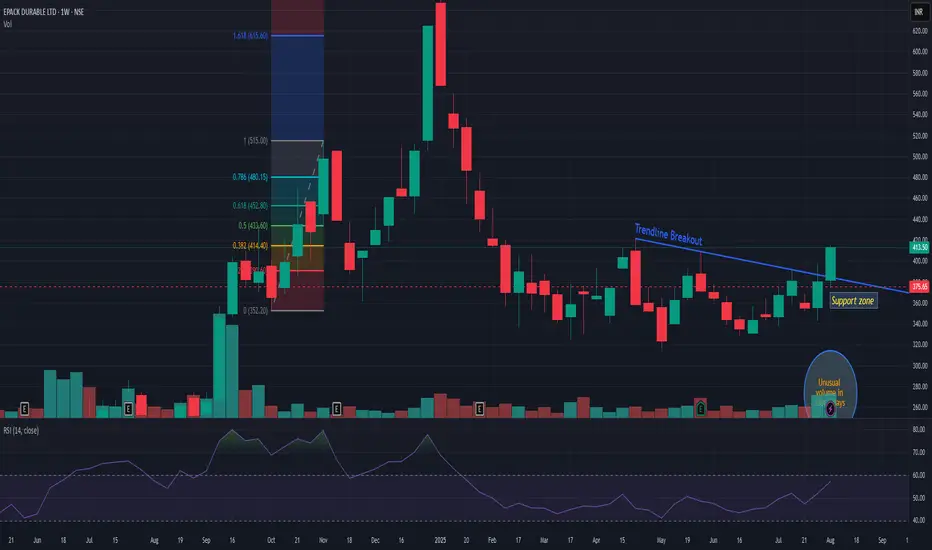
EPACKEPACK showing good strength after long bearish and then consolidation zone. It has been consolidating since February after steep fall from 660 levels. Now 390 is very strong support zone. So closing below it may change my view. On upper side I can see 510/85 resistance zone.
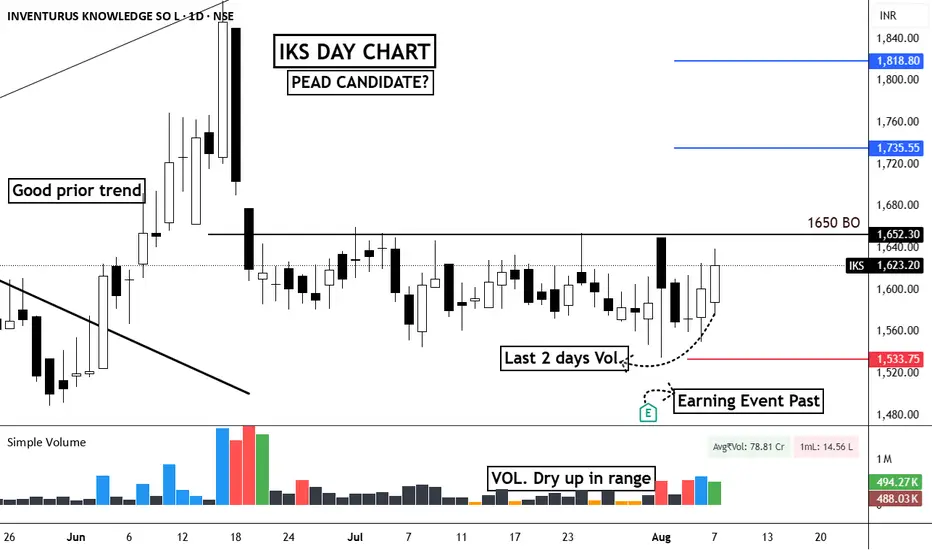
PEAD in Inventurus Knowledge (IKS)EQUITY SWING SETUP 📊
#IKS | Daily Chart Analysis
🔹Structure:-
Price is forming a rounded bottom inside a range, showing Volume Dry-Up during the consolidation phase.
Earnings event is past, reducing uncertainty, and the last two days show pickup in volume, hinting at accumulation.
Key breakout level is ₹1650, above which momentum can accelerate — possible PEAD (Post-Earnings Announcement Drift) candidate.
🟢ENTRY:
Buy above ₹1655 with strong volume confirmation.
♦️RISK:-
Stop Loss: ₹1533 (below recent swing low & support zone)
🎯TARGETS:-
1st Target: ₹1735
2nd Target: ₹1818
📌Detailed Analysis:
Volume dried up significantly during the range, a classic sign of weak hands exiting.
The base is tight, indicating strong hands holding.
Breakout above ₹1650 could trigger a quick momentum burst, especially given the post-earnings context.
Watch for strong volume on breakout day to confirm institutional participation.
📈Mark the levels on your chart and track price behavior near the breakout zone.
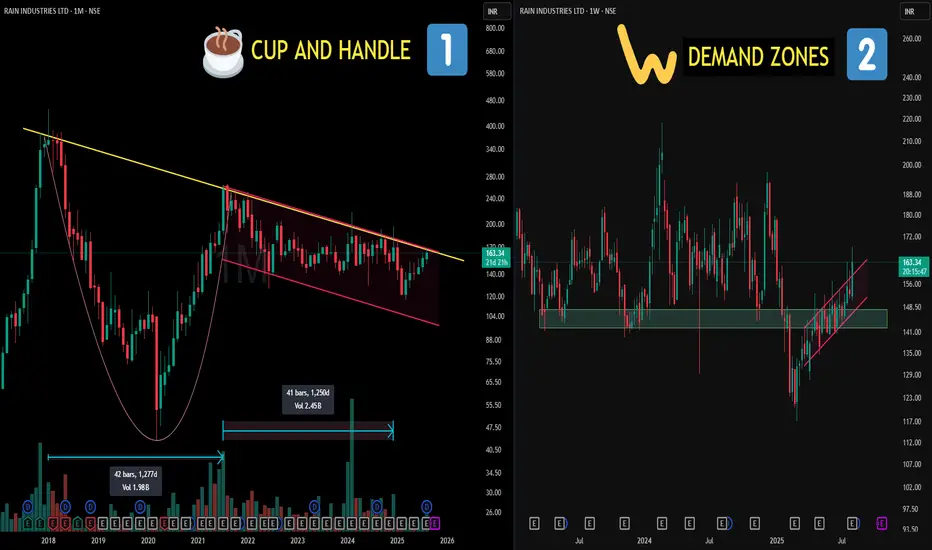
2500 Days of Structure? CUP & HANDLE Decoded!📌Left Side (Chart 1: Monthly TF)
🧠 Cup and Handle Pattern:
A bullish continuation pattern that resembles the shape of a tea cup on longer timeframes. The “cup” shows a gradual rounded bottom (accumulation phase), followed by a smaller downward or sideways "handle" (last shakeout), often before strength resumes. It reflects long-term accumulation and investor confidence.
📈 Cup Duration in this case : 1277 days (approx. 3.5 years)
🧠Parallel Channel (Handle):
A price structure where two trendlines contain price movement within a defined up or down slope. Often marks controlled consolidation or correction — neither side is dominating, until one breaks.
📈 Handle Formation in this case : 1250 days (approx. 3.4 years)
📌 Right Side (Chart 2: Weekly TF)
🧠 This is the zoom lens on the handle zone:
📍A key Demand Zone was breached temporarily… but reclaimed with conviction.
📍 Strong re-acceptance and consolidation followed, showing organized price behavior.
📍 The upper trendline of the parallel channel is where price recently pushed through — again, no forecasting — just a structural breakout from a well-defined zone.
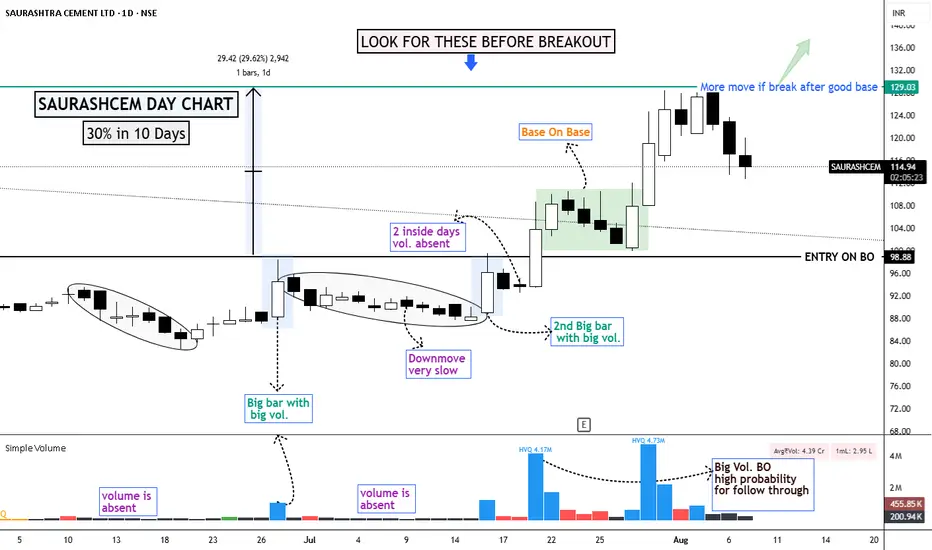
Recent Winner Study - SAURASHCEMNSE:SAURASHCEM
Perfect example of how a clean base + quality breakout can lead to a strong move.
🔹 Stage 1 Base formed with multiple rejections near ₹99 level — price coiling in a tight range.
🔹 Volume dried up during the base — a healthy sign of supply exhaustion.
🔹 Notice the slow downmove and 2 inside days with low volume – signals a lack of aggressive sellers.
🔹 Then came the 2 big volume bars, breaking out with conviction – exactly what you want to see.
🔹 Entry trigger was the breakout above ₹99
Now in Stage 2 with strong follow-through.
📈 More upside likely if a good base forms again near recent highs (~₹129).
✅ Key Takeaway:
Breakouts backed by clean structure and big volume have higher odds of success. Avoid noisy setups, wait for quality.
The above information is for educational purposes only.
Before acting on any investment idea please do your own analysis and follow proper risk-to-reward, position sizing rules
⦿ If you found this idea Useful, please like and comment 👍💬
Keep Learning,
Happy Trading 🤞
UltraTech Cement | Pullback Opportunity after Breakout?Description:
- After breaking out of a consolidation zone, UltraTech Cement is showing a controlled throwback towards prior resistance, now acting as support.
- Weekly structure remains intact with sloping EMAs and positive momentum.
- Daily & Hourly charts show minor weakness but no structural breakdown.
- EFI suggests lower TF selling pressure, while weekly remains stable.
📌 Entry Zone: ₹12,037
📉 Stoploss: ₹11,850 (ATR-based)
🎯 Targets: ₹12,937 → ₹13,139 → ₹13,427
Cement sector is gaining strength in the broader infra rally — watching for confirmation on bounce from support.

Gold Surges on Weak NFPHello everyone, what’s your take on XAUUSD?
Gold prices soared at the end of the last session and are now trading around $3,380. This sharp rise followed a weaker-than-expected U.S. Non-Farm Payrolls (NFP) report, which shifted market sentiment toward expectations that the Fed may delay interest rate cuts. As a result, the U.S. dollar weakened and demand for gold as a safe haven surged.
Technically, gold appears to be forming a cup and handle pattern, with the first resistance target at $3,400, followed by $3,435.
What do you think? Could this rally continue? Let us know in the comments!

Godfrey Phillips India - Breakout Setup, Move is ON...#GODFRYPHLP trading above Resistance of 6771
Next Resistance is at 9804
Support is at 4339
Here are previous charts:
Chart is self explanatory. Levels of breakout, possible up-moves (where stock may find resistances) and support (close below which, setup will be invalidated) are clearly defined.
Disclaimer: This is for demonstration and educational purpose only. This is not buying or selling recommendations. I am not SEBI registered. Please consult your financial advisor before taking any trade.

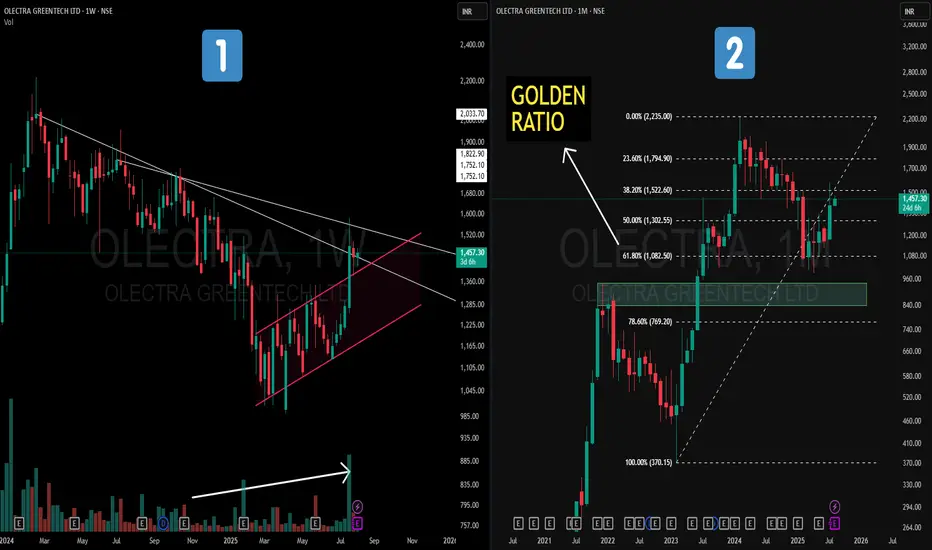
Olectra Greentech – Golden Ratio on MTF + Hidden channel on WTF📝 Description
📌On the Weekly Chart (Left) – Price action has formed a strong counter-trend (CT) breakout from a prolonged downtrend. Hidden within the structure is a parallel channel (highlighted in pink), with volume gradually increasing in the recent rally — a positive sign of accumulation.
📌On the Monthly Chart (Right) – A Fibonacci retracement drawn from the Feb 2023 low to the Feb 2024 high (a one-year strong uptrend) shows price taking support exactly at the 61.8% Golden Ratio. This reaction from a key retracement zone is aligned with historical technical behavior.
This is not a forecast, but rather a technical observation of structure, retracement behavior, and volume dynamics.
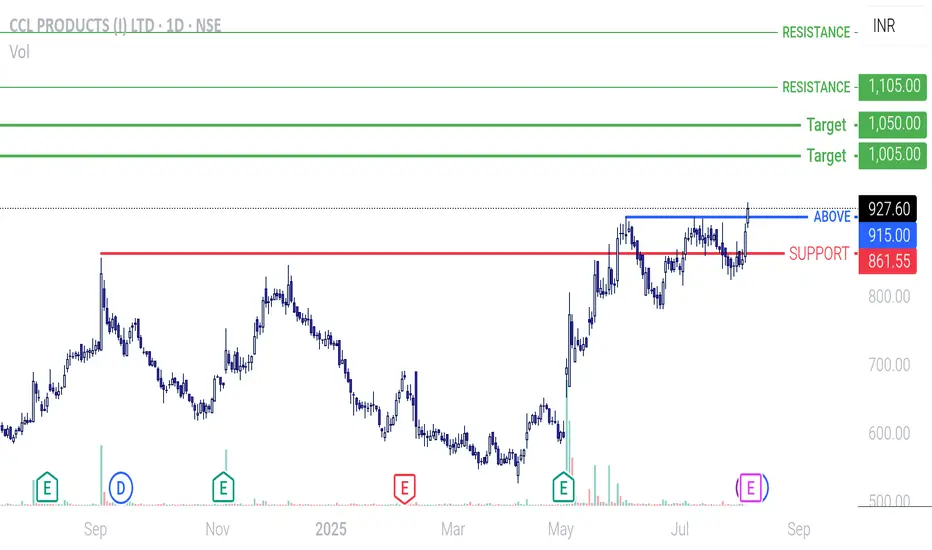
CCL ProductsCCL Products is a global leader in private-label coffee manufacturing. It has a diversified client base across 90+ countries, strong R&D, and efficient operations. For FY24, revenue grew 10% YoY , and PAT rose 21% . The company maintains healthy EBITDA margins (20%) and a strong ROE (18%). Expansion into premium segments and freeze-dried coffee, plus capacity additions in Vietnam and India, support long-term growth. The balance sheet has moderate debt and steady cash flows.
Breakout was witnessed today above a consolidation zone, indicating potential for further upside.
Strong fundamentals backed by technical bullishness make CCL Products a good long-term and swing-trade candidate.
Supply & Demand + Patterns: A Simple Yet Powerful Swing StrategyExplore how supply-demand zones interact with patterns to create high-probability setups. This session breaks down rallies, pullbacks, and a simple process to start building a reliable swing trading strategy . Clear, structured, and beginner-friendly.

Gold regains shine after Fed shiftHey traders! Let’s break down what’s been happening with XAUUSD recently.
Last week, gold made a stunning comeback — tumbling first, then surging nearly 800 pips within just a few sessions. This rapid shift was fueled by dovish signals from the Fed and soft US jobs data, which sparked growing expectations of early monetary easing.
At the same time, a global financial survey shows analyst sentiment toward gold at its highest in months. With ongoing global uncertainty, gold is once again in the spotlight as a go-to safe haven.
Despite the rally, volatility remains elevated. The next move will likely depend on upcoming economic data and fresh comments from Fed officials. Meanwhile, holiday trading could mean slower market activity in the short term.
From a technical perspective, gold has broken out of its previous downtrend channel and is moving rapidly. According to Dow Theory, a short pullback may occur — but if price holds above key support, the bullish wave could extend toward the $3,416 level, marked by the 1.618 Fibonacci extension.
This breakout might just be the beginning of a new bullish phase after weeks of sideways action.
What’s your take — is gold gearing up for something bigger?

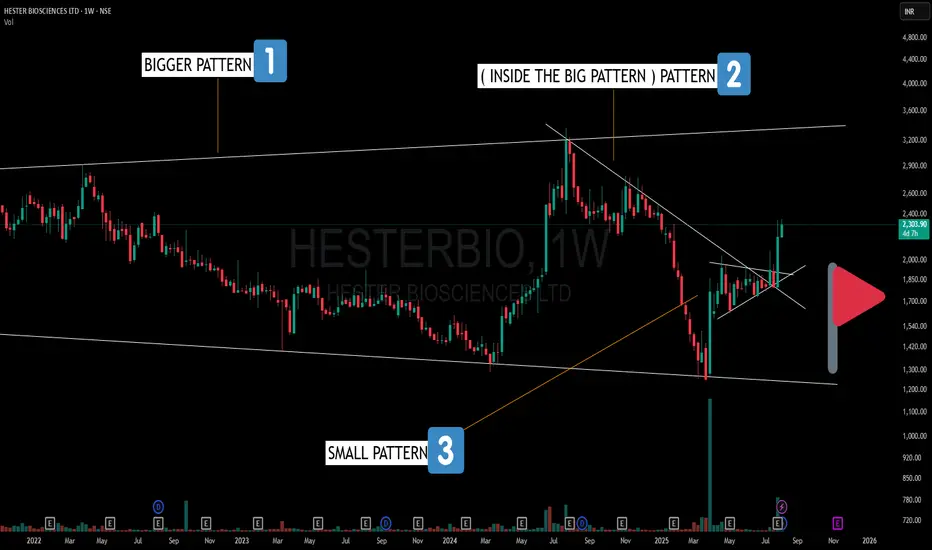
HESTERBIO – A Pattern Inside a Pattern Inside a Pattern!🔍 Here’s what stands out on the Weekly Chart:
1️⃣ Broadening Pattern – Larger structure with higher highs and lower lows, indicating expanding volatility.
2️⃣ Counter Trendline Break – A smaller, random pattern within the broadening formation showing V-shape recoveries and trend shifts.
3️⃣ Bullish Pennant – A compact consolidation pattern just before a strong breakout leg.
This is a great example of how multiple time-frame structures and nested patterns can co-exist—each adding another layer to market behavior.
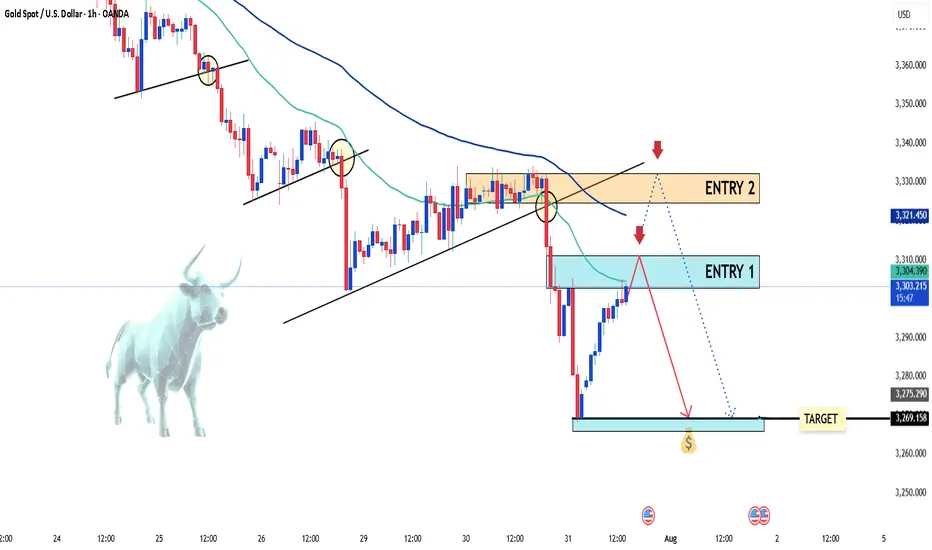
Gold dips again – is the bounce just a trap?Hello traders!
After a quiet start to the day, gold has turned lower and is now hovering around the $3,300 mark. The decline in OANDA:XAUUSD came as U.S. Treasury yields rose in response to strong U.S. economic data. The Fed is widely expected to maintain its current monetary policy stance during today’s session.
From a technical perspective, XAUUSD continues to form bearish structures and breakdowns. While a short-term bullish correction is currently underway, the bears still hold the upper hand — and selling opportunities remain the preferred strategy.
I’ll be focusing on two key entry zones marked on the chart, with a short-term bias favoring sell setups.
Do you agree with this approach?
⚠️ Please remember: This is just a trading idea — make sure to manage your risk properly with defined TP and SL levels.
Good luck and happy trading!
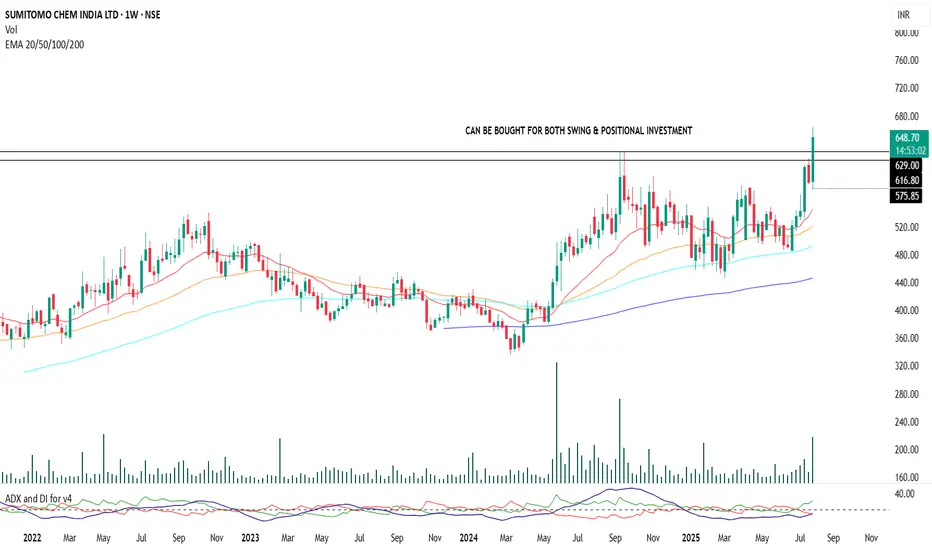
Sumitomo Chemical | Positional Swing Setup with Dynamic SLA strong setup is forming in Sumitomo Chemical with bullish c price action and trend indicators. Entry can be been initiated at current levels with small quantity with a stop-loss placed at ₹570 on a weekly closing basis.
No fixed targets. This is a trailing stop-loss-based position aimed at capturing a sustained trend move.
Add-on Zone: If the price retests the support near the ₹630 level (previous structure/support), more quantity will be added as part of a pyramiding strategy, provided broader market structure remains bullish.
Indicators Used for Trailing SL & Confirmation:
ADX & DI , RSI Levels
Exit Criteria:
Weekly close below ₹570 (hard stop)
Note: This is a disciplined, structure-based swing trade with optional pyramiding. Avoid impulsive exits; trail stop-losses logically based on trend indicators.
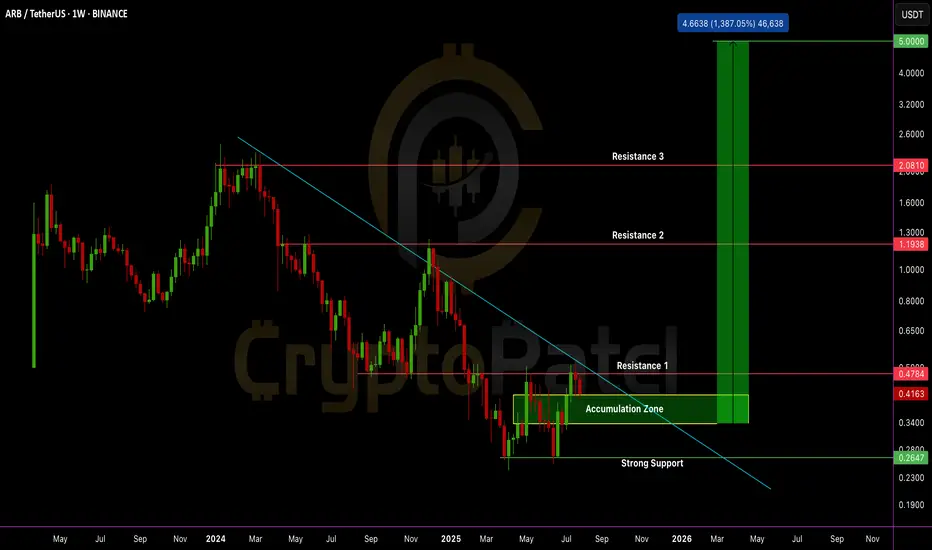
$ARB Ranging in High R:R Zone – Breakout Targets at $1/$2/$5AMEX:ARB Ranging in High R:R Zone – Breakout Targets at $1/$2/$5
🔹 Trend: Macro downtrend intact, price rejected from descending trendline multiple times.
🔹 Current Drawdown: ~84% from ATH – indicating deep retracement and potential reaccumulation phase.
🔹 Structure: Price consolidating within a defined accumulation range between $0.30–$0.40. Demand is stepping in near range lows with wicks indicating buyer absorption.
Breakout Condition:
→ HTF (weekly) close above $0.48 with strong volume = structural breakout
→ Confirmed breakout above range high + trendline = bullish market structure shift
Upside Targets: $1.00 → $2.00 → $5.00
Invalidation Zone:
→ Clean HTF close below $0.24 = invalidation of accumulation thesis
→ Until then, dips into demand remain buy zones; invalidation only triggered on structural breakdown
R/R Outlook:
→ Wide stop, but multi-x reward setup
→ Favorable for long-term positional entries with defined HTF structure
Accumulation evident in key weekly demand zone. Break above $0.48 = trigger for bullish continuation structure. Until then, watch for HTF sweep + reclaim setups and volume confirmation.
Note: NFA & DYOR
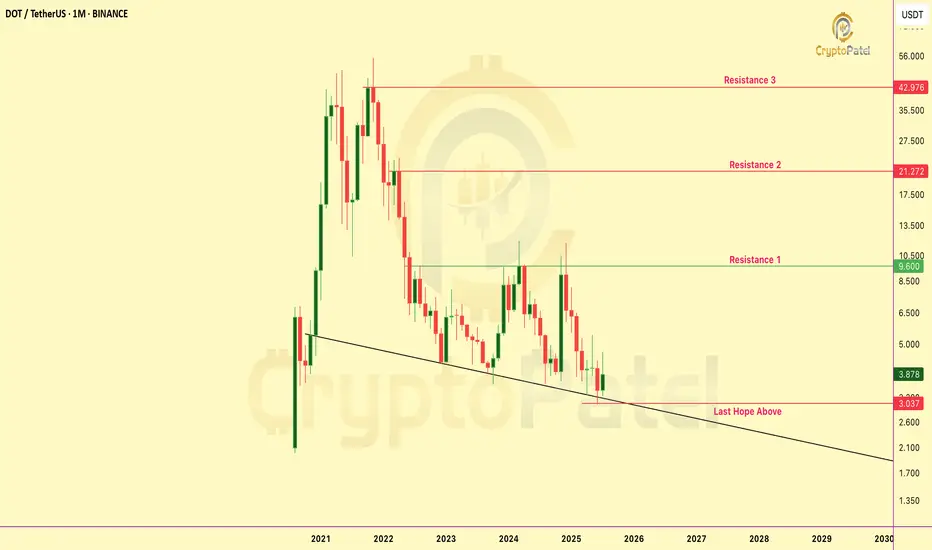
Is Polkadot (DOT) Dead or Ready for a Comeback? Full Update 2025Polkadot was one of the strongest performers of the last cycle. After launching near 2.70 dollars in August 2020, it rallied to an all-time high of $55 in November 2021. That marked a nearly 1,900% gain in just over a year.
However, fast forward to mid-2025, and CRYPTOCAP:DOT is now trading back around its launch price, down approximately 94% from its peak. This has raised a major question among long-term holders and new investors alike: is DOT finished, or is it setting up for a new cycle?
Technical Analysis: Price Structure and Key Levels
DOT’s current price action is best described as a full macro retracement.
Support zone: $2.50 to $3.00: A historically important area acting as both launch base and now long-term demand zone.
Resistance zone: $4.60 to $5.50: Former breakdown levels and local range tops.
Market structure: Still bearish on the macro timeframe, with lower highs and lower lows intact since the 2021 top.
From a risk-reward perspective, #DOT is trading at long-term support levels. If price holds this range, the setup offers asymmetric upside into the next bull phase.
However, a clean break below $2.50 would invalidate this zone and could lead to a deeper correction.
Fundamental Analysis: What Polkadot Is Building
Despite the heavy price drop, #Polkadot continues to execute on its long-term roadmap. Its core value lies in building a scalable, interoperable multichain network powered by parachains and the Substrate framework.
Key Developments in 2025:
Polkadot 2.0 and Elastic Scaling
A major upgrade that introduces Asynchronous Backing, Agile Coretime, and Elastic Scaling to drastically improve block production, scalability, and efficiency.
Polkadot Pay App
Launching in August 2025, this mobile application aims to make DOT more usable for real-world payments and onboarding new users.
DOT Tokenomics Overhaul and ETF Anticipation
A restructured economic model is expected in Q4 2025, potentially adjusting inflation, staking rewards, and circulation dynamics. An ETF approval is also being discussed, which could bring in new institutional liquidity.
Polkadot Hub and Developer Tooling
A unified portal for developer onboarding, launching in October 2025. Polkadot currently maintains over 2,400 monthly active developers and more than 285 parachains.
Asset Hub and Solidity Support
With PVM (Polkadot Virtual Machine), Polkadot now allows Solidity and Ethereum-native applications to deploy directly within its ecosystem- improving dApp compatibility and reducing migration friction.
Sentiment and Investor Psychology
Many retail investors are skeptical due to the prolonged drawdown and loss of momentum. In crypto, narrative plays a crucial role in price recovery. While Polkadot still has strong fundamentals, it currently lacks the hype and retail traction that drove its 2021 rally.
If DOT can regain attention through real-world utility, DeFi growth, or ecosystem traction, its market value could catch up with its underlying development.
Strategy Outlook
From a technical standpoint, this is a make-or-break level. Holding the $2.50 to $3.00 zone is essential for a bullish setup. Failure to defend this base could lead to prolonged accumulation or deeper downside.
From a fundamental view, Polkadot is still among the few L1s delivering real upgrades in 2025. The question is whether the market will reward it.
Conclusion
Polkadot is not dead. It is rebuilding and evolving. The upcoming launch of Polkadot 2.0, tokenomics improvements, developer ecosystem expansion, and cross-chain architecture all position DOT for a potential recovery, if market conditions align.
While the price action has been discouraging, strong fundamentals combined with strategic patience could present an opportunity for long-term holders.
Always manage risk, define your invalidation levels, and evaluate both narrative and execution before making investment decisions & NFA always DYOR.