BUY TODAY SELL TOMORROW for 5%ON’T HAVE TIME TO MANAGE YOUR TRADES?
- Take BTST trades at 3:25 pm every day
- Try to exit by taking 4-7% profit of each trade
- SL can also be maintained as closing below the low of the breakout candle
Now, why do I prefer BTST over swing trades? The primary reason is that I have observed that 90% of the stocks give most of the movement in just 1-2 days and the rest of the time they either consolidate or fall
Trendline Breakout in DYNAMATECH
BUY TODAY SELL TOMORROW for 5%
Breakout!

BUY TODAY SELL TOMORROW for 5%DON’T HAVE TIME TO MANAGE YOUR TRADES?
- Take BTST trades at 3:25 pm every day
- Try to exit by taking 4-7% profit of each trade
- SL can also be maintained as closing below the low of the breakout candle
Now, why do I prefer BTST over swing trades? The primary reason is that I have observed that 90% of the stocks give most of the movement in just 1-2 days and the rest of the time they either consolidate or fall
Resistance Breakout in BSE
BUY TODAY SELL TOMORROW for 5%

BUY TODAY SELL TOMORROW for 5%DON’T HAVE TIME TO MANAGE YOUR TRADES?
- Take BTST trades at 3:25 pm every day
- Try to exit by taking 4-7% profit of each trade
- SL can also be maintained as closing below the low of the breakout candle
Now, why do I prefer BTST over swing trades? The primary reason is that I have observed that 90% of the stocks give most of the movement in just 1-2 days and the rest of the time they either consolidate or fall
Round Bottom Breakout in NATIONALUM
BUY TODAY SELL TOMORROW for 5%

Yatra Online (D): Strongly Bullish, Fundamentally-Driven BOThis is a high-conviction breakout, driven by explosive quarterly earnings. The stock has successfully broken its short-term consolidation but was temporarily rejected at its multi-year high. The underlying momentum is exceptionally strong.
🚀 1. The Fundamental Catalyst (The "Why")
The technicals are being driven by fundamentals. Today's +11.88% surge on massive 35.31 Million volume is a direct response to Yatra's record-breaking Q2 2026 earnings , which featured:
- Net Profit up 96% year-over-year.
- Revenue up 48% year-over-year.
- A raised full-year EBITDA guidance from the company.
📈 2. The Long-Term Context (The Setup)
- The Bottom & Reversal: After making its all-time low in March 2025 , the stock has been in a strong, sustained uptrend.
- The Consolidation: From August 2025, the stock entered a sideways trend, building a base for its next move. Volume was declining during this period—a classic sign of accumulation.
🎯 3. Today's Action (The "Two-Resistance Battle")
Today's price action was a textbook example of a breakout hitting two resistance levels:
- Resistance 1 (CLEARED): The short-term horizontal resistance from September 2025 (at ~₹172 ). The stock decisively broke and closed above this level.
- Resistance 2 (REJECTED): The long-term horizontal resistance from January 2024 (the previous multi-year high). The stock breached this level intraday to make a new ATH, but failed to close above it . This is a key sign of selling pressure or profit-taking at the old high.
📊 4. Key Technical Indicators
Indicator analysis confirms the bullish power across all timeframes:
- RSI: The Relative Strength Index is rising on the Daily, Weekly, and Monthly charts .
- EMAs: The short-term Exponential Moving Averages are in a "PCO" (Price Crossover) state on all three timeframes .
🧠 5. Future Scenarios & Key Levels to Watch
The path forward is now clearly defined by the two resistance levels identified.
🐂 The Bullish Case (Confirmation)
- Trigger: The stock must now get a decisive daily close above the long-term resistance (the Jan 2024 high it was rejected from today).
- Target: Once it clears that final hurdle, the path is open to price target of ₹205 .
🐻 The Pullback Case (Healthy Re-test)
- Trigger: If the stock is unable to continue the immediate momentum (due to the rejection) and pulls back.
- Target: The price will likely fall to re-test the resistance-turned-support at ₹172 . A "bounce" off this level would be a textbook, healthy confirmation of the breakout and a new buying opportunity.

BUY TODAY SELL TOMORROW for 5%DON’T HAVE TIME TO MANAGE YOUR TRADES?
- Take BTST trades at 3:25 pm every day
- Try to exit by taking 4-7% profit of each trade
- SL can also be maintained as closing below the low of the breakout candle
Now, why do I prefer BTST over swing trades? The primary reason is that I have observed that 90% of the stocks give most of the movement in just 1-2 days and the rest of the time they either consolidate or fall
Trendline Breakout in POLYMED
BUY TODAY SELL TOMORROW for 5%

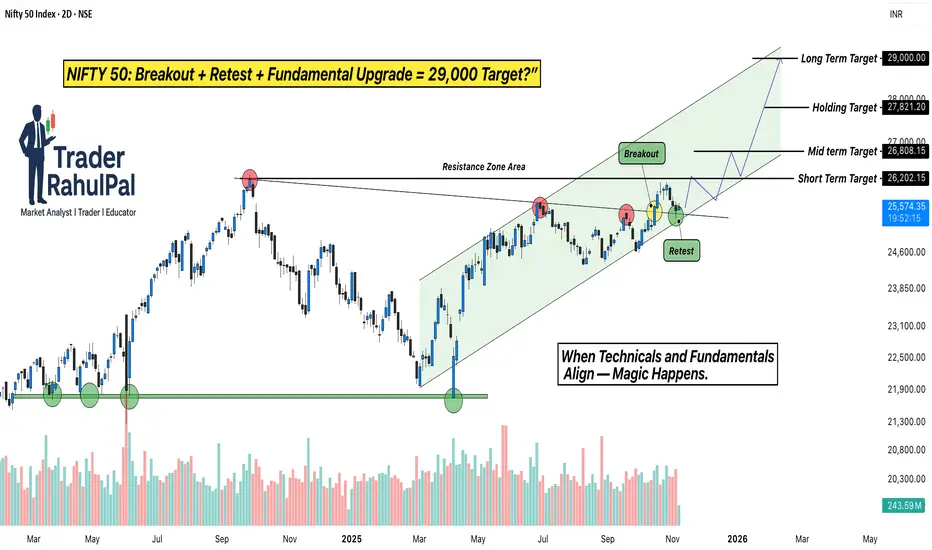
NIFTY Breakout + Goldman Sachs Upgrade = 29,000 Target?Hello Traders!
Today’s analysis is on NIFTY 50 Index, which has recently given a strong Breakout and Retest setup after months of consolidation. The index broke out from its Resistance Zone , retested the breakout area perfectly, and is now holding firmly inside a rising Trend Channel .
This move is not just technical, it’s being backed by major institutional optimism. According to a recent Goldman Sachs report , India’s stock market has been upgraded to “Overweight”, with NIFTY 50 projected to reach 29,000 by 2026 .
Why this setup is special?
Perfect breakout and retest structure with strong volume confirmation.
Channel trend remains intact, showing controlled accumulation at higher levels.
Institutional support from Goldman Sachs aligns with the technical breakout, adding conviction to the rally.
Levels to Track:
NIFTY is holding above the breakout zone near 25,000 , with immediate support seen at 24,600 . As long as the index sustains above this level, the short-term upside remains open toward 26,800 , followed by the next leg around 29,000 , matching Goldman Sachs’ longterm projection.
Rahul’s Tip:
When technicals and fundamentals align, the results are often explosive. A clean retest like this, supported by global institutional confidence, can lead to a powerful trend extension. Traders who position early usually ride the strongest part of the move.
(Analysis By @TraderRahulPal | More analysis & educational content on my profile. If this helped you, don’t forget to like and follow for regular updates.)
Disclaimer:
This analysis is for educational purposes only and should not be taken as financial advice. Please do your own research or consult your financial advisor before investing.
Silver Triangle BreakoutSilver is attempting breakout forming a ascending triangle pattern on 1h and 4h timeframe. It is also trading above 200ema.

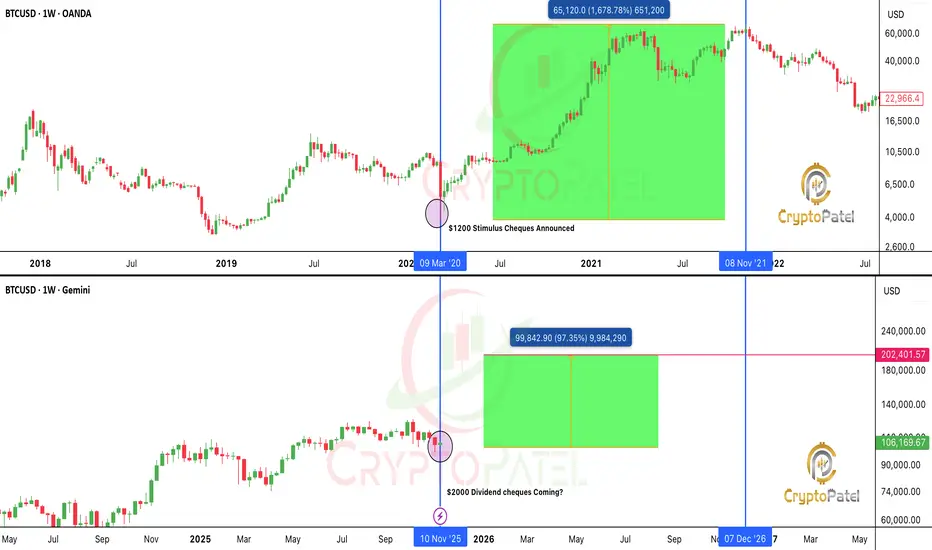
Trump’s $2,000 stimulus = $600B Liquidity: Bitcoin To the Moon?Trump’s $2,000 Stimulus Could Light the Fuse for the Biggest Crypto Rally Ever
This isn’t just another political headline.
If Trump’s plan to send $2,000 stimulus checks funded by tariff dividends actually happens, it could unleash a $600 billion liquidity wave into the economy.
That’s nearly the same scale as the 2020 stimulus, which kicked off one of the most legendary bull runs in history.
🔹 Bitcoin skyrocketed from $3,800 to $69,000
🔹 Ethereum exploded from $90 to $4,800
🔹 Altcoins went absolutely wild, 50x, 100x, even more
But here’s the twist...
This time, the setup is 10x stronger.
In 2020, those checks were about survival, paying rent, buying food, covering bills.
Crypto was new. ETFs didn’t exist. Institutions were on the sidelines.
Now? The game has completely changed.
✅ Crypto is mainstream
✅ Bitcoin ETFs are live
✅ Institutions are ready to buy
✅ Retail access is everywhere
✅ The U.S. economy is growing, not crashing
In 2020, people used stimulus to survive.
In 2025, they’ll use it to invest.
When money flows into a market that’s already primed for risk...
That’s not just bullish, that’s explosive.
The 2020 checks fueled a survival rally.
The 2025 checks could ignite a speculation supercycle.
Imagine $600 billion pouring into a global asset class that’s waiting for liquidity.
Bitcoin. Ethereum. Solana. AI coins. RWA tokens. Meme coins.
History doesn’t repeat but it sure does rhyme.
And this rhyme could make millionaires all over again.
NFA & DYOR
SAIL ( W ) CUP & HENDAL PATTERN BREAKOUT● Add Your Watchlist ●
📊 Chart to Study For Swing Trading
➡️ STOCK NAME : SAIL
▫️Date : 10.11.25
🔸️ Pattern : Cup & Hendal
🔸️Timeframe : Weekly
🔸️Near Brekout Price
🔴 Chart is Only For Education Purpose

Privi Speciality Chemicals Ltd - Breakout Setup, Move is ON...#PRIVISCL trading above Resistance of 3196
Next Resistance is at 4757
Support is at 2166
Here is previous chart:
Chart is self explanatory. Levels of breakout, possible up-moves (where stock may find resistances) and support (close below which, setup will be invalidated) are clearly defined.
Disclaimer: This is for demonstration and educational purpose only. This is not buying or selling recommendations. I am not SEBI registered. Please consult your financial advisor before taking any trade.

Lg Balakrishnan & Bros Limited - Breakout Setup, Move is ON...#LGBBROSLTD trading above Resistance of 1517
Next Resistance is at 2647
Support is at 1140
Here are previous charts:
Chart is self explanatory. Levels of breakout, possible up-moves (where stock may find resistances) and support (close below which, setup will be invalidated) are clearly defined.
Disclaimer: This is for demonstration and educational purpose only. This is not buying or selling recommendations. I am not SEBI registered. Please consult your financial advisor before taking any trade.

Sharing my Secret Trading Mindset with Price actionIn this 18 minute video I will try to change the way you trade by sharing my trading experience using charts older than 3 months .

$NEAR Ready for a Massive Breakout: Next Stop $20+ Incoming CRYPTOCAP:NEAR Ready for a Massive Breakout: Next Stop $20+ Incoming
The chart structure looks absolutely explosive right now! $NEAR/USDT has bounced hard from the triangle support, confirming strength and signaling that a massive rally is brewing.
I’ve been accumulating heavy in the $2.50 - $1.90 zone, expecting a big breakout rally ahead!
Targets: $7.70 / $16.70 / $30 / $50
If CRYPTOCAP:NEAR can smash through the $5 resistance, get ready for a vertical flight toward $20+, with long-term eyes on $50
Why I’m ultra-bullish:
✅ Strong recovery from key support zone
✅ Bullish triangle breakout structure
✅ Volume uptick showing accumulation
✅ Momentum shifting rapidly toward bulls
Chart invalidation below $1.50, but above that, it’s looking unstoppable. NFA & DYOR

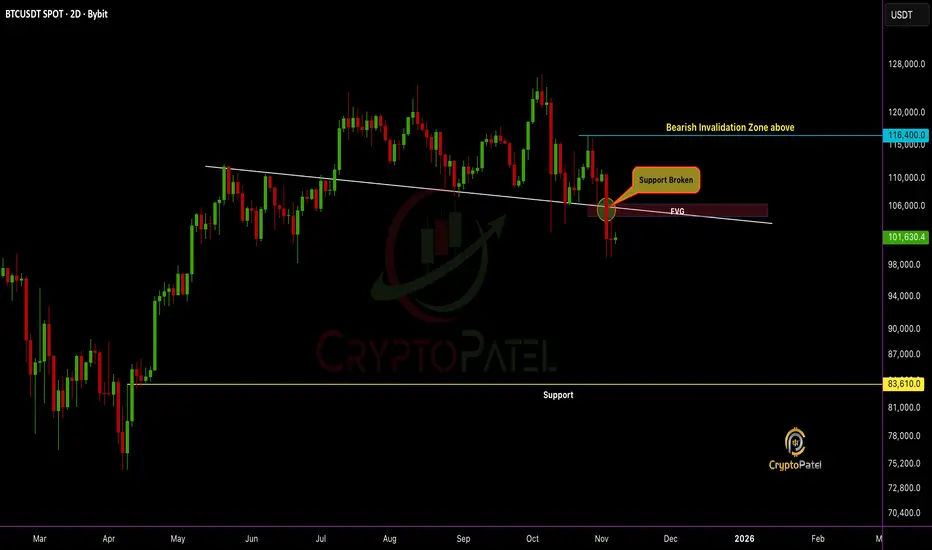
BTC Breakdown Confirmed, Structure Flipped Bearish: Next $88610?BTC Breakdown Confirmed, Structure Flipped Bearish: Next Stop $83,610?
Support is broken and the structure confirms a clear bearish shift.
#Bitcoin failed to reclaim the Fair Value Gap (FVG) zone, turning it into strong resistance.
High chances CRYPTOCAP:BTC could fill the FVG and continue the downside move toward $83,610.
Bulls remain trapped unless price reclaims $116,400, the bearish invalidation zone.
Trend bias remains bearish. Liquidity targets below are in play.
NFa & DYOR
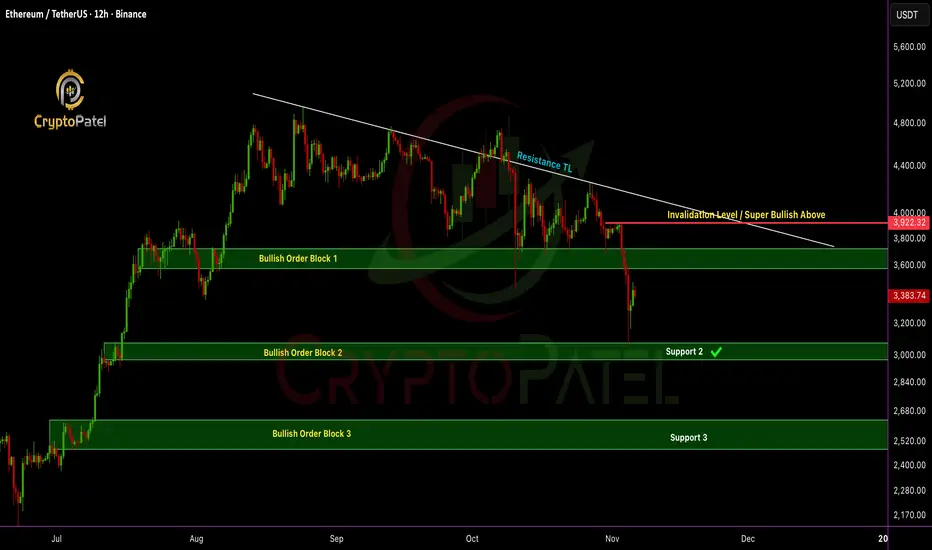
ETH/USDT dumped 20% after my analysisETHEREUM Update: Price just hit the bullish order block at $3,057 and bounced exactly as predicted ✅
Quick recap:
✅ Short-term: I’m bearish below $3,920, next potential leg down $2,500–$2,200 if $3,000 support breaks.
✅ Medium-term: Holding $3,000 support is key, could spark the next bullish wave.
✅ Long-term: Still super bullish & Target remains $10K–$15K ETH
Paper hands panic. Legends load the blood & hold.
Which one are you? 👇
NFA & DYOR
RBL Bank -Multi-Year #Breakout After 4 Years of ConsolidationRBLBANK has broken out of a multi-year resistance zone after a long accumulation phase since 2020.
This type of structure often leads to sustained upside momentum if the #breakout holds.
📌 Breakout Zone: ₹280 – ₹300
📌 Current Price: ~₹327
📌 Structure: Higher Highs & Higher Lows
📌 Volume: Strong accumulation visible
📌 Trend: Strong uptrend above long-term trendline & EMAs
Key Levels
Immediate Resistances ₹360
₹425 (Major long-term level)
Supports
₹300 – breakout retest zone
₹260 (major swing support)
As long as price stays above ₹300, bulls remain in control 🐂🔥
Technical Highlights
✅ 4-year consolidation breakout
✅ Major downtrend line broken
✅ Strong volume confirmation
✅ Clean price action + trend continuation
View
Bias remains bullish as long as price holds above the breakout zone.
Breakout + retest setups may offer opportunities in trending markets.
Not investment advice — for educational chart analysis only. Always do your own research.

Titan: Breakout Awaited ?Titan is up by almost 4% right now, and a flag pattern is quite visible. Probability of a breakout might be there provided it breaches the hurdle successfully with volume.
7% upside could be seen after the breach.
Note: Just an observation

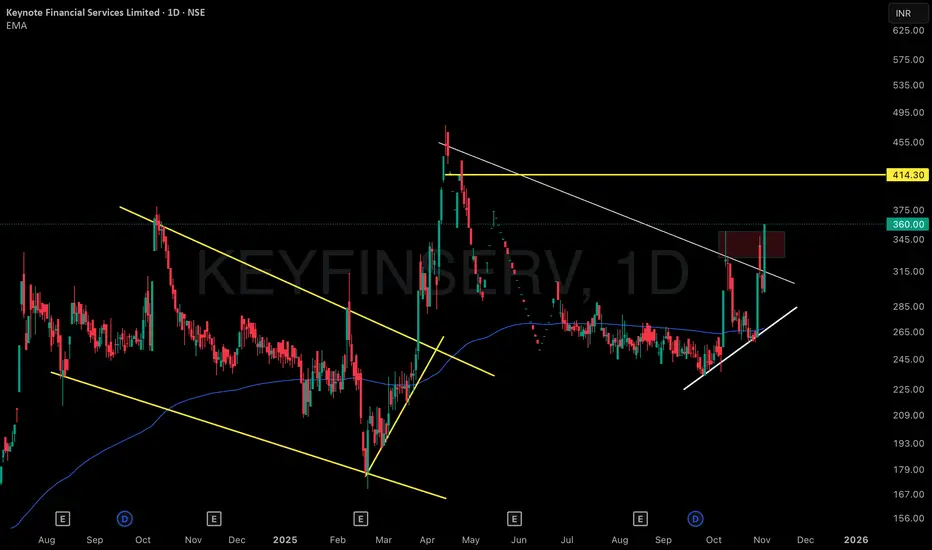
Recurring VCP Structures: Multi-Phase Consolidation & Expansion1 . This chart distinctly showcases a series of visually captivating Volatility Contraction Patterns (VCPs) across multiple phases, elegantly demarcated by yellow trendlines that map out both historical and present consolidation zones. Each contraction zone is marked by repeated, precise touches on trend boundaries, reflecting steady accumulation followed by eruptive volatility and sharp price expansions—almost like a pattern “echo” cycling through the chart.
2 . The highlighted VCP structures reveal not just one, but several contraction-and-expansion cycles, creating an intricate tapestry of market behaviour. Note how each phase includes a concentrated period of sideways price movement, where activity compresses before unleashing swift, directional breakouts. The interplay of these phases turns the chart into a textbook reference for sequential VCP observation, with periods of quiet consolidation—almost like calm before a storm—setting the stage for pronounced volatility bursts.
3 . Recent activity amplifies this effect: vivid volatility swings transition rapidly into tight consolidation, echoing earlier pattern cycles and further emphasizing the recurring structural nature. These technical formations, combined with strong boundary touches and clear momentum surges, make the chart an excellent study in pattern recognition, volatility monitoring, and visual market structure analysis—all shared purely for observational insight, with no predictions or directional bias.
BUY TODAY SELL TOMORROW for 5%DON’T HAVE TIME TO MANAGE YOUR TRADES?
- Take BTST trades at 3:25 pm every day
- Try to exit by taking 4-7% profit of each trade
- SL can also be maintained as closing below the low of the breakout candle
Now, why do I prefer BTST over swing trades? The primary reason is that I have observed that 90% of the stocks give most of the movement in just 1-2 days and the rest of the time they either consolidate or fall
Resistance Breakout in SIYSIL
BUY TODAY SELL TOMORROW for 5%

BITCOIN TECH UPDATE: BEARISH DOMINATES MUST READ🚨 BTC TECH UPDATE: BEARISH DOMINATES MUST READ 🚨
CRYPTOCAP:BTC is down 14% from my bearish short at $115,000 retest.
✅ Those who shorted, well played.
✅ Those who avoided longing at the top, capital saved.
Price Action:
#BITCOIN hit 1st support and broke below, trend remains bearish.
Next target: $94,000.
Short-Term Relief:
Expect a bounce toward $105,000–$108,000 (retest + FVG zone) before the next leg down.
Longer-Term:
$94,000 key decision zone → potential drop to $76,000 if bearish momentum continues.
Will update with precision once $94k is reached.
Sentiment: Bearish as forecasted from $115k.
Bullish Trigger:
If BTC breaks $111,500 with HTF candle close, bullish scenario activates → potential ATH toward $150,000.
Trade smart. Watch levels. Manage risk.
Your move: Ride the bearish wave or wait for the relief rally?
NFA & DYOR

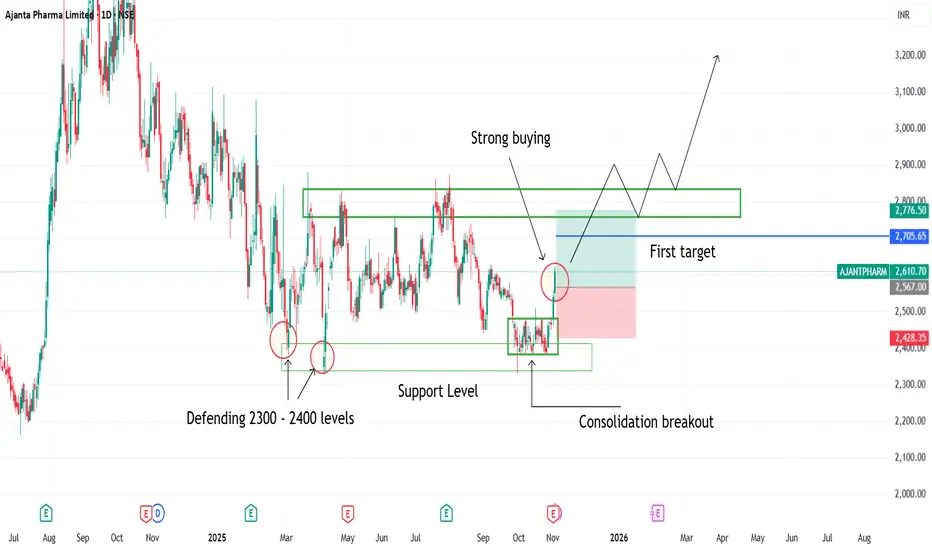
Consolidation breakout seen in ajanta pharma1. Consolidation breakout seen in ajanta pharma
2. Buyers defending 2300 2400 levels
3. Strong Bullish candles indicating strong buyers strength
4. Consolidation breakout has been happened on support levels
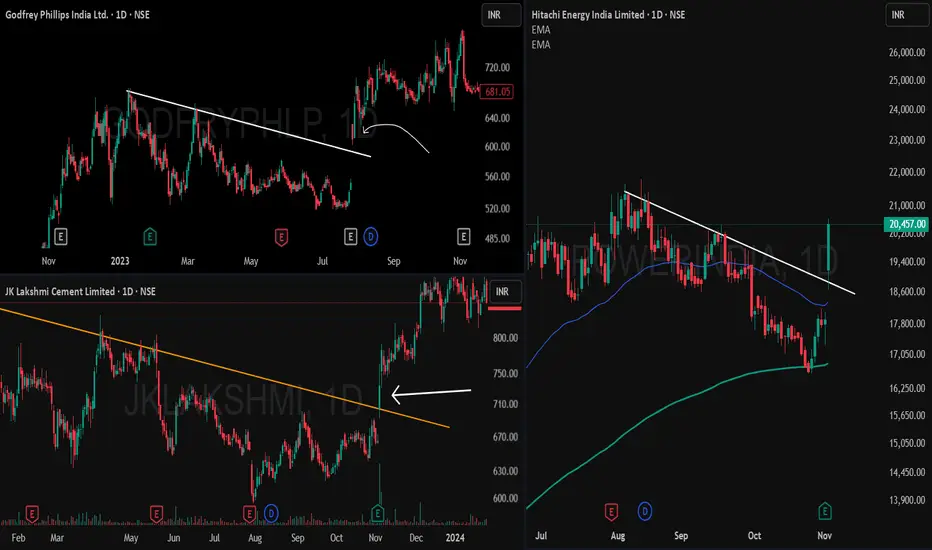
Breakaway Gap Up Breakout — A Powerful StudyThis post analyzes breakaway gap up breakouts with multiple chart examples, illustrating how price leaps above well-tested trendline resistance without a retest, triggering strong upward momentum.
Main Report
What is a Breakaway Gap Up Breakout?
A breakaway gap up breakout occurs when the price gaps above a resistance trendline that has been tested multiple times, but instead of interacting with the resistance, the price opens substantially higher, leaving a noticeable gap. This phenomenon signals strong demand and often marks the beginning of a sustained price rally
Chart Observations
- Left-side examples (Godfrey Phillips & JK Lakshmi Cement):
Both charts show prices repeatedly hitting a descending trendline resistance. Unlike typical breakouts, the price did not touch or retest the resistance before breaking out; instead, it jumped above with a clear gap up. This is the classic signature of a breakaway gap. Following the breakout, continuation moves are observed, confirming the bullish momentum.
- Right-side example (Power Grid Corp):
Here, the price similarly clears a major resistance following several rejection points. The breakout is accompanied by a gap and swift follow-up buying, exemplifying the reliability of the breakaway gap pattern
Key Traits of Breakaway Gap Ups
-Occur after prolonged resistance tests.
-Price gaps above resistance without retesting or shadowing.
-Often lead to strong follow-through and trend continuation.
-Frequently signal institutional participation or a major sentiment shift.
Raghav Productivity Enhancers Ltd | Weekly VCP Breakout | Moment🏭 Company Overview
Raghav Productivity Enhancers Ltd (NSE: RPEL) is India’s leading producer of silica ramming mass, a key refractory material used in steel manufacturing furnaces. The company operates modern facilities with global quality standards, catering to both domestic and international steel producers.
Fundamental Keys
Company's market cap ₹35,887 Cr
PE Ratio : High Valuation (78.90)
Price to sales: >15.75
ROE: >30% Excellent
ROA: >26% Good
Net Profit Margin: >19% Good
Operating Margin: >45% Good
EBITDA Margin: >28% Good
Debt-to-Equity: 0.0279 (debt-free profile)
Quick Ratio: 3.67
Cash Ratio: 0 (working capital tightness)
Debt to EBITDA: 0.098 Good
Annual sales have increased for 3 consecutive years.
Quarterly revenue trending upward for 5 years.
Strong balance sheet with growing total assets and minimal debt.
Financially robust with excellent profitability and asset efficiency.
Valuations are stretched, but strong earnings momentum supports short- to medium-term bullish sentiment.
Technical Analysis (Weekly + Daily)
Stock formed a perfect VCP (Volatility Contraction Pattern). A series of tightening swings leading to a breakout with a massive green candle.
Breakout candle closed near high - shows conviction buying.
Volume expansion on breakout confirms institutional participation.
Price now comfortably trades above key resistance zone (~₹740) flipping previous resistance into new support. All moving averages aligned bullishly with expanding volume signaling a high-probability breakout continuation.
Price trades above 9, 20, and 50 EMA - bullish alignment. ADX is showing healthy trend strength. RSI mildly overbought, typical for breakout continuation. MACD confirmed strong bullish crossover. Weekly volume surged to ~995K, 3× above average clear sign of institutional activity. Daily volume >615K confirms multi-timeframe buying interest.
Swing Trade Plan : For 1-3 weeks
Breakout Aggressive Entry: ₹795–805 On (close above breakout high)
Retest Entry: ₹740–760 (On low-volume retest of breakout zone)
Stop-Loss ₹650 Below 50 EMA / prior base
Target 1: ₹850–880 (First resistance zone)
Target 2: ₹950–1,000 )Measured flag projection)
Trailing Strategy:
Move SL to ₹740 after T1 achieved.
Trail below 9 EMA (daily) as price trends higher.
Exit if weekly candle closes below 20 EMA with volume expansion.
⚠️ Disclaimer
This analysis is for educational and research purposes only. It is not financial advice. Always conduct your own due diligence and use proper risk management.
