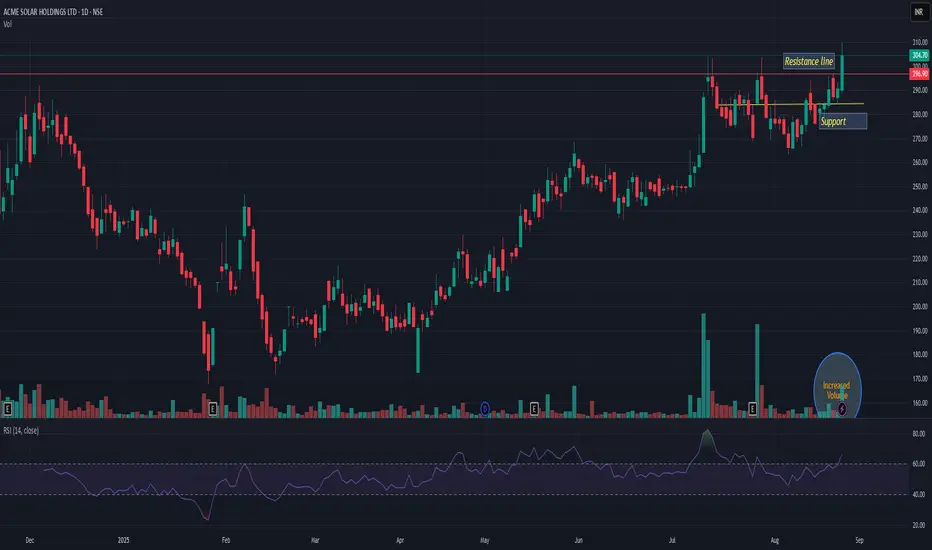
ACMESOLARACMESOLAR giving resistance breakout with decent volume. Support is near 280. Seems like this may take a new ride; trading at ATH. Very high probability that it can add up 12-15% from current level. Its very good risk-reward trade. Keep in yr watchlist
Breakout
Breakout from cup-and-handle pattern
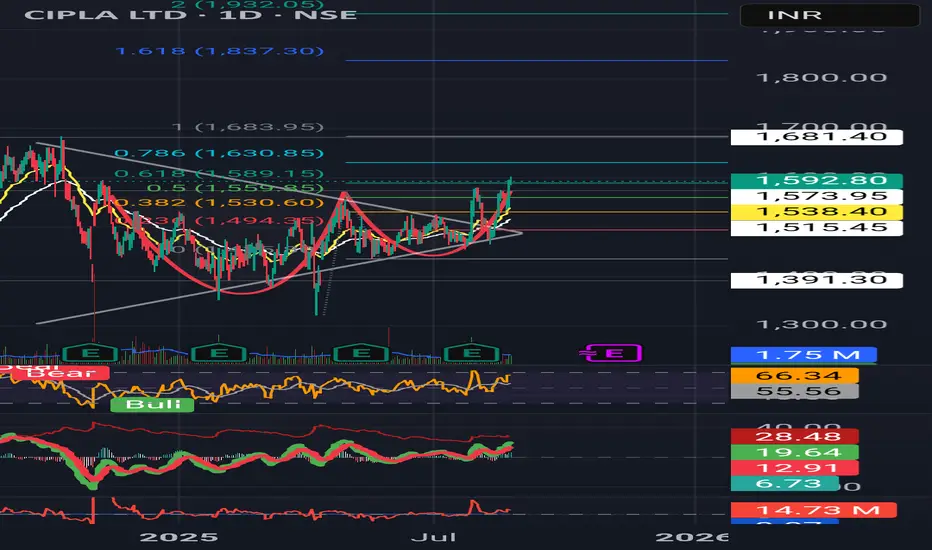
✅ Strong EMA alignment (20 > 50).
✅ RSI > 60 with bullish slope.
🚩 Needs follow-through above ₹1600 for sustained rally.
🎯 Target zones: ~₹1630, ₹1683, ₹1837 (Fib extensions).
🛑 Stop-loss: ₹1571 (tight ATR-based).
Observing Charts Smarter: Learning Price Action Made EasyIn this video, I share how simple trading observations and “talking to the charts” can improve your understanding of price action and trade movements. By reviewing Apollo’s chart, we explore how breakout patterns, retracements, and higher highs unfold in real time. The goal is not prediction, but sharpening your ability to read market structure, avoid wrong entries, and reduce big drawdowns—ultimately helping you become a more disciplined trader.

Pennar Industries Limited - Breakout Setup, Move is ON...#PENIND trading above Resistance of 189
Next Resistance is at 257
Support is at 121
Here are previous charts:
Chart is self explanatory. Levels of breakout, possible up-moves (where stock may find resistances) and support (close below which, setup will be invalidated) are clearly defined.
Disclaimer: This is for demonstration and educational purpose only. This is not buying or selling recommendations. I am not SEBI registered. Please consult your financial advisor before taking any trade.

Foseco India - Breakout Setup, Move is ON...#FOSECOIND trading above Resistance of 4799
Next Resistance is at 6319
Support is at 3279
Here are previous charts:
Chart is self explanatory. Levels of breakout, possible up-moves (where stock may find resistances) and support (close below which, setup will be invalidated) are clearly defined.
Disclaimer: This is for demonstration and educational purpose only. This is not buying or selling recommendations. I am not SEBI registered. Please consult your financial advisor before taking any trade.

BUY TODAY SELL TOMORROW for 5%DON’T HAVE TIME TO MANAGE YOUR TRADES?
- Take BTST trades at 3:25 pm every day
- Try to exit by taking 4-7% profit of each trade
- SL can also be maintained as closing below the low of the breakout candle
Now, why do I prefer BTST over swing trades? The primary reason is that I have observed that 90% of the stocks give most of the movement in just 1-2 days and the rest of the time they either consolidate or fall
Trendline Breakout in FOSECOIND
BUY TODAY SELL TOMORROW for 5%

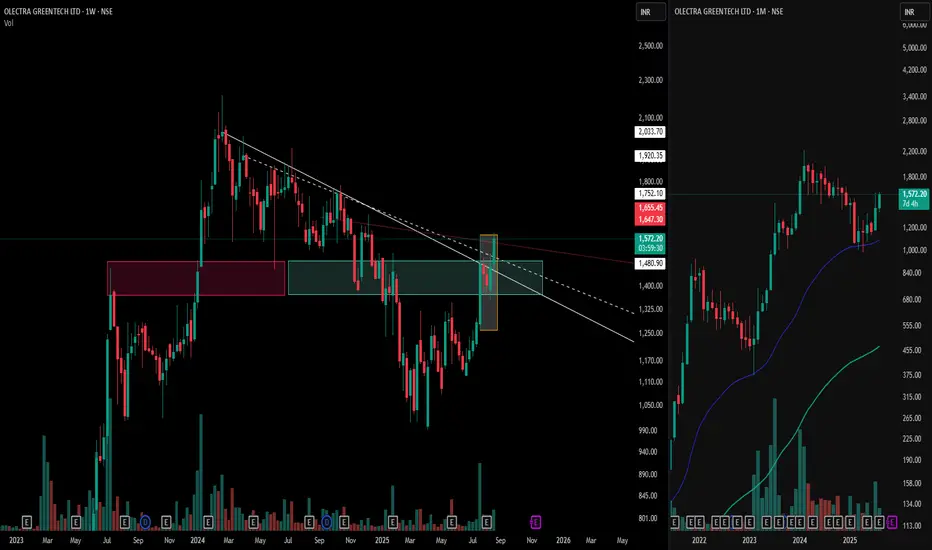
Olectra Greentech: Power of the Mother Candle & Zone Flip📊 White trendlines mark the crucial control trend and resistance levels.
🕯️ The bold Mother Candle (highlighted in the orange box) is marked .
💗 Notice the Pink Zone — formerly a tough resistance area — now flipped into strong support after the breakout, a classic supply-to-demand flip!
💎 The Cyan Box highlights an emerging demand zone, where buying interest gathers
⚡ Right side is a Representation of Market structure on the Biggest Time frame ( Monthly time frame ) showcasing a Higher high and Higher low formation and respecting the EMA plotted .
This is a stellar example of price structure and supply-demand dynamics in action—perfect study material for keen market observers.
⚠️ Disclaimer: This post is for educational and research purposes only. It does not constitute financial advice or a forecast. Always do your own analysis before making trading decisions.
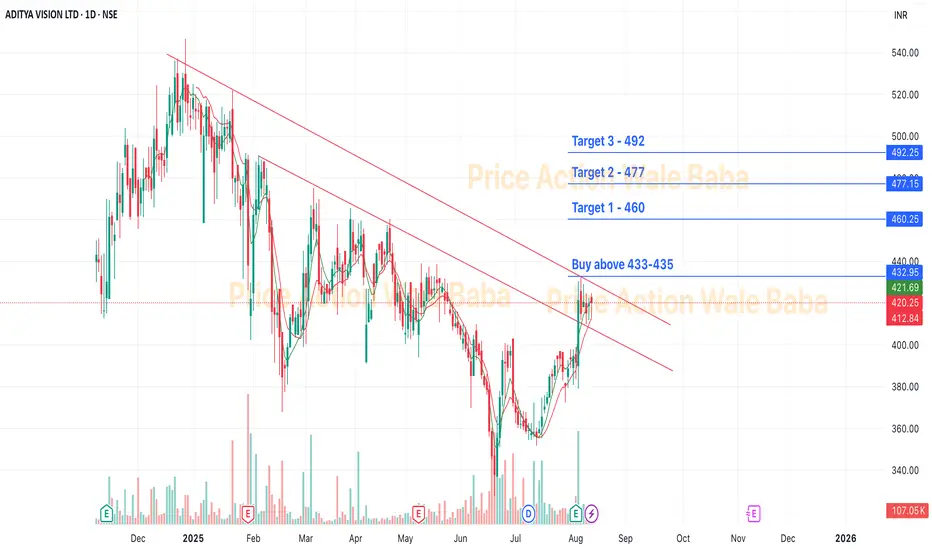
AVL - Near BreakoutAditya Vision Ltd. looks good on the chart.
After long consolidation, ready for the breakout and you can buy on every bottom.
Movement will be very sharp on upside once breakout come. So add on every dip and hold for next 4-8 months for the good returns.
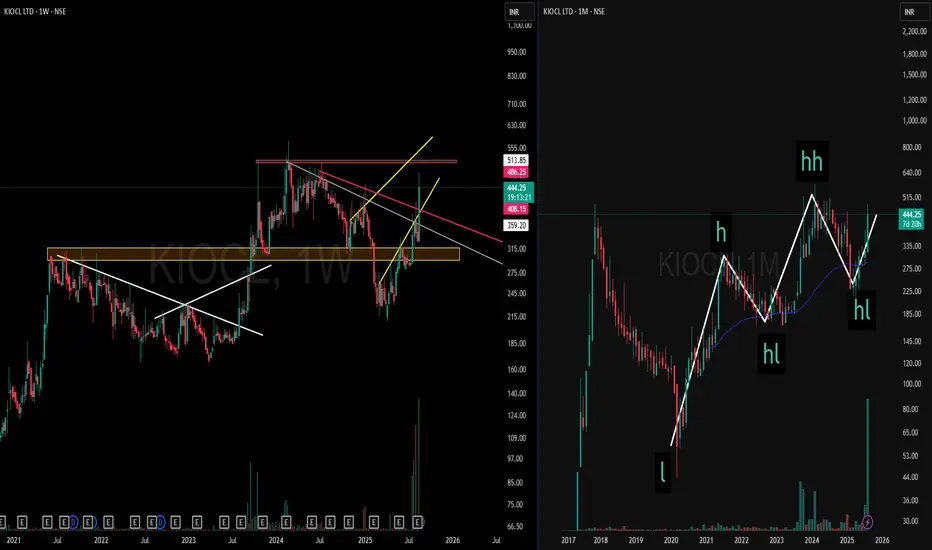
Multi-Timeframe Strength | KIOCL> On the Weekly Timeframe (left), price has gone through extended consolidation phases with counter-trendline breaks and zones of supply transitioning into demand.
> On the Monthly Timeframe (right), the broader structure highlights Higher Highs and Higher Lows, providing a clear larger-picture context.
> Key Takeaway:
Multi-timeframe alignment showcases structural clarity — from consolidation and shifts on the weekly to trend progression on the monthly.
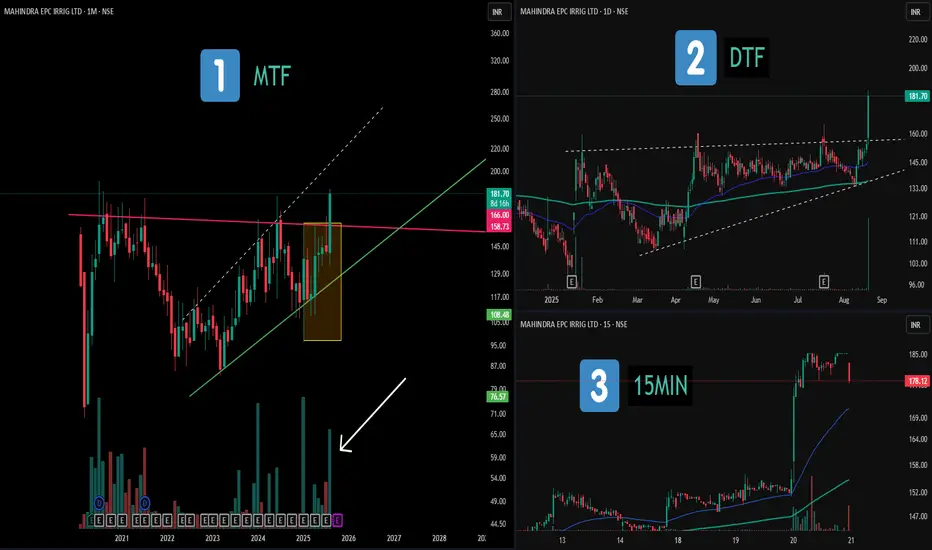
Multi-Timeframe Study: Consolidations and Patterns📝 Description:
1️⃣ MTF (Monthly) – Displays a broad consolidation structure with a hidden broadening formation and notable volume clusters marked in recent candles.
2️⃣ DTF (Daily) – Highlights an ascending triangle structure, with clear range boundaries and price compression before expansion.
3️⃣ 15MIN (Intraday) – Shows that the maximum price movement and volume activity occurred on a single candle, illustrating how momentum often concentrates in short bursts.
This chart setup serves as an educational view across multiple timeframes, showing how higher- and lower-TF structures can align.
⚠️ Disclaimer:
This post is purely for educational and structural analysis purposes. Not financial advice.
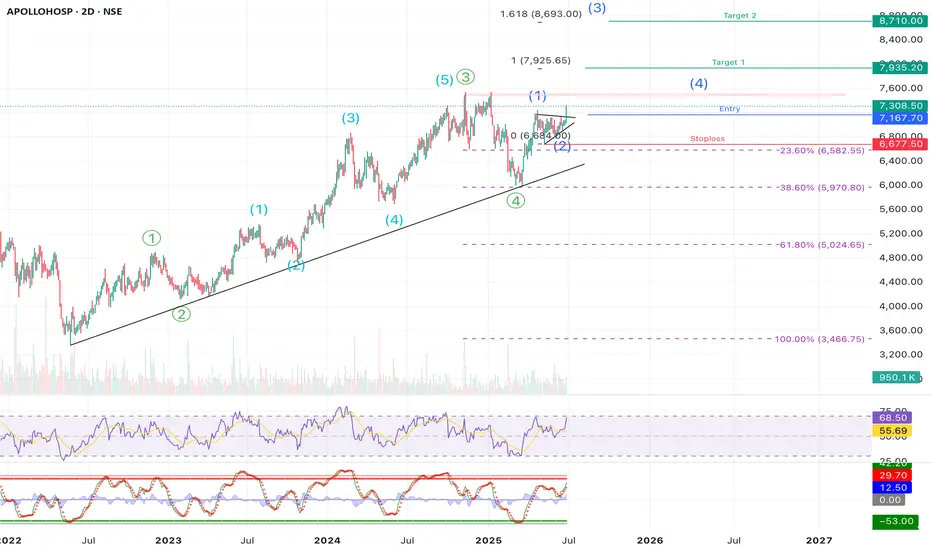
APOLLOHOSP | Swing | Breakout APOLLO HOSPITAL – Elliott Wave Structure + Breakout Opportunity Ahead
Apollo Hospitals is showing a textbook Elliott Wave formation, and we might just be at the beginning of a fresh impulsive rally. If you’re a swing trader or positional investor, this setup is worth keeping a close eye on.
⸻
🧩 Elliott Wave Count Analysis
• The stock is in a larger degree 5-wave move (marked in green). Within that 1-4 completed and wave 5 in progress.
• Within that, we can also see a new 5-wave impulsive structure developing (in blue), and it seems like we just completed Wave (2) of this new leg.
• This means — Wave (3) could be starting now, which is usually the strongest and fastest wave.
⸻
📈 Trade Setup
• Entry Zone: Around ₹7,165–₹7,215
• Stoploss: ₹6,677 (just below recent swing low and invalidation of the current wave count, Around 7-8% )
• Target 1: ₹7,925 (around 10%+ )
• Target 2: ₹8,710 (around 25%)
• Extended Target (Wave 3 Fibonacci Extension): ₹9,167
The targets are based on Fibonacci extension levels from Wave (1) to Wave (2), which typically project the length of Wave (3).
⸻
🔍 Supporting Technicals
✅ Trendline Support
• Price has been respecting a long-term rising trendline since early 2022 — a strong sign of continued bullish momentum.
✅ RSI & Stochastics Turning Up
• RSI is rising but not overbought — suggesting more room for upside.
• Stochastic oscillator is also showing a bullish crossover, confirming early momentum for the next wave up.
⸻
⚠️ Risk Management Note
If price drops below ₹6,677 and breaks the trendline, that would invalidate this Elliott wave count. It’s wise to exit or reduce exposure in that case. This is key to avoid being caught in a deeper corrective phase.
⸻
📝 Summary:
Apollo Hospitals appears to be starting a fresh Wave (3) after completing a healthy correction. With a clean Elliott Wave structure, trendline support, and supportive indicators, the setup looks strong. Risk is clearly defined and the reward potential is high — a good case for a swing position.
⸻
💬 Are you tracking this Wave 3 setup too? Let’s hear your thoughts in the comments below!
Disclaimer:
This analysis is shared for educational and informational purposes only. It is not investment advice or a recommendation. Please consult a SEBI-registered financial advisor before making any investment decisions. The author is not responsible for any losses arising from trading or investing based on this analysis.
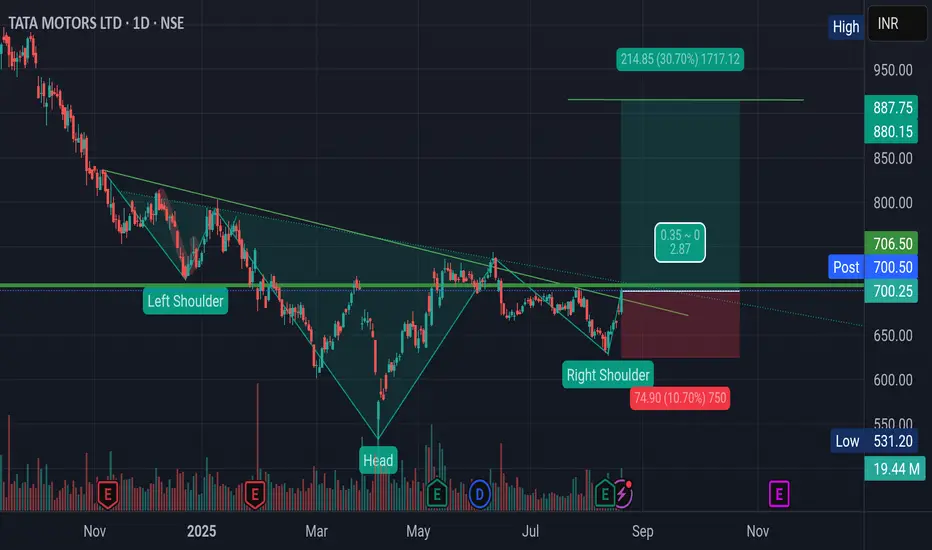
Inverted H&S Breakout in Tata MotorsMotor and electric Vehicle giant Tata Motors has given Breakout from Inverted Head and Shoulder pattern with good volume.
Once the price sustains and closes above Rs. 707. The stock should rally to its target of Rs. 880
One Should remain positive till price breaches and sustains below right Shoulder of the pattern.
The possibility of positive movement is fueled by the recent GST rate Cut possibility announced by PM modi. 👌
Also, there is positive news about fulfillment of Rare Earth Metals (very essential in EV vehicles) from China.😱
Note: This analysis is for Educational Purpose Only. Please invest after consulting a professional financial advisor.
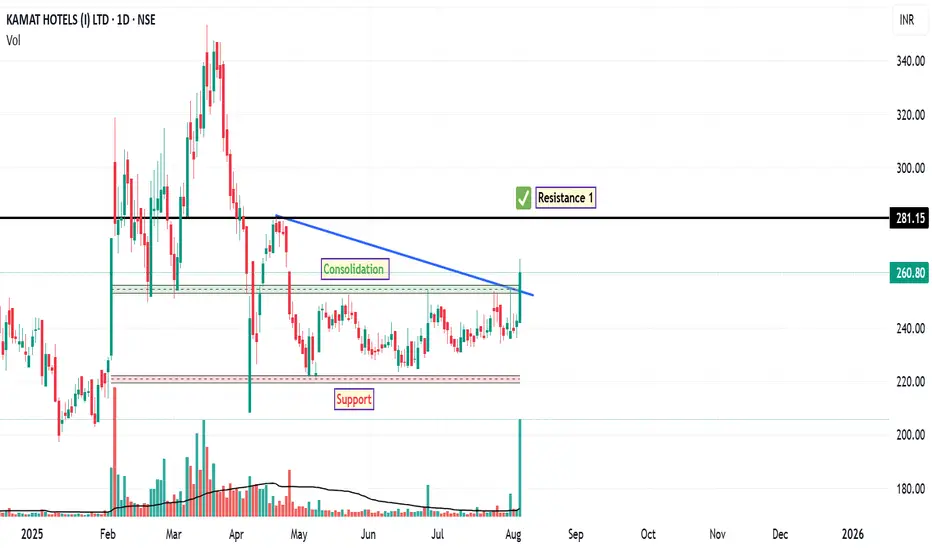
Kamat Hotels: Bullish Breakout from Consolidation RangeThe chart of KAMAT HOTELS has shown breakout from critical consolidation zone, marked on the chart. These levels are essential for assessing the current balance between supply and demand.
1. The Support Level (Marked on Chart)
This level 221 represents a zone of historical demand where buying interest has previously emerged to halt price declines. It acts as a structural floor for the recent price action.
2. The Resistance Level (Marked on Chart)
This level of 281 represents a more formidable area of overhead supply, likely corresponding to a previous significant peak or a major distribution zone. It is the first major target and potential obstacle following a successful breakout.
Disclaimer:
The information provided in this technical analysis is for informational and educational purposes only and should not be construed as financial or investment advice. It is an interpretation of historical price data. Market dynamics can change, and past performance is not indicative of future results. All trading and investment activities involve risk. Always conduct your own thorough due diligence and consult with a qualified financial advisor before making any investment decisions.
Breakout or Support? How to Decode a Stock’s True BehaviorIn this video I will show a Smarter Way to Read Charts, Breakout vs Support — The Fine Line Every Trader Must Know .
Disclaimer: This video is for educational purposes only and is based on historical charts. It is not financial advice. Please consult a registered advisor before making any trading decisions.

ETH on the road to $10,000? Let’s break it down🔥 ETH on the road to $10,000? Let’s break it down 👇
Here’s why ETH looks stronger than ever:
1️⃣ Big Money Flowing In
🔹 ETFs & public companies bought 4.4M ETH ($20B) this quarter.
🔹 Whales & Web3 firms added another 2M ETH.
🔹 That’s more than 5% of total supply absorbed in just months.
2️⃣ Record Network Growth
🔹 DEX trading volume at new highs.
🔹 Daily transactions & active wallets breaking records.
🔹 Stablecoin supply at ATH.
👉 Demand for Ethereum’s network is exploding.
3️⃣ Massive Supply Crunch
🔹 30% staked, 8% with institutions, 25% with long-term holders.
🔹 5% permanently lost.
🔹 Only 12% left on exchanges, shrinking fast.
🔹 Inflation rate just 0.5%, even lower than Bitcoin.
With retirement funds opening ETH access, rate cuts coming, and pro-crypto regulations, the demand will only increase while supply dries up.
Short-term dips may shake out weak hands… but the bigger picture is clear: ETH is heading above $10K this cycle.
Note: NFA & DYOR

A Classic Inverted Head & Shoulders What we’re looking at here is a textbook inverted head & shoulders formation unfolding on the chart.
🔴 & ⚪ – show the prior lower high, lower low continuation of the downtrend.
⚪ – represents the head, formed with a solid consolidation base.
🟢 – marks the structure shift, where the market starts printing higher lows.
🟡 – the counter trendline / neckline of this pattern, which price has now tested.
This structural shift is Highlight of this Post
Disclaimer: This post is purely for chart structuring and educational discussion. It is not a buy/sell recommendation or investment tip. Always do your own research before making trading decisions.

Indian Bank - Long Setup, Move is ON...#INDIANB trading above Resistance of 427
Next Resistance is at 665
Support is at 299
Here are previous charts:
Chart is self explanatory. Entry, Resistances and Support are mentioned on the chart.
Disclaimer: This is for demonstration and educational purpose only. This is not buying or selling recommendations. I am not SEBI registered. Please consult your financial advisor before taking any trade.

Stock Showdown Saturday: Can You Spot the Trade?Disclaimer:
The chart used in this video is from May 2023 (over 3 months old). It is shown only for educational purposes, to demonstrate strategy-building ideas and share trading experience. This is not financial advice and should not be considered as a recommendation to buy, sell, or skip any stock. Always do your own research before making trading decisions.

Buy, Sell, Retest or Sit Out? | Ep. 1 – Trade Decision SeriesCharts in this video are over 3 months old. This is for educational purposes only, using TradingView’s replay feature to demonstrate strategy thinking and decision-making. Not financial advice.

XAUUSD – Short-Term Bearish Momentum Strengthens After US DataOANDA:XAUUSD is under clear short-term selling pressure after yesterday’s stronger-than-expected US data. Both PPI and Core PPI for July rose by 0.9% month-on-month, far above the 0.2% forecast, signaling higher producer inflation. At the same time, Initial Jobless Claims fell to 224K, better than the 225K estimate, showing a resilient labor market.
This combination has strengthened expectations that the Fed will stay cautious on rate cuts, boosting the USD and weighing on gold.
Technical picture:
Price has broken out of its previous uptrend and is now moving entirely inside a descending price channel.
The 3,358 USD zone is acting as dynamic resistance, aligned with the upper boundary of the channel and EMA 34/89.
Current structure favors selling on rallies towards resistance, with a target at 3,320 USD – near the recent swing low and lower channel boundary.
If bearish momentum holds, a further drop towards 3,300 USD remains possible in the short term.
Short-term idea: Sell zone 3,355–3,358 USD, stop above 3,365 USD, take profit around 3,320 USD.

RALLIS - Ready for Momentum BurstNSE:RALLIS
Technical Analysis
⦿ Its moving in a good uptrend with stair pattern in a Wide channel.
⦿ On 15th of July company posted good results but since than - the stock is just consolidating now its been 1 month, Now it will be time to capitalize on that good earning.
⦿ The current base is clean and a static resistance is formed @386
⦿ Price is Approaching for 3rd time and from last 3 days upmove volume has surged.
⦿ Planning a trade above resistance and keeping a simple 2% stoploss to capture 10% Move.
🟢Entry - 386
♦️Stop - 375
🎯Tgt - 400,425+
The above information is for educational purposes only.
Before acting on any investment idea please do your own analysis and follow proper risk-to-reward, position sizing rules
⦿ If you found this idea Useful, please like and comment 👍💬
Keep Learning,
Happy Trading 🤞**

STAR CEMENT LTD | Strong Breakout After Long-Term Consolidation 📝 Description:
📌 Stock: STAR CEMENT LTD (NSE)
📅 Timeframe: 1D (Daily)
📈 Breakout Date: 04-Aug-2025
💼 Sector: Cement / Infrastructure
⚡️ Technical Setup:
Breakout Above Long-Term Resistance:
Price has finally broken through the ₹240–₹256 resistance zone, which had capped upside for nearly a year.
Strong Volume Confirmation:
The breakout is accompanied by a significant rise in volume, adding credibility to the move and indicating strong buyer interest.
Bullish Market Structure:
Price has shifted into a higher high–higher low structure over the last few weeks, confirming momentum build-up.
Range Built-Up Base:
Price consolidated within ₹190–₹240 for over 10 months, creating a solid foundation for the breakout.
🔍 Key Observations:
📊 Chart Pattern:
The chart shows a horizontal breakout from a long-term consolidation zone between ₹240–₹256. This breakout signals a bullish continuation, as the stock pushes above a multi-month supply zone with strong momentum.
📈 Recent Price Action:
• The stock gave a clean breakout on 04-Aug-2025, closing above the resistance zone required with strong follow-through.
• The rally was supported by 2.5× surge in volume, indicating institutional interest.
• Price structure shows confirming trend reversal from range-bound to bullish.
• This breakout comes after 10+ months of consolidation, adding more weight to the move.
Add-ons:-
✅ Clean breakout with follow-through above ₹256.
🔼 No immediate supply zone until ₹280–₹290 range.
🔁 ₹240 now becomes a key support level.
📊 Increasing volume supports institutional accumulation possibility.
📌 Trade View:
Aggressive Entry:
• Entry around current levels if price holds above the breakout zone (₹256+).
• Use a stop-loss as per your risk plan.
Conservative Entry:
• Wait for a retest of the breakout zone (₹240–₹256) with confirmation through price action and volume support.
• Ideal for traders preferring high conviction and lower risk.
•Bias: Bullish
•Support: ₹240 (flip level), ₹225 (minor swing)
•Invalidation: Close below ₹240
🧠 Rationale:
The long base, clean breakout, and strong volume together suggest a high-probability bullish continuation. Absence of nearby resistance offers a decent runway towards the ₹280–₹290 zone. This move is also backed by strength in the broader cement sector.
🚨 Disclaimer: This is not financial advice. All views are shared for educational purposes only. Always do your own research and manage risk responsibly before making any trading decisions.
What is your view please comment it down and also boost the idea this help to motivate us.

HINDUSTAN UNILEVER LTD – Technical Analysis________________________________________
🧠 HINDUSTAN UNILEVER LTD – Technical Analysis
Ticker: NSE: HINDUNILVR | Sector: FMCG
Current Price: ₹2,521.20 ▲ (+3.44% on July 31, 2025)
Technical View: ⭐⭐⭐⭐ | Chart Pattern: Volume-Driven Range Breakout
________________________________________
Latest News & Developments
Hindustan Unilever (HUL) reported strong Q1 FY26 results, with standalone net profit rising 7.6% YoY to ₹2,732 crore and consolidated profit up ~6%. Revenue grew ~4–5% YoY, aided by a rural demand rebound and volume-led gains in home care and beauty segments. While demand recovery is still gradual and margin guidance has been trimmed, the company is ramping up investments for future growth. A key structural change includes the demerger of its Kwality Wall’s ice-cream business by FY26-end. Leadership transition is also underway, with Priya Nair set to take over as CEO & MD from August 1, 2025. Shares surged 3.5% on July 31 to ₹2,521.85, outperforming the market.
________________________________________
Technical Analysis & Chart Pattern
Hindustan Unilever Ltd (HUL) has broken out above a key resistance zone of ₹2,440–2,445 on the daily chart, supported by strong volume and a bullish candle. This move ends the prior consolidation phase between ₹2,136–2,602. Momentum indicators such as RSI (~70), MACD, and moving averages show a bullish bias. If the price sustains above ₹2,500, the stock may trend toward resistance levels at ₹2,573, ₹2,625, and ₹2,702. Key support levels lie at ₹2,445, ₹2,368, and ₹2,316.
________________________________________
Trade Analysis (SEBI-Compliant | Educational Purpose Only)
As per the chart structure, the stock has shown a breakout above the ₹2,440–2,450 zone on strong volume, currently near ₹2,521. If momentum sustains, potential price zones to watch are ₹2,575–2,625 in the near term and ₹2,700+ in the medium term. A logical risk level could be around ₹2,395 or near the breakout point of ₹2,440.
________________________________________
Technical & Sentiment Snapshot
The stock recently broke out with strong volume, indicating accumulation post-consolidation. A pullback toward ₹2,440–2,430 may test the breakout zone, while a move to ₹2,360–2,316 could signal range re-entry. Sustained trade above ₹2,500–2,520 may indicate trend continuation. Market participants are watching volume behaviour on dips and potential sentiment shifts under new leadership. Key risks include broader market weakness, margin pressures, and rural/urban demand trends.
________________________________________
Educational Insight for Learners
A classic breakout occurs when a stock trades within a defined range (support and resistance) and then moves sharply beyond that range with strong volume. To identify such setups, observe the range boundaries, wait for a confirmed close outside the range, and ensure volume rises on the breakout. Entry is ideally near the breakout, with a stop just inside the range and targets based on the range height. The recent price action in HUL aligns well with this rectangle breakout concept — a valuable pattern for learners to study.
________________________________________
⚠️ Disclaimer & Educational Note
This content is strictly for educational and research purposes only. I am not a SEBI-registered advisor, and no buy/sell recommendations are being provided. All insights are based on personal analysis and experience and are not financial advice.
📘 This setup illustrates how combining price action (candlesticks), support/resistance zones, volume, and indicators like RSI or MACD can help build conviction in trades. However, trading—especially in derivatives like options—involves high risk, and losses can exceed the initial investment.
👉 Always do your own research and consult a SEBI-registered advisor before taking any position.
👉 Use strict risk management and only trade with capital you can afford to lose.
The author assumes no liability for any losses incurred.
By engaging with this content, you agree to these terms.
________________________________________
💬 Found this helpful?
Drop your thoughts, questions, or insights in the comments below ⬇️ — let’s learn together!
🔁 Share this post with your trading friends and community — help them discover clean charts, structured setups, and zone-based learning.
✅ Follow simpletradewithpatience for clear setups, educational content, and a no-nonsense approach to price action, supply-demand zones, and risk-managed trades.
🚀 Trade with patience. Trust your charts. Stay clear-headed.
Because the goal is not just to trade — it's to trade better.
Be Self-Reliant | Trade with Patience | Learn with Charts & Zones 📊
________________________________________
