Potential Long Sector Turnaround - Nifty FMCG
Nifty FMCG has given a healthy correction of ~16% and is trading at a crucial make or break level.
Its following a broadening channel pattern and has reached the bottom level of the megaphone channel, which gives a favorable risk/reward ratio to initiate a position.
It has formed a head & shoulder pattern also, but its trading near the base of a major support level so the probability of this pattern turn around is low, this can potential lead to a trap which might be a favorable condition to initiate a long position, but as its a assumption position to be initiated with a strict SL if H&S pattern gets activated.
Long Position can be initiated in FMCG ETF once we gets a positive close or early entry can be initiated maintaining a strict SL.
Note: This is just for analysis purpose, please do your own research before punching any orders.
🔍 For more technical analysis and trade setups, make sure to follow me on TradingView
Broadening

All you need to know before Investing or Averaging in Hdfc BankI daily make edcuational content videos on financial markets

Reason why I am bearish on 10Y T-Note#ZN1! #10YearTNote #Weekly #CBOT
- I took a deep look into the 10-year Treasury Note, futures commodity. The chart above is weekly.
- In Elliott Wave Theory perspective, an assumption has been made that the bullish wave starting from the swing low at 117’13’5 to the swing high at 140’20’0 as am impulsive 5-3-5-3-5 zig zag wave structure.
- With that said, I am weighing more on the possibility that the bullish wave from 130’25’0 to 135’15’0 is an 5-3-5 ABC corrective phase and this scenario becomes a bit more solid if bottom of the blue channel fails supporting.
- While expecting another corrective wave, a major confluent zone to keep an eye on is the red circle on the chart. This is where an inner downward trendline, a neckline (green trendline), and 0.382 retracement level overlaps.
- However, entering long here seems quite risky considering the RR ratio. Also, if the potential neckline (green trendline) breaks below, I am way more bearish expecting widening/broadening pattern.
- Those aggressive traders willing to take the risk here (buying at red circle), make sure to set a tight stoploss. I would rather be patient and wait until the price action gets confirmed and enter short if the trendline fails supporting.
- Here are some of the decent areas to enter long position if the H&S case is likely after observing failure of support at the neckline: 128’5~129’5 and 124’9~125’9.

Mentorship InstaView 26 July’21: Tough Times make Smart Traders
Nifty View: The Benchmark Nifty index has been particularly erratic over the past few weeks as it failed twice to see follow-through movement post a breakout. The daily chart of the index will reflect a “Broadening Triangle” which implies the existence of a higher high and a lower low - a classic sign of confusion. The underlying short term trend of the index is now non-directional. However, one can expect some momentum if the index breaks above 15,860 or a break below 15,782. Not the best of times to trade aggressively as the sharp volatility will lead to whipsaws. Better to focus on risk management and go for those trades wherein the conviction is maximum.
Thank you for following my work and please feel free to share your thoughts and suggestions.
Trade Well. Trade Wise.

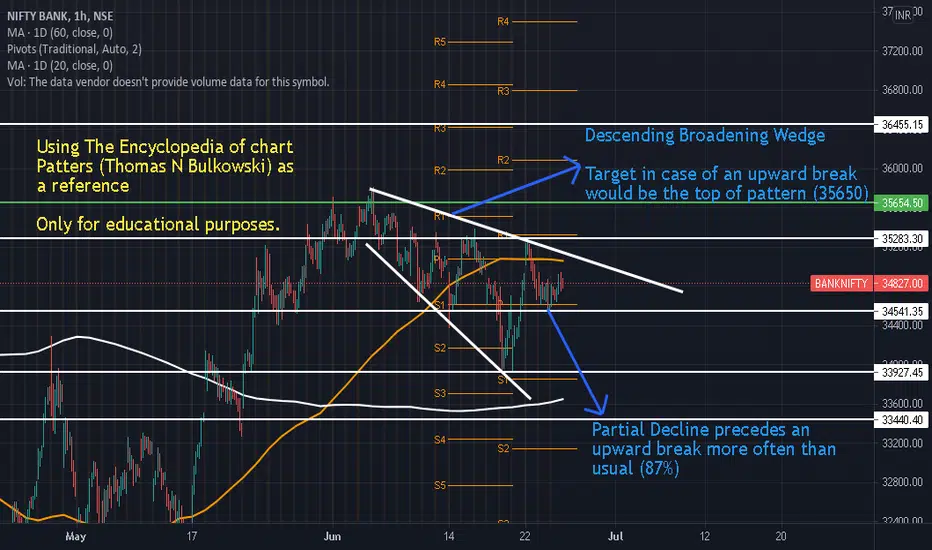
Broadening Descending Wedge Setup?Notes:
BankNifty seems to be forming a descending broadening pattern.
Statistically (Taking Thomas N Bulkowskis book as a reference) an upper breakout is preceded by a partial decline (as in this case) around 87% of the time.
Target in case of a breakout on the upper side would be the top of the pattern which is 35650.
Please note - Not a SEBI Registered Advisor/Analyst. Only for Educational Purposes. Please Consult your financial advisor before you take any action.
The book came highly recommended by a community member. Its really interesting if you have an interest towards statistics.
INDUSIND BANK - Broadening pattern | Target - 1300 🔰 MY thought process :
⭐A broadening pattern on the Daily chart :) meeting with fibo extension giving a perfect round number of 1300 which seems to be achievable but in a while, kinda positional setup for me :)
🔰Am I taking this trade now: No---Reason: Already in the trades of Naukri and PPL as posted last time :) also took a small position in Coal India today as posted guys :)
Also keeping an eye on JSW steel too seems bullish to me :), All the analysis already posted :)
🔰 {Some info}
➼My name is Apoorv and I am a 2nd year Engineering student, I want to pursue trading as my career, and thus whatsoever setups or trades I potentially see on my charting platform, I post it here and share them with you all.
➼I hope you will love my simple analysis style.
➼Feel free to suggest your view on this as learning is earning here :)
➼I take my trades on my Zerodha account :)
➼These charts are my and only my work, my thought process, just from an educational point of view and no calls.
<<<<<>>>>>

PIDILITIND: Broadening Pattern BreakoutFibo Retracement of 78.6% + Trend Line Breakout + Pattern Breakout + U-shaped Volume
#Bulkowski_Chart_Patterns
Entry: 1753 (Breakout Level)
Target:1775 (Previous High and Fibo level)
SL: 1744 (Fibo Level & Level of Partial Decline)

Broadening Top Formation - Textbook ExampleL&T Finance | Short Below 128 | Stop-loss 134 | Target 105 |
Risk/Reward 1:4
It's a broadening top formation. And pretty much like what the textbook describes. Be careful because nice-looking patterns are rarely successful.
If price closes above the upper trendline before breaking 128 then the trading setup becomes invalid.

Broadening Bottom/Divergence Potential Trend Reversal StockIdentifying the reversal and its timing is quite difficult and risky but sometimes its worth to take small risk. The stock is clearly in downtrend but it is forming Broadening Bottom reversal pattern and RSI is showing divergence. One can buy the stock by providing the SL of low of yesterday. If it works it could reward well. Being a volatile stock one can also try with low investment Options strategy like Bullish Call spread.
Disclaimer : All ideas and comments are my personnel view. Please take financial consultancy for trading decision.

Broadening Top (Megaphone) Pattern BreakoutThe stock has nicely formed Broadening Top (Megaphone) Pattern and gave the breakout today. It has also broken the medium term resistance of 1274. Although it is trading above another resistance of 1330 but still a threat on the onward journey. One can use the setup to go long by providing a SL of 1310 on closing basis.
Disclaimer : All stock recommendations and comments are my personnel view please take financial consultancy for trading decision.

Broadening Bottom ReversalThe stock is forming Broadening Bottom pattern nicely so one can take advantage of it. It is showing strength at the third touch so can buy the stock now with small stop loss.

Trade possibility : Descending Broadening Formation The Stock has nicely formed the "Descending Broadening Formation" which could be used for trading. How to trade it : if it breaks the upper horizontal line and stay there for some period one can go long. If it gives false breakout and come back immediately to the the upper line one can short the stock. Good Luck

UJJIVAN - BROADENING WEDGE IN PROGRESS It is been observed that the price action is consolidating at the bottom in a broadening wedge pattern. It is at the make it or break it situation. It has good support at 310 levels and then 290 levels. Currently, at a look risk and high potential profit scenario. Now, today's closing shall matter a lot.
Target 1: 322
Target 2: 330
Stoploss: 310

Bajaj Finace Long : Broadening FormationThe stock is in uptrend so one should follow the trend until it changes and try to enter long at appropriate level. The stock has formed a Broadening Formations and yesterday's Green bar and today's trading above it are indicating a potential long at this level. Stop Loss closing below the lower line.

PFC Broadening Right-Angled and AscendingThe pattern is also called Megaphone. It has also formed 3L-Reversal at the top so one can short the stock wherever stop loss of 139.9 on closing basis is affordable. If the pattern works one can expect the price to touch the lower line around 112. Safe trader can book the profit on fib level that too offers a good risk to reward ratio

Broadening top Reversal Patterm ShortThere is a possibility to trade Broadening top pattern. RSI is forming divergence also confirming weakness in the stock. Shorting now with Stop Loss just above the high made recently.

Classical Chart Pattern Short PFCThe pattern is self explanatory one can short now with small stop loss and take the ride till the lower level or whenever feels it is good profit. Risk to reward could be good.
