Gold Market Flow Points Toward Higher LevelsGold Market Flow Points Toward Higher Levels
Gold continues to display a controlled upward trajectory characterized by steady accumulation and orderly price expansion. The recent sessions show a consistent pattern of demand absorption, where each corrective phase is met with renewed buyer engagement, preventing deeper retracements. This suggests that the market remains comfortably positioned within a bullish environment, supported by ongoing interest from medium-term participants.
Price flow has transitioned away from the aggressive liquidation seen earlier in the month and is now driven by a more balanced rotation between buyers and short-term profit-takers. Despite this rotation, the dominant pressure remains upward, as visible through the repeated failure of sellers to extend declines. Momentum flows indicate that buyers are gradually reclaiming lost ground after every corrective cycle, signaling stable confidence in higher valuations.
Market behavior also reflects a pattern where liquidity beneath short-term swing points is routinely harvested before upward expansion resumes. This action shows that deeper market participants continue to optimize entry points by collecting orders during brief moments of weakness. Once these orders are filled, price rapidly rotates back upward, revealing that underlying demand remains unshaken.
Current positioning suggests that Gold is in a preparation phase for another expansion leg. Price is stabilizing in a compression zone where volatility temporarily narrows before a directional drive. Historically, such compression within an established upward environment often precedes continuation, especially when buyers demonstrate willingness to defend even shallow pullbacks.
Bullishcontinuation

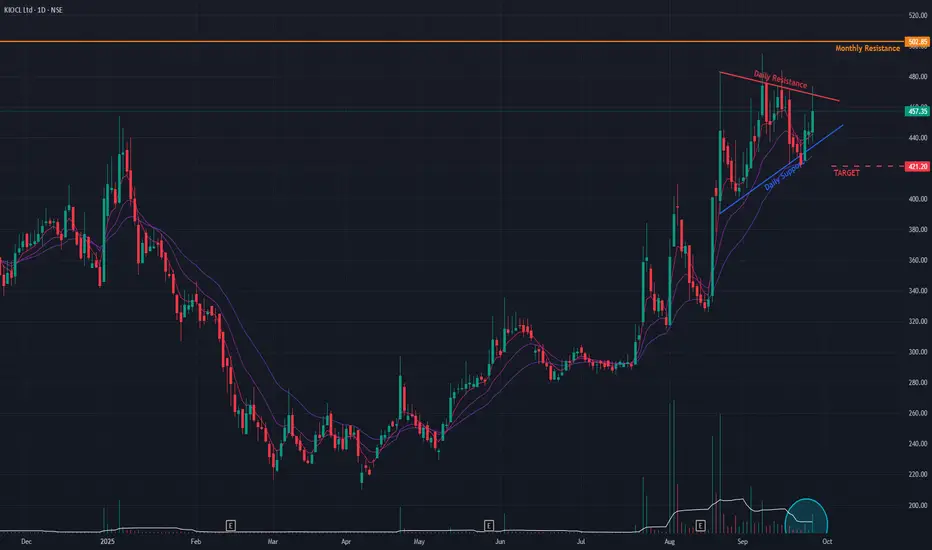
KIOCL (D) - Consolidates in Bullish Pattern After Massive RallyFollowing a powerful uptrend that has seen the stock gain over 125% since its bullish reversal in April 2025, KIOCL is now consolidating in a bullish Flag & Pole pattern . This chart formation is typically a continuation pattern, suggesting that the prior uptrend is likely to resume after this brief pause.
The stock is currently trading within the "flag" portion of the pattern. A breakout from this consolidation is the key trigger for the next potential move.
Broad-Based Bullish Indicators 👍
The underlying trend remains strong, supported by a host of positive technical signals:
- Multi-Timeframe Strength: Short-term Exponential Moving Averages (EMAs) are in a bullish state across the monthly, weekly, and daily charts .
- Confirmed Momentum: The Relative Strength Index (RSI) also confirms a bullish state on the monthly and weekly timeframes. While the daily RSI has not yet completed a bullish crossover, it is positioned to do so.
- Volume Buildup: A noticeable increase in trading volume during recent sessions suggests accumulation is taking place within the pattern.
Hurdles and Key Levels
For the uptrend to continue, the stock must first break out above the upper trendline of the flag pattern . Immediately following a potential breakout, it will face another significant hurdle in the form of a long-term horizontal resistance trendline .
- Bullish Case 📈: If the stock successfully breaks out of the flag pattern and sustains its momentum, the next potential price target is the resistance zone near ₹620 .
- Bearish Case 📉: If the pattern fails and momentum is not sustained, the stock could pull back to find support near the ₹420 level. The price action in the coming days will be critical.
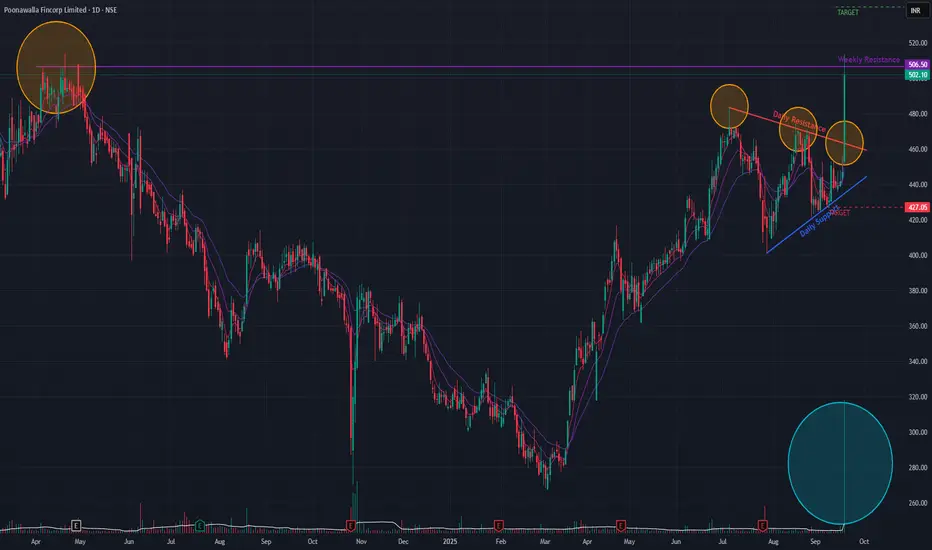
Poonawalla Fincorp (Daily) - Potential ATH ?Poonawalla Fincorp has shown a significant bullish development, decisively breaking out of a Triangle continuation pattern today. This breakout was marked by a substantial 12.30% surge in price , backed by exceptionally high trading volume.
This move signals a potential continuation of the bullish run that began in March 2025, which itself was a reversal of a downtrend initiated by a Double-Top bearish pattern in April 2024.
Bullish Confirmation Signals 👍
The positive outlook is supported by several key indicators:
- Breakout Volume: The price surge was accompanied by a massive spike in volume , indicating strong conviction and participation from buyers.
- Momentum: Short-term Exponential Moving Averages (EMAs) have formed a positive crossover , confirming the renewed bullish momentum in the immediate term.
Immediate Hurdle Ahead 🚧
Despite the strong breakout, the stock is now trading at a crucial long-term resistance level . Overcoming this barrier is essential for the upward trend to continue.
Future Outlook and Scenarios
- Bullish Case 📈: If the upward momentum is sustained and the stock successfully breaks through the current long-term resistance, it could clear the path to test its all-time high . An initial price target in this scenario would be the ₹539 level.
- Bearish Case 📉: Conversely, if the stock fails to breach this resistance, the momentum could fade, potentially leading to a price correction towards the ₹427 support level.
Watchout for the price-action in the next few sessions !!
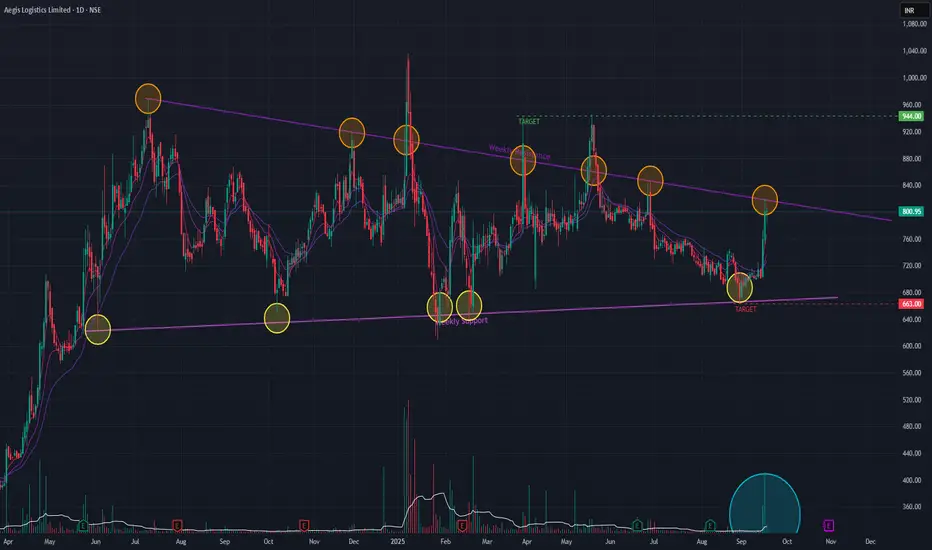
Aegis Logistics (Daily Timeframe) - Potential Breakout ??Following a strong uptrend that peaked in July 2024, Aegis Logistics entered a multi-month consolidation phase. Despite marking a new all-time high in January 2025, the stock lacked sustained upward momentum and has since formed a clear Symmetrical Triangle pattern . This pattern typically acts as a continuation signal, suggesting the prior uptrend is likely to resume.
Recent Bullish Momentum
This week, the stock has shown a significant surge in buying interest, rallying +14.05% on the back of very high trading volume. This powerful move towards the triangle's upper boundary indicates strengthening bullish sentiment and a potential impending breakout.
Indicator Analysis
On the daily chart, short-term Exponential Moving Averages (EMAs) have already registered a bullish crossover , confirming the immediate positive momentum. While the weekly EMAs are yet to confirm a similar crossover, they are aligning positively, suggesting a longer-term bullish signal may be forming.
Future Outlook & Key Levels
The direction of the next major move hinges on the resolution of this triangle pattern.
Bullish Scenario: A decisive breakout and close above the triangle's upper trendline would confirm the pattern's continuation. The primary upside target in this case is ₹944 .
Bearish Scenario: If the stock fails to break out and instead breaches the lower trendline of the triangle, the bullish thesis would be invalidated. The key support level to watch on the downside would be ₹663 .
Watchout for the Price-action !!
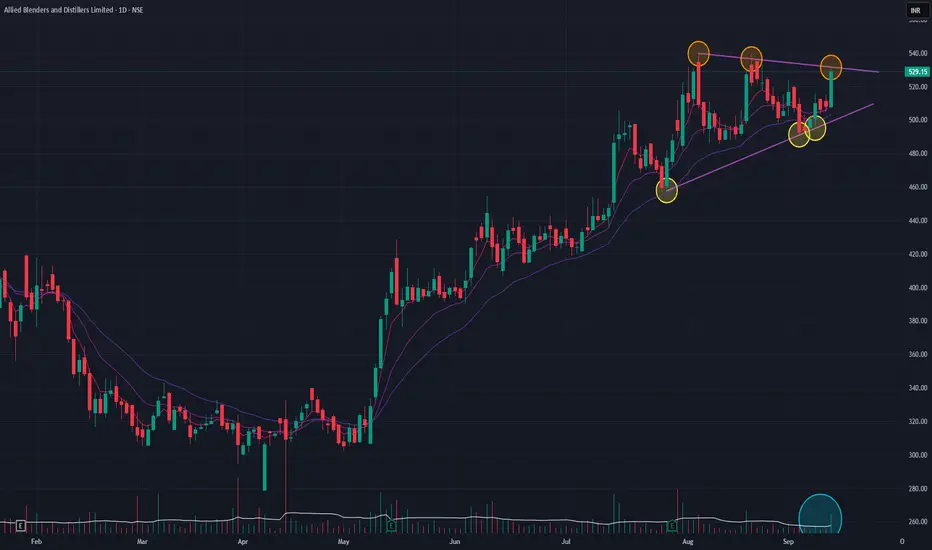
ABDL (Daily Timeframe) - Can it continue the uptrend ??ABDL is in a confirmed uptrend, having rallied over 90% since its April 2025 lows. The stock is now consolidating within a bullish triangle pattern , which typically signals a continuation of the prior trend.
This bullish outlook is supported by several key factors:
Today's significant price surge was accompanied by a massive spike in volume, confirming strong buyer interest and a potential breakout.
The short-term Exponential Moving Averages (EMAs) are in a Positive Crossover (PCO) state , indicating strong underlying momentum.
If the breakout from the triangle is sustained, the next potential price target is the ₹614 level.
EXSIMHB - SIDEWAYS with potential UPSIDE BIAS ?EXSIMHB - CURRENT PRICE : RM0.340
In long term the uptrend is still intact as the share price is above 200-day EMA.
For short and medium term is in SIDEWAYS.
The stock had consolidated since JUNE 2024 (almost 8 months).
The nearest resistance for this stock is RM0.355. If the share price penetrates this level, it has potential of continue to move upside. As such, I considered this as a pending breakout stock.
ENTRY PRICE : RM0.360 - RM0.370
TARGET : RM0.400 , RM0.440 (52 Week High)
STOP LOSS : RM0.320
TAYOR !

TILAKNAGAR INDUSTRIES (TI)Tilaknagar industries is an alcohol/beverage based company. The stock is in a strong uptrend and as festivals are approaching, it can lead up to 260-300 levels by this end of the year. PATTERN: Pole and Flag.

Crude Oil- BULLISH CONTINUATION!Attached: Crude Oil Daily Live Market Chart
On Sunday 2nd April 2023, Saudi Arabia and other OPEC+ oil producers announced further oil output cuts of around 1.16 million barrels per day.
Top OPEC producer Saudi Arabia said it would cut output by 500,000 bpd.
And due to this Surprise Output Cut, the Next Day itself Oil Prices Gapped Up and Closed Up 6.16% (+ 4.66 dollars)
Following that Prices have consolidated for 4 days giving Inside Bars, holding the Gap Zone
Today, Price is finally some some Buying Action
It appears that the Gap Up is a Breakaway Gap and now Oil Prices are ready to Break Out of the 4 day Consolidation
Looking at Moving Averages:
20 EMA has crossed above 50 EMA giving a Buy Signal
Price is consolidating right below 200 EMA and once its Breaks above it, Price is to Accelerate on the Upside
LEVELS:
Current Market Price= $ 81.40
Upside Target:
$ 92 to $ 100
Stop Loss:
below $ 79
....................................

Voltas buy @ 1030Forming Bullish continuation pattern(cup & handle)
With a stoploss of 1005
Timeframe: 1month

Bullish Wedge on Adaniport..Once a one hour candle convincingly breaks the green line(a close above green would be great) Take long entry.
For live entry with proper entry and exit plans, follow Pyramid Trading Community

BTST TRADE IN HULBTST TRADE IN HUL
TRYING THE SHORT COVER TRADE RISKY-TRADE
BUT SINCE A BLUECHIP WORTH THE RISK
BUY@1660
STOP@1640
TARGET@1680
LOT:600
QTY:2

Dr. Reddy – BreakoutWith Pharma sector looking all set for a second leg of rally, many pharma stocks have given a breakout.
I can see that Dr. Reddy NSE:DRREDDY has broken out of the corrective channel which started after a long leg of upmove to begin next leg of rally.
So long as the stock stays above 2200 levels, looks like it is heading towards 2450 and 2600 levels.
Good opportunity to go long here with a small stop loss.
Disclaimer: Views expressed here are my own, and should not be interpreted as an Investment Advice. Please consult your Financial Advisor for investments.

Cipla – Flag BreakoutCipla is another stock in the Pharma sector (along with Lupin) which I think has given a Flag breakout yesterday.
The stock broke from the consolidation range of 600 to 622.
So long as the stock stays above 620, looks like it is headed for 660 levels.
Good opportunity to go long here with a small stop loss.
Disclaimer: Views expressed here are my own, and should not be interpreted as an Investment Advice. Please consult your Financial Advisor for investments.

Lupin - Flag Breakout With Pharma sector seeing buying momentum again, many Pharma stocks are on the verge of breakout.
I can see that Lupin NSE:LUPIN has given a breakout from the Flag pattern with a large Bullish candle after consolidating between 877 and 924 for a couple of days.
Good opportunity to go long here with a small stop loss for a first target of 972.
Disclaimer: Views expressed here are my own, and should not be interpreted as an Investment Advice. Please consult your Financial Advisor for investments.


Tata Steel Bullish PatternHead and shoulders type pattern on 15 min tata steel chart after nice bull rally
buy above - 451.35
stoploss - 443
target - 474+
