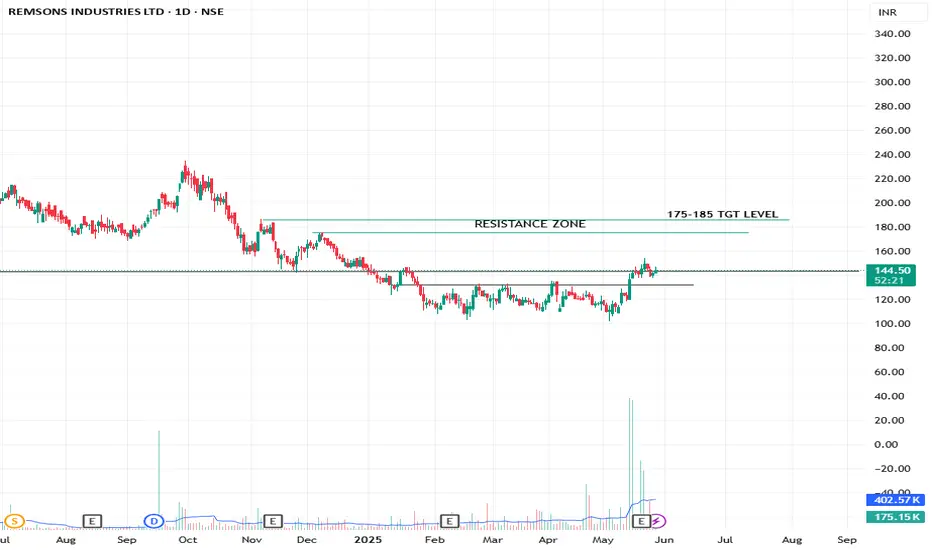
SWING/POSITIONAL PICKREMSONS INDUSTRIES LTD
TECHNICAL VIEW
Stock is shift the range and consoilidate near resistance or breakout zone. Buy 140-145 for 175-185 TGT, sl near 130 at closing basis..
FUNDAMENTAL VIEW
Quarterly/Yearly EBITDA & PAT Both Are Highest In History. ROE & ROCE Is Also Good.
I Am Not SEBI Registered Research Analyst. It Is Giving Only Educational Purpose. Trade In REMSONSIND After Discussing With Your Financial Advisor.
Bullishsetup
Massive Breakout + Volume Surge! KEC Looks Ready to Explode📌 Technical Breakdown:
🔹 CT (Counter-Trendline): A clear downward-sloping white dotted CT has been broken with a powerful bullish candle.
🔹 Base Formation: A strong accumulation zone (green zone) is evident where higher lows were formed, indicating demand absorption.
🔹 200 DEMA: The price cleanly breaks above the 200-day exponential moving average, which often acts as a major dynamic resistance.
🔹 Higher Low Structure: The recent price action formed a higher low, validating strength before the breakout.
🔹 Volume Confirmation: Recent candles show a surge in volume, confirming institutional participation and accumulation during the base.

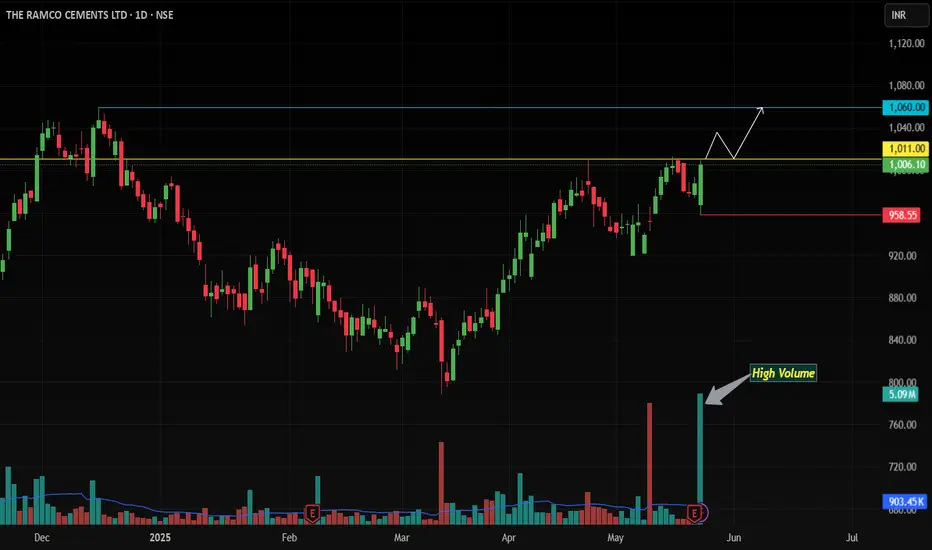
Bullish Breakout Alert! Key Resistance Zone Tested !Analysis Timeframe: Daily Chart | Instrument: The Ramco Cements Ltd (NSE: RAMCOCEM, BSE: RAMCOCEM)
Current Price: Near 1011-1015 | Key Levels: Resistance Zone (1011-1015), Support: 958 (Trailing SL)
🔍 Technical Setup Overview
Ramco Cements (NSE: RAMCOCEM) is flashing a high-conviction bullish reversal pattern on the daily chart, backed by surge in volume and multi-indicator confirmations:
Bullish Engulfing Candle 🕯️🔥
Today’s price action formed a Bullish Engulfing pattern, with the current candle fully swallowing the prior candle. This signals a strong shift in control from sellers to buyers, especially on extremely high volume (institutional accumulation).
EMA Alignment & Dynamic Support
Price rebounded sharply from the 20 EMA and sustains above the 50 EMA and 200 EMA, confirming the broader uptrend’s strength.
Resistance Breakout Potential
The 1011-1015 zone is a critical supply area. A daily close above 1015 would confirm the breakout, opening the path for a rally.
Momentum Confirmation
MACD: Bullish crossover
RSI: Crossed above, signaling bullish momentum acceleration.
🎯 Trade Strategy
Entry Trigger:
Go Long on Daily Close Above 1015
Targets:
First Target: 1060.
Trailing SL Strategy: After 1060, trail SL to the prior daily candle’s low. Exit only on a daily close below the trailing level.
Risk Management:
Initial Stop Loss: 958 (Today’s low, aligns with Bullish Engulfing pattern validity).
Risk-Reward Ratio: 1:2+ (Optimal for swing trades).
📉 Why This Works
Pattern Power: Bullish Engulfing + volume surge = high-probability reversal signal.
Trend Confirmation: Price above all key EMAs + breakout alignment.
Trailing SL: Locks profits while allowing for extended upside in a trending market.
🛡️ Key Risks
False Breakout: Failure to close above 1015 could trap bulls.
Market Sentiment Shift: Broader volatility may disrupt momentum.
Disclaimer: Trading involves risk. This is not financial advice. Verify setups independently.
#NSE #BSE #Breakout #BullishEngulfing #TechnicalAnalysis #RAMCOCEM #StockMarket
SMASH THAT BOOST BUTTON if you’re bullish! 🚀 Follow for more high-probability setups!
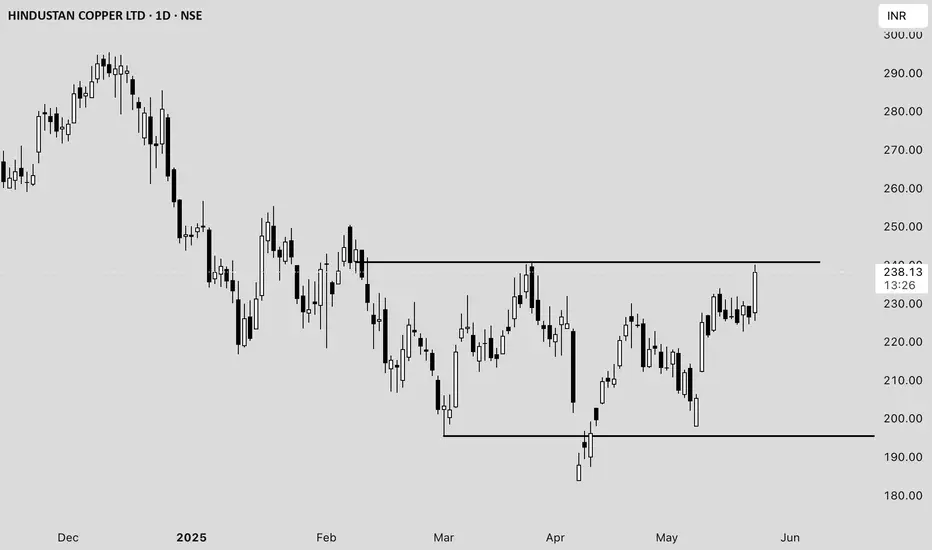
Hindustan Copper Ltd. (HINDCOPPER) Price Analysis **Date:*#### **Current Price and Intraday Movement**
- **Latest Price:** ₹237.98 (+5.09% / +₹11.52)
- **Day’s Range:** ₹225.50 – ₹240.10
- **Open:** ₹227.60
- **Previous Close:** ₹226.46
- **Volume:** 1.63 crore shares (well above average daily volume of 55.89 lakh)
#### **Technical Overview**
- **52-Week Range:** ₹183.82 – ₹381.90
- **50-Day Average:** ₹216.99
- **200-Day Average:** ₹260.58
- **Market Cap:** ₹23,013 crore
- **P/E Ratio:** 57.48
- **EPS:** ₹4.14
#### **Recent Performance and Trends**
- **Short-Term Trend:** The stock surged over 5% today, outperforming its sector and showing strong buying interest .
- **Volume Spike:** Today’s volume is nearly triple the average, indicating heightened trader participation .
- **Technical Position:** The stock is trading above its 50-day moving average but remains below the 200-day average, suggesting a recovery from recent lows but still under medium-term resistance .
- **Support/Resistance:** Immediate resistance is near ₹240–₹249 (upper circuit), with support at ₹225 and ₹216 (50-DMA) .
#### **Fundamental Snapshot**
- **Valuation:** High P/E ratio (57.48) signals expensive valuation relative to earnings .
- **Profitability:** EPS at ₹4.14; profit margins have been under pressure.
- **Industry Position:** Hindustan Copper is India’s primary copper producer, with exposure to global copper price trends and domestic infrastructure demand.
#### **Outlook**
- **Short-Term:** Strong momentum and volume could drive further upside if it breaks above ₹240, but overbought conditions may trigger profit booking near resistance.
- **Medium-Term:** Needs to sustain above the 200-DMA (~₹260) for a confirmed trend reversal.
- **Risks:** High valuation and recent volatility; global commodity price swings can impact earnings.
---
**Summary:**
Hindustan Copper is showing robust short-term momentum with strong volume and price gains, but faces resistance near ₹240–₹249. The stock remains fundamentally expensive, and investors should watch for sustained moves above the 200-DMA for a longer-term bullish signal .
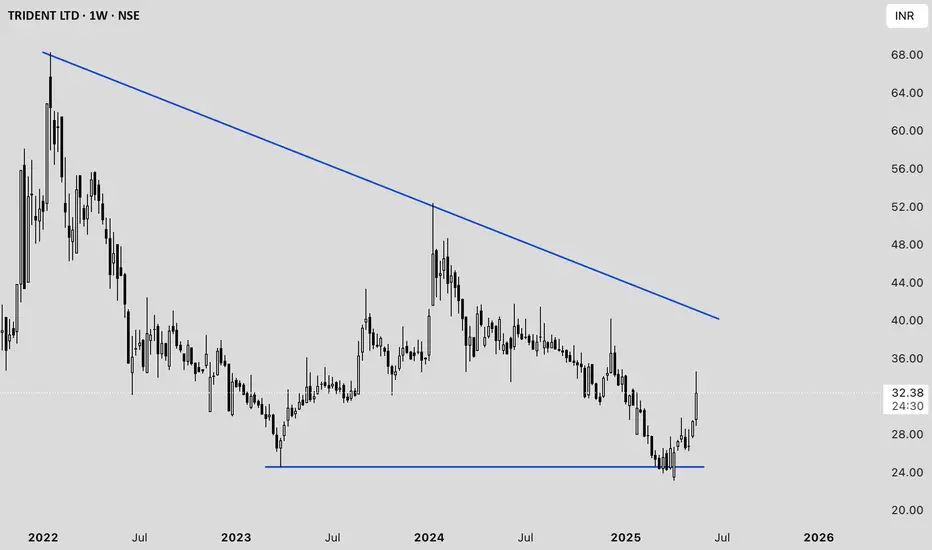
Trident Ltd. Price Analysis (as of May 23, 2025)#### **Current Price and Recent Movement**
- **Latest Price:** ₹32.11 (down 2.32% from the previous close) .
- **1-Week Return:** +9.29%
- **1-Month Return:** +9.11%
- **1-Year Return:** -15.39%
- **3-Year Return:** -32.89%
#### **Technical Analysis**
- **Buy Signal:** A 200-day moving average crossover occurred on May 21, 2025. Historically, this signal has led to an average gain of 6.61% within 30 days .
- **Momentum Indicators:**
- **RSI:** 62.17 (shows moderate bullish momentum)
- **MACD:** 0.535 (bullish signal)
- **Stochastic:** 75.40 (approaching overbought zone)
- **Supertrend:** 26.03 (bullish)
- **ROC:** 10.87 (positive momentum)
- **Analyst Sentiment:** 100% of analysts currently recommend a "Buy" with an average target price of ₹38, indicating a potential upside of ~15.6% .
#### **Fundamental Overview**
- **P/E Ratio:** 44.50–45.65 (well below the industry average of 126.09, but still high relative to earnings growth)
- **Price-to-Book Ratio:** 3.62–3.88
- **Dividend:** Announced ₹0.5 per share (record date: May 27, 2025) .
- **Net Profit Margin:** 5.78% (FY24)
- **Return on Equity:** 9.04% (FY24)
- **Debt/Equity:** 0.48 (moderate leverage)
- **Intrinsic Value Estimate:** ₹9.73 (suggests current price is at a premium to intrinsic value)
#### **Recent Financial Performance**
- **Q3 FY25 Revenue:** ₹1,667.09 crore (down 9.17% YoY)
- **Profitability:** Net profit/share for FY24 was ₹0.76, down from ₹0.83 in FY23
- **Expense Management:** Interest expense is low at 1.86% of operating revenue; employee cost is 13.2%
#### **Strengths**
- Strong technical momentum and recent bullish crossover.
- Consistent dividend payout.
- Low interest expense and moderate leverage.
#### **Weaknesses**
- Declining revenue and profit over the last few quarters.
- High valuation relative to earnings and intrinsic value.
- Long-term returns have been negative over 1 and 3 years.
#### **Outlook**
Analysts remain bullish in the short term, buoyed by technical signals and an expected price target of ₹38 . However, fundamental concerns such as declining profits, high P/E, and premium to intrinsic value warrant caution for long-term investors.
---
**Summary:**
Trident Ltd. is showing short-term bullish momentum with positive technical indicators and analyst sentiment. However, investors should be cautious due to weak long-term performance, high valuation, and recent declines in revenue and profit .
FSL price actionFirstsource Solutions Ltd (FSL) on the NSE is trading at ₹385.55 as of May 23, 2025 . The stock has shown strong performance over the past year, with a return of 87.31% and a five-year return exceeding 1,100% . FSL’s 52-week high is ₹422.30, while the 52-week low is ₹176.25 .
Recent price action shows that after peaking near its all-time high in January 2025, FSL corrected but has since rebounded sharply from the ₹320–₹330 range in early May to the current levels. Trading volumes have been robust during this rally, indicating strong market participation.
Technically, FSL is in a bullish trend, but short-term volatility remains high. Key support is seen around ₹355–₹360, while resistance is near ₹385–₹422. Sustained trading above ₹385 could open the way for a retest of the all-time high. The stock is considered high risk, being over three times as volatile as the Nifty index .
Fundamentally, FSL reported a 29.4% year-on-year revenue growth in Q4 FY25, driven by its healthcare and banking verticals. The company is focusing on client diversification and operational efficiency, with a projected 12–15% revenue growth for FY26. Its P/E ratio is 43.34 and P/B ratio is 6.96, both above the sector average, reflecting premium valuations .
In summary, FSL is in a strong uptrend with positive momentum and robust financial performance, but short-term volatility and premium valuations warrant cautious optimism for new investors .

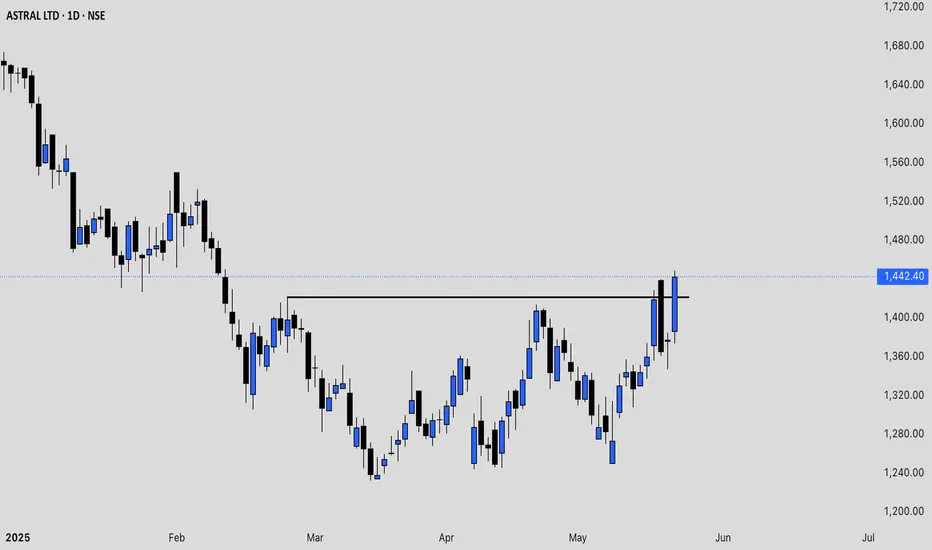
ASTRAL price action analysis Astral Ltd (ASTRAL) has shown a mix of volatility and recovery in May 2025. After a sharp decline earlier in the month, the stock rebounded, with recent prices moving from the ₹1,330–₹1,350 range up to ₹1,377.70 as of May 21, 2025. The trading volumes have remained strong, indicating active participation from both buyers and sellers.
Technically, Astral is trading above its short-term volume-weighted average price (VWAP) of around ₹1,362.9, which is a positive sign for near-term momentum . The price action over the past week has included both sharp drops and quick recoveries, suggesting a tug-of-war between bulls and bears. Oscillators and moving averages currently indicate a neutral to mildly bullish setup, with the stock having recovered from oversold levels seen earlier in May.
Astral’s 52-week high is ₹2,454, and the 52-week low is ₹1,232, showing that the current price is closer to the lower end of its yearly range . The price-to-earnings (P/E) ratio remains high (around 70), and the price-to-book (P/B) ratio is also elevated, reflecting premium valuations . The company’s fundamentals remain strong, but the high valuation and recent volatility suggest that further upside may require continued earnings growth or positive sector developments.
In summary, Astral is currently in a recovery phase after recent volatility. The technical outlook is neutral to slightly positive as long as the stock holds above the VWAP and key short-term support levels. Investors should watch for sustained moves above ₹1,380–₹1,400 for confirmation of renewed bullish momentum, while a drop below ₹1,350 could signal renewed weakness.
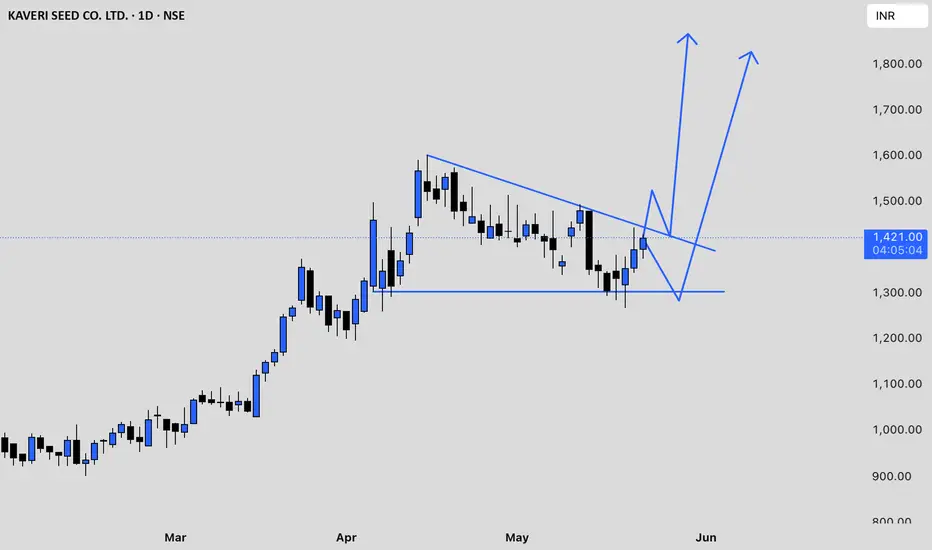
KSCL chart analysisKaveri Seed Company Ltd (KSCL) has recently experienced significant volatility. After reaching a peak above ₹1,480 in mid-May 2025, the stock corrected sharply, falling to the ₹1,305–₹1,345 range by May 16, marking a notable pullback of nearly 9% in a single session. Trading volumes have been high, indicating strong market participation during both the rally and the subsequent sell-off.
From a technical perspective, KSCL’s price remains above its 50-day, 100-day, and 200-day exponential moving averages, which suggests that the longer-term trend is still bullish. However, momentum indicators such as the Relative Strength Index (RSI) and Commodity Channel Index (CCI) are both in oversold territory, signaling that the recent correction may have been overdone and that a technical bounce could be possible if market sentiment improves. The Moving Average Convergence Divergence (MACD) is below its signal line, and the Average Directional Index (ADX) indicates the presence of a short-term downtrend.
Immediate support for KSCL is seen around ₹1,232, with further support at ₹1,174 and ₹1,116. On the upside, resistance is expected near ₹1,399, then at ₹1,457 and ₹1,515. The near-term pivot area is around ₹1,340–₹1,350.
Recent company developments—including the acquisition of a 30% stake in Aditya Agri Tech Pvt Ltd and the release of Q4 and FY25 results—may be influencing the current price action. The company has also been working to address challenges in receivables management, which could impact future performance.
In summary, KSCL is in a corrective phase after a strong rally, with oversold technical indicators suggesting potential for a short-term rebound if support holds. However, the short-term trend remains down, so traders should watch for stabilization above key support levels before considering new long positions. The longer-term outlook stays positive as long as the price remains above major moving averages, but caution is advised due to ongoing volatility and bearish momentum signals.
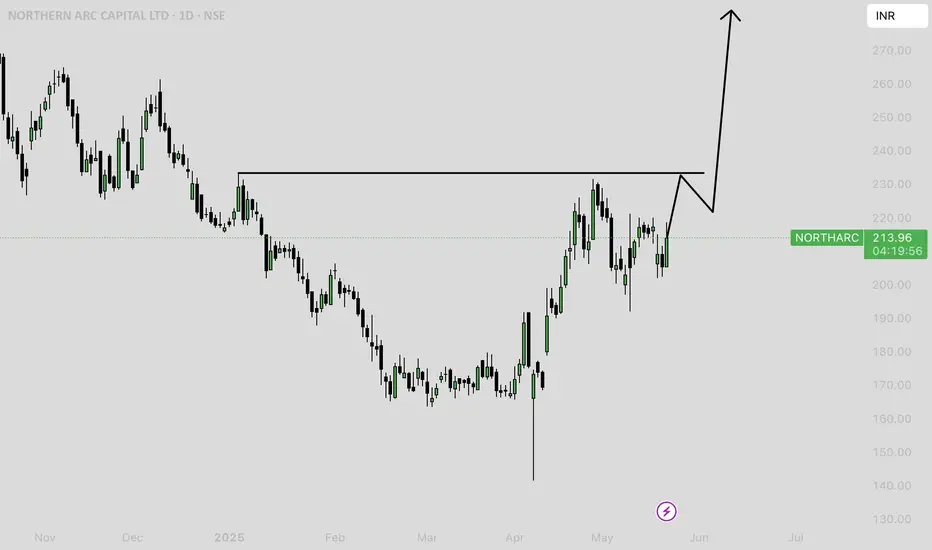
## NORTHARC Price Action Analysis
### **Recent Price Performance**
- **Current Price:** As of the latest available data, Northern Arc Capital Ltd (NORTHARC) is trading around ₹208–213.
- **Volatility:** The stock is showing a volatility of about 4.14% with a beta of 1.37, indicating higher-than-market volatility.
- **52-Week Range:** The price has ranged from a low of ₹141.47 (April 7, 2025) to a high of ₹350.00 (September 24, 2024).
- **Recent Trend:** NORTHARC has fallen by about 8% over the past week but is up nearly 14% over the past month. Over the last year, the stock is down 39% from its highs.
### **Technical Indicators**
#### **Moving Averages**
- **Short-term (20-day EMA/SMA):** Price is near or slightly below the 20-day EMA (₹201.94) and SMA (₹201.11), both indicating a neutral trend.
- **Medium-term (50-day EMA/SMA):** The price is below the 50-day EMA (₹216.61) and SMA (₹218.06), also signaling a neutral to weak trend.
#### **Oscillators**
- **RSI (14):** 34.43, indicating a downtrend and approaching oversold territory .
- **Stochastic RSI (14):** 0.41, signaling a strong downtrend.
- **CCI (14):** -97.09, also confirming a downtrend .
- **MFI:** 25.56, suggesting strong selling pressure and a strong downtrend.
#### **Support and Resistance Levels**
- **Immediate Support:** ₹188.54
- **Key Support:** ₹185.85, ₹181.19
- **Immediate Resistance:** ₹195.89
- **Next Resistance:** ₹200.55, ₹203.24
- **Pivot Level:** ₹193.2
### **Order Book and Liquidity**
- **Order Book:** There is active buying interest around ₹207–208 and selling interest around ₹210–215, indicating a tight trading range and liquidity at current levels.
- **Volume:** Trading volume is robust, with recent daily volumes exceeding 1.6 million shares.
### **Fundamental and Event Context**
- **Recent One-Time Provision:** NORTHARC recorded a significant one-time provision (impairment of ₹1,200 crore) in Q4 FY25, sharply reducing reported profits. Excluding this, underlying business performance was strong, and some analysts expect a rebound in the coming months.
- **Valuation:** The stock is trading at a price-to-book (P/B) ratio of 1.02 and a trailing P/E of 9.49, both below the sector average, suggesting attractive valuations if underlying fundamentals remain stable.
### **Technical Summary**
- **Overall Technical Rating:** Mixed signals. Moving averages are neutral, but oscillators indicate a downtrend and possible oversold conditions.
- **Short-Term Outlook:** The stock is near key support levels, with oscillators hinting at potential for a technical bounce if selling pressure abates. However, sustained weakness below ₹188 could trigger further downside.
- **Medium-Term Outlook:** Recovery potential exists if the stock holds above support and market absorbs the impact of the one-time provision.
---
**In summary:** NORTHARC is currently consolidating near its recent lows, with technical oscillators in a downtrend but approaching oversold territory. The price is below key moving averages, and significant support exists around ₹185–188. The stock may see a technical bounce if support holds, but further downside is possible if it breaks below these levels. The impact of the recent one-time provision is a key factor, with some market participants expecting a rebound as fundamentals normalize.
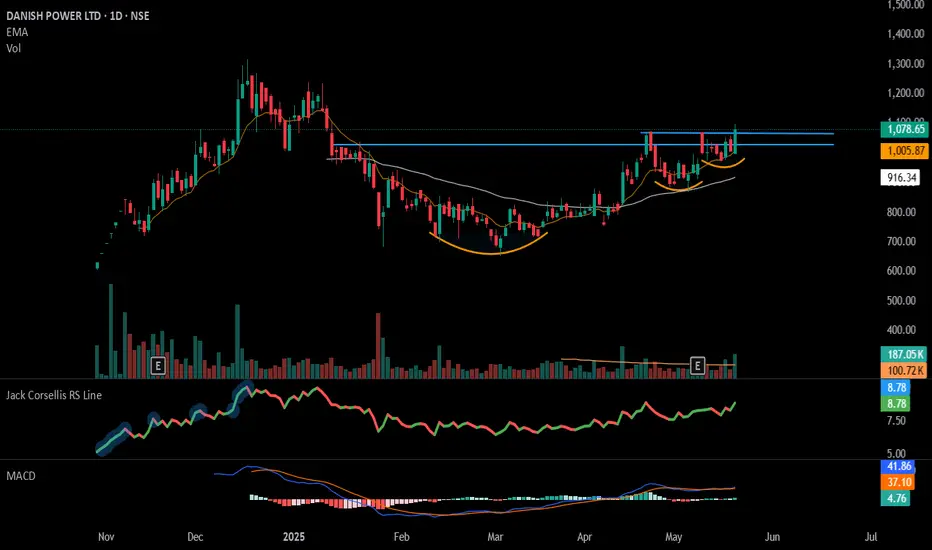
#DANISH - VCP + IPO Base in Daily Time Frame.📊 Script: DANISH
Key highlights: 💡⚡
📈 VCP + IPO Base BreakOut in Daily Time Frame.
📈 Price consolidated near Resistance.
📈 Volume spike seen
📈 MACD Crossover
📈 Can go for a swing trade
BUY ONLY ABOVE 1120 DCB
⏱️ C.M.P 📑💰- 1078
🟢 Target 🎯🏆 – NA%
⚠️ Stoploss ☠️🚫 – NA%
️⚠️ Important: Market conditions are Okish, Position size 50% per Trade. Protect Capital Always
⚠️ Important: Always Exit the trade before any Event.
⚠️ Important: Always maintain your Risk:Reward Ratio as 1:2, with this RR, you only need a 33% win rate to Breakeven.
✅Like and follow to never miss a new idea!✅
Disclaimer: I am not SEBI Registered Advisor. My posts are purely for training and educational purposes.
Eat🍜 Sleep😴 TradingView📈 Repeat 🔁
Happy learning with MMT. Cheers!🥂
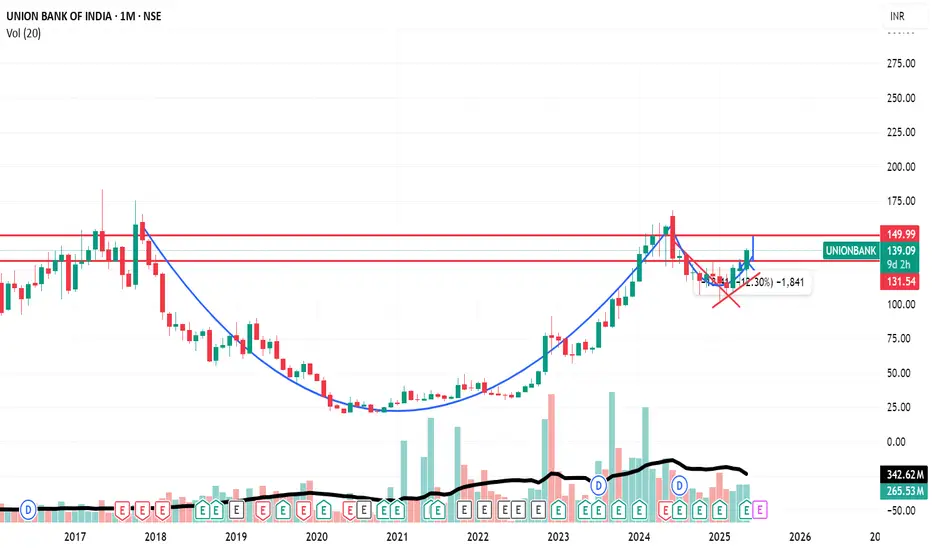
Union Bank Cup and Handle breakout with double bottom on daily.Union bank is about to breakout of a cup and handle pattern with strong signals of breakout of double bottom on a daily timeframe. Good script to invest.
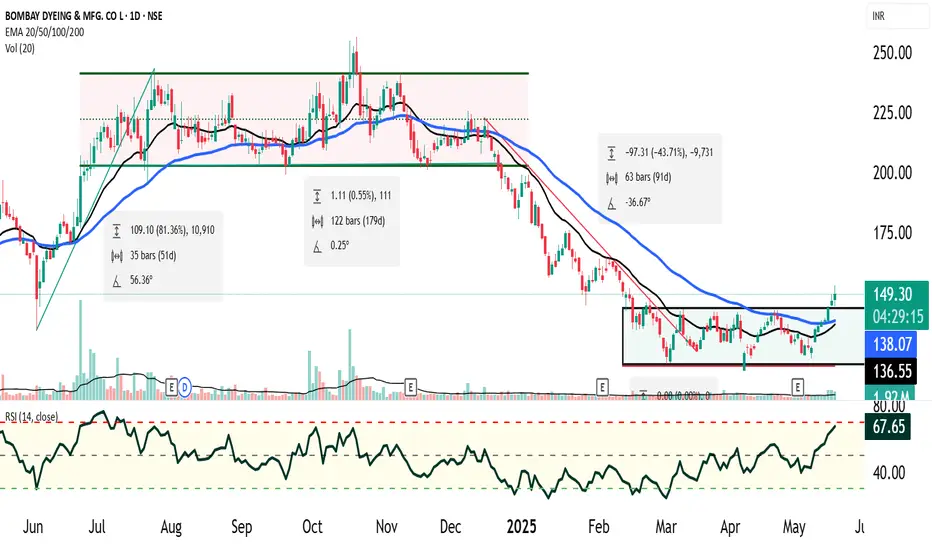
Bombay Dyeing : Market Cycle Recap✅ 1. Markup Phase (4 June 2024 – 25 July 2024)
Price movement: ~80% rally.
1. RSI behavior: RSI stayed above neutral (never oversold), frequently nearing overbought.
2. Volume: Increasing — confirmation of strong upside momentum.
3. Participants: Smart money and institutions led the rally.
🚨 2. Distribution Phase (~6 Months)
Price action: Sideways movement in a 20% range
1. Volume: Likely choppy or decreasing, with spikes on down days — a classic distribution sign.
2. RSI: Range-bound between 40–60 — no trend, loss of momentum.
3. Participants: Institutions unloading to retail/inexperienced participants.
🔻 3. Markdown Phase
Breakdown: Support breached after distribution range.
1. Price movement: Dropped ~50% from support breakout.
2. RSI: Frequently oversold — sign of strong weakness.
3. Volume: Likely increased on down days — panic selling.
🧱 4. Accumulation Phase (Last 3 Months)
Price action: Consolidated in ~15% narrow range.
1. RSI: Did not touch oversold zone — indicates seller exhaustion.
2. Participants: Value investors, smart money slowly building positions.
3. Volume: Gradually increasing — early signs of interest.
🔔 Current Technical Signal (20 May 2025)
Breakout: Price has now closed above the resistance of the accumulation range.
Volume: Above-average — confirms breakout strength.
1. RSI: Approaching overbought zone — sign of bullish momentum returning.
2. Price is above 20 EMA and 50 EMA.
3. Expected bullish crossover or confirmation already happened.
📊 Interpretation: Strong Bullish Reversal in Progress
Smart money has likely finished accumulating. Breakout from the accumulation zone with volume, RSI trend, and moving average confirmations all suggest the early stage of a new markup phase is starting. This could be the start of a fresh uptrend or the first leg of a longer bullish swing, especially if:
Broader market supports cyclical or value stocks.
Company-specific fundamentals (earnings, business outlook) align with technical cues.
✅ Actionable Steps (Not Financial Advice)
Entry:
Traders: Consider entry near breakout retest (if occurs).
Investors: Start building position gradually if long-term reversal is confirmed.
Risk Management:
Stop-loss: Just below the accumulation range (tight) or recent swing low (looser).
Position sizing based on volatility and risk appetite.
Targets:
Near-term: 15–20% move based on accumulation range height.
Medium-term: 50–80% potential if this is a true markup phase (mirroring last cycle).
Confirmation Factors:
Look for increasing volume in subsequent up candles.
Weekly close above breakout zone.
Fundamental support (news, earnings upgrade, insider buying, etc.).
If you'd like, I can also:
Draw a price cycle chart based on your description.
Help you draft a trade plan or investment thesis.
Pull recent news or updates on Bombay Dyeing (using live data).
Let me know how you'd like to proceed!
ONWARD TECHNOLOGIES LTD📊 ONWARD TECHNOLOGIES LTD (1D) – CMP ₹313.00
📅 Published on: May 17, 2025
📈 Exchange: NSE
📌 Ticker: ONWARDTEC
🔍 Technical Chart Analysis
✅ Trendline Breakout:
A clean downtrend line breakout is visible on the daily chart, marking the end of a prolonged bearish phase. Price has decisively broken above the falling resistance trendline with a sharp bullish candle and strong volume confirmation.
✅ Volume Surge:
Breakout occurred with a 17.76% gain and significantly higher volume (1.23M), hinting at strong buying interest and possible institutional accumulation.
✅ Fibonacci Retracement Zones (from swing high ₹731.00 to low ₹207.30):
38.2% – ₹407.40
50.0% – ₹469.20
61.8% – ₹531.00
78.6% – ₹618.95
100% – ₹731.00
✅ Support Confirmation:
The price held the multi-year support zone around ₹207.97, which aligns with the 0.00% Fibo level, forming a strong base for reversal.
🧱 Key Support & Resistance Levels
🟩 Support Zones:
₹207.97 (Major long-term support)
₹265–270 (Breakout retest zone if pullback happens)
🟥 Resistance Zones (Fibonacci-based):
₹407.40 (38.2% FIB)
₹469.20 (50.0% FIB)
₹531.00 (61.8% FIB - Golden Ratio)
₹618.95
₹731.00 (Previous ATH)
📉 Timeframe: Daily (1D)
📈 Sentiment: Turning Bullish
💡 Conclusion:
After a long correction, ONWARDTEC has shown a breakout with strong volume from a downtrend line. Holding above ₹300 levels can open room for targets near ₹407–₹469 and beyond. A good setup for swing traders looking for reversal entries.
📌 Disclaimer:
This analysis is for educational and informational purposes only. Not financial advice. Please consult your advisor before making investment decisions.

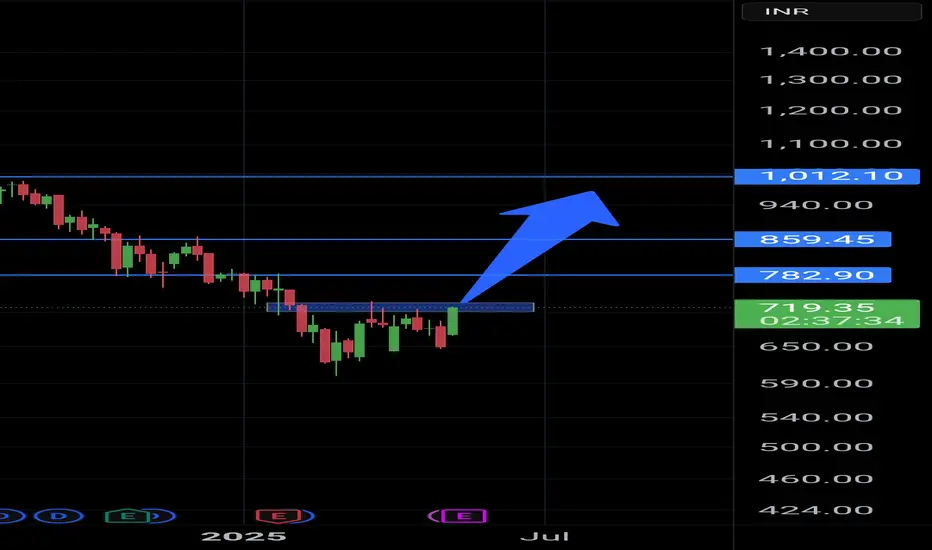
CONCOR IDEAIndian equities are picking up momentum. One of the stock I identify is CONCOR for which chart looks bullinsh to atleast score the target near 1000. For trading it can test levels marked with lines retest show breakouts.
ECLERX | Ideal Retracement Zone Identified📉 White Lines — Multiple DTF trendlines, including the key falling counter-trendline (CT), were decisively broken. The breakout marks the end of a strong downward structure with excellent follow-through.
🟧 Orange Line — Major Monthly Time Frame (MTF) resistance lies just overhead.
🔍 Breakout Candle:
Exceptionally strong with a close near high.
Backed by 1.83M volume, showing strong institutional interest.
Pattern size is large — adding weight to the structural reversal.
⚠️ Caution: A large portion of the move seems to have already played out within one candle. Chasing here risks poor R:R due to limited space before overhead resistance.
📐 Strategy Setup:
Fibonacci Retracement plotted on the breakout candle.
Ideal entry zone highlighted in green between the 0.382 to 0.5 levels
This zone represents a healthy and probable pullback area, offering better risk-reward alignment for potential continuation.
🧭 Trade Idea: Avoid chasing. Instead, watch for a retracement to the green zone. If price reacts positively there, it could offer a technically strong R:R opportunity while staying aligned with the broader breakout narrative.

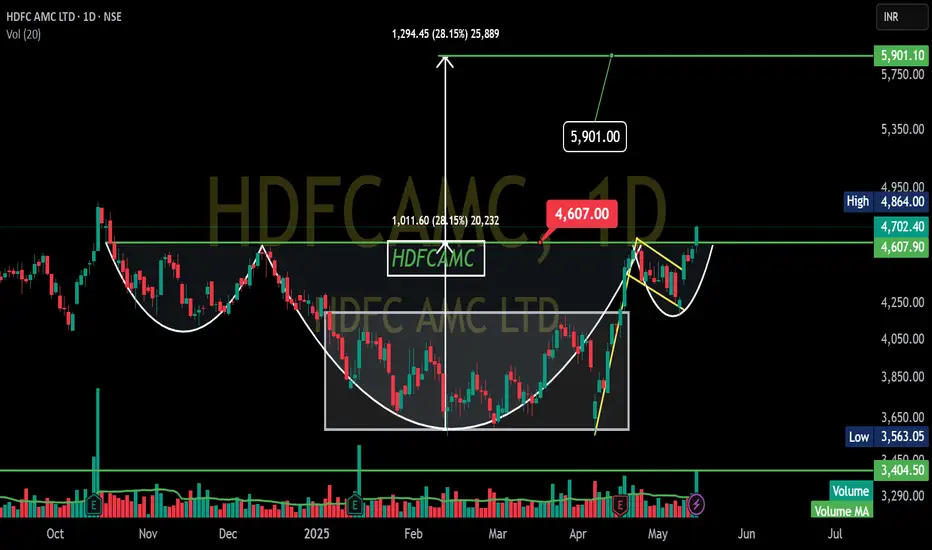
HDFCAMC - Inverted head and shoulder - Breakouttechnical analysis of the HDFC AMC LTD chart you've shared.
Looking at the price action, potential Inverted head and should pattern forming, which is generally considered a bullish sign.
Here's a simplified breakdown:
Head: Notice the rounded bottom shape that formed roughly between Dec 2024 and early April 2025. This suggests a period of consolidation before a potential upward move.
Handle: After reaching a high around ₹4,607, the price has pulled back and is now consolidating in a smaller downward sloping channel (highlighted by the yellow lines). This pullback is forming the "handle" of the pattern.
Breakout Level: The horizontal line you've drawn around ₹4,705 acts as a resistance or neckline. A sustained break above this level could signal the completion of the cup and handle pattern.
Target: Potential target around ₹5,901. This target is often estimated by measuring the depth of the head and adding it to the breakout level.
In simple terms:
The stock price went down, formed a rounded bottom (the head), then went up and is now taking a small dip (the handle). If it breaks above the ₹4,700 level, it might head towards the ₹5,901 area.
Overall, this chart suggests a potential upward move for HDFC AMC if the cup and handle pattern is confirmed with a breakout above ₹4,700.
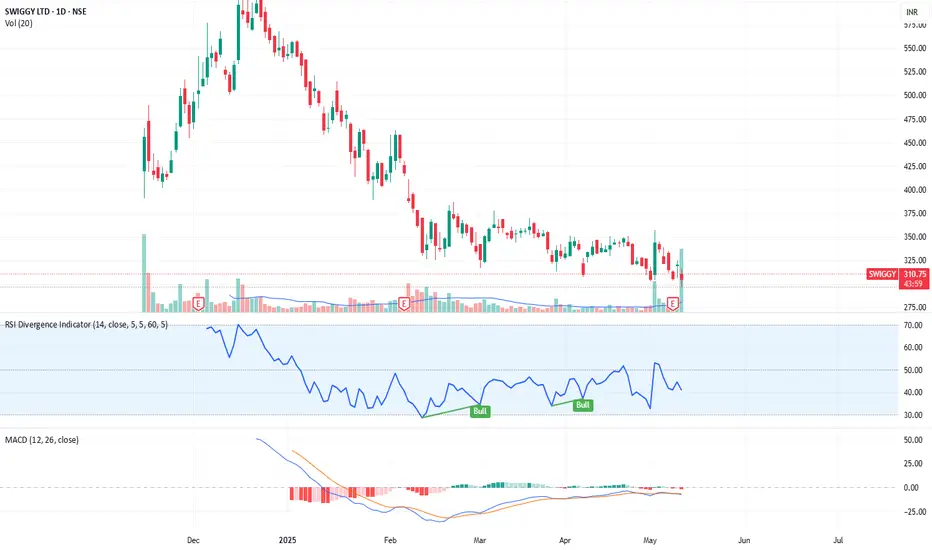
Swiggy is almost there to deliver foodVolume Analysis:
Significant spike in volume:
Today’s volume: 91.97M, compared to the 20-day average of 14.1M – a huge surge.
This spike suggests strong institutional activity or a possible reversal attempt.
Combined with the bullish candle, this implies accumulation at lower levels.
Do your own study and analysis then trade. its only for study or analysis purpose not recommendation to buy. keep in watchlist.
Gold (XAU/USD) 1-Hour Chart: Potential Bullish Reversal SetupOverview:
The market has recently shown a change of character (ChoCh), indicating a shift from a bearish to a potential bullish trend. After reaching key support levels, gold has started to consolidate, and we could be seeing the start of an upward movement.
Key Levels to Watch:
Support Zone: The price has bounced off the support at 3,222.38, which aligns with the 50% Fibonacci retracement.
Resistance Zone: The key resistance is at 3,294.87, which may act as a strong level for profit-taking if the price continues its upward move.
Potential Entry:
Buy Entry: Look for an entry around the current price of 3,240.40, after the price breaks through minor resistance or retraces slightly for confirmation.
Stop Loss: Set your stop loss at 3,222.38 (the recent swing low) for a controlled risk.
Take Profit: Aiming for the next resistance zone at 3,290.00 or 3,300.00.
Risk-to-Reward:
With a stop loss set at 3,222.38 and a take-profit target of 3,290.00, the trade offers a favorable risk-to-reward ratio of 1:2.
Market Sentiment:
The recent change of character suggests that the market may be reversing, so a bullish trend continuation is expected.
Keep an eye on volume and price action to confirm the breakout and ensure the setup is valid.
Trade Management:
Watch for any signs of a breakout at 3,294.87, as it would confirm the uptrend. Adjust your stops if the price moves in your favor.

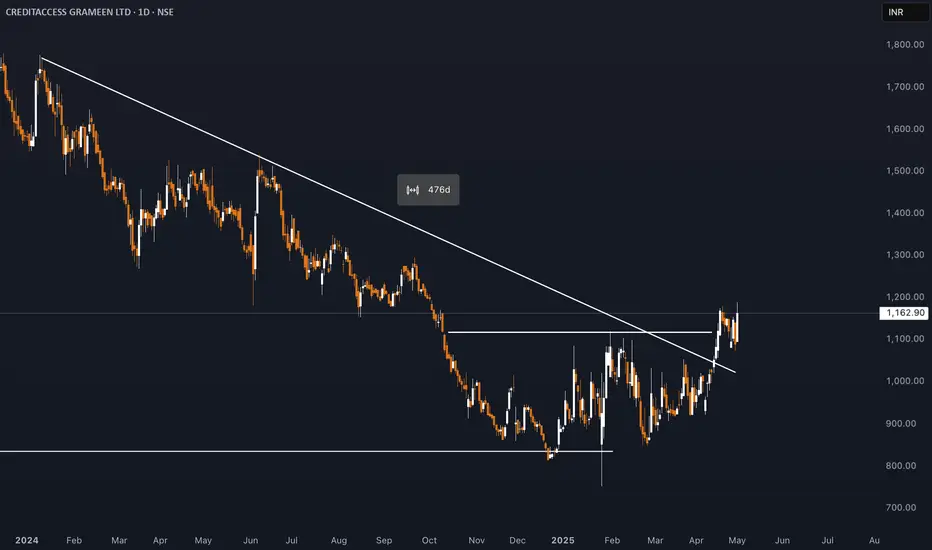
## CreditAccess Grameen (CREDITACC) Share Price Analysis- As of May 2, 2025, CreditAccess Grameen (CREDITACC) traded around ₹1,121–₹1,145, which is approximately 52% above its 52-week low of ₹750.20 (set in January 2025), but below its 52-week high of ₹1,551.95 (set in June 2024) .
- The stock has shown volatility over the past year, with a notable decline from its peak, reflecting both sector trends and company-specific events .
**Valuation and Financial Metrics**
- **P/E Ratio (TTM):** 20.3–21.2, indicating moderate valuation relative to earnings .
- **Book Value:** ₹438 per share, with the stock trading at about 2.6 times book value, which is considered on the higher side for the sector .
- **Dividend Yield:** Around 0.86–0.89%, with recent dividend payouts .
- **Return on Equity (ROE):** 24.8% (latest year), reflecting strong profitability .
- **Return on Capital Employed (ROCE):** 14.8% .
**Growth and Profitability**
- The company has delivered robust profit growth (35% CAGR over the last 5 years) and strong median sales growth (31.6% over 10 years)
- However, profit growth has turned negative in the trailing twelve months (-35%), primarily due to higher provisioning and write-offs in recent quarters
- The company reported a loss of ₹99.5 crore in Q3 FY25, mainly due to early risk recognition, conservative provisioning, and accelerated write-offs, but management expects this to safeguard future profitability as growth normalizes
**Operational Highlights**
- **Assets Under Management (AUM):** Grew by 6.1% YoY to ₹24,810 crore in Q3 FY25
- **Borrower Base:** Increased by 2.4% YoY to 48.05 lakh customers
- **Branch Network:** Expanded by 8.7% YoY to 2,059 branches
- **Collection Efficiency:** Remained robust at 93.3% (excluding arrears) and 94.1% (including arrears), with improving trends
- **Asset Quality:** PAR 90+ at 2.64%, NNPA at 1.28%, indicating some stress but manageable levels
- **Capital Adequacy:** CRAR at 25.9%, reflecting a strong capital position
**Strengths and Risks**
**Strengths:**
- Consistent long-term growth in profits and sales
- Strong capital position and liquidity buffer
- High collection efficiency and expanding branch network
**Risks/Concerns:**
- Recent decline in promoter holding (-7.42% over three years)
- Low interest coverage ratio, suggesting higher financial risk
- Elevated provisioning and write-offs impacting near-term profitability
- Stock is trading at a premium to book value, which may limit upside if growth slows
**Relative Performance**
- Over the past year, the stock is down 24%, underperforming the broader market, but over five years, it has delivered a 154% return, broadly in line with sector peers
- In the short term (last three months), the stock has rebounded by about 13% from its lows
## Summary
CreditAccess Grameen remains a leading NBFC-MFI with a strong track record of growth and profitability. While recent quarters have seen a dip in profits due to prudent risk management and provisioning, the company’s fundamentals-such as robust capital adequacy, liquidity, and operational scale-remain intact. The stock is moderately valued but carries risks related to asset quality and sector volatility. Investors should watch for normalization of growth and profitability in upcoming quarters, as indicated by management
ERIS Lifesciences Share Price AnalysisEris Lifesciences is currently trading in the range of ₹1,371 to ₹1,474, with the latest reported price at ₹1,474.20 as of April 23, 2025. The stock has shown strong performance over the past year, delivering a return of approximately 57%. Over the last three months, the stock is up about 9%, though it has seen a slight dip of 0.57% in the past month.
**Valuation and Fundamentals**
Eris Lifesciences trades at a price-to-earnings (P/E) ratio of 57.13, which is high for the sector, and a price-to-book (P/B) ratio of 4.53. The company’s earnings per share (EPS) stands at 29.19, and its return on equity (ROE) is 12.63%, indicating moderate profitability. The market capitalization is approximately ₹18,831 crore . The dividend yield is negligible, suggesting the company focuses more on growth than on returning cash to shareholders.
**Analyst Sentiment and Targets**
Analyst sentiment is strongly positive, with nearly 89% recommending a buy and the remainder suggesting hold; there are no sell recommendations. The average long-term price target from analysts is ₹1,512.56, indicating modest upside from current levels.
**Technical and Trading Overview**
The stock has recently traded near its upper circuit of ₹1,659.60, with a lower circuit at ₹1,106.40, reflecting a relatively wide trading band and potential for volatility. Recent trading volumes have been healthy, supporting the current price momentum.
**Summary**
Eris Lifesciences has delivered strong returns over the past year and is viewed positively by analysts. However, its high P/E ratio suggests the stock is priced for continued growth, and the lack of dividend yield may not appeal to income-focused investors. The technical outlook is stable, with the stock trading near its highs and supported by robust trading activity.

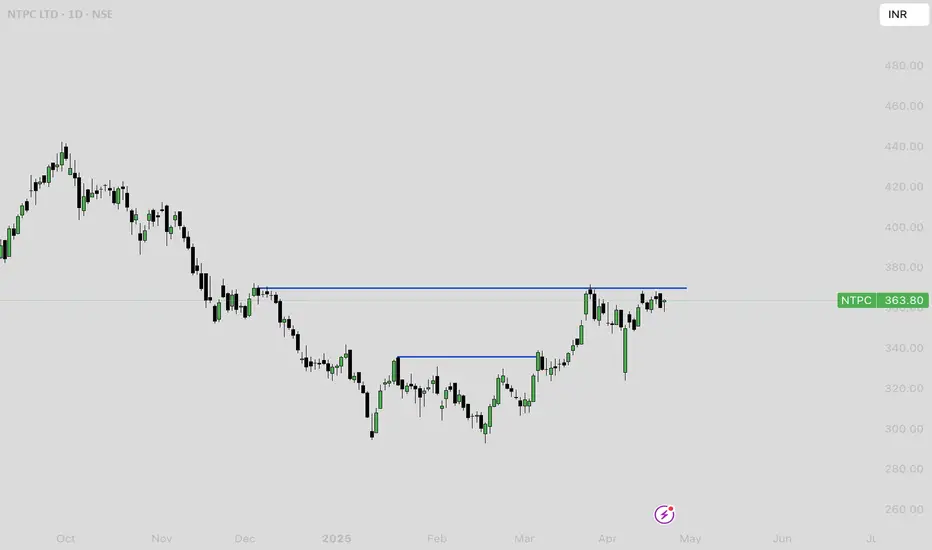
NTPC price analysisNTPC is currently trading around ₹360, having shown a modest gain of about 4% over the past year. The stock reached its all-time high of ₹448.45 in September 2024 and has since pulled back, with recent price action reflecting some consolidation after a strong multi-year rally . Over the last month, NTPC has delivered a positive return of approximately 2.5%, indicating some short-term strength despite a slight decline of nearly 1.8% in the past week.
Fundamentally, NTPC remains a large-cap, stable utility with a market capitalization near ₹3.5 lakh crore and a price-to-earnings (PE) ratio of about 15.9, which is below the industry average, suggesting reasonable valuation. The company boasts a healthy dividend yield of 2.5%, and its return on equity (ROE) stands at 13.1%. Promoter holding remains steady at 51.1%, and the company continues to report strong profits, with net profit for the latest fiscal year exceeding ₹20,000 crore.
Analyst sentiment is generally positive, with some brokerages forecasting up to 35% further upside from current levels and price targets ranging between ₹305 and ₹500 for 2025.
Technical indicators and historical trends show NTPC often delivers positive returns in April, with an average gain of about 3% for the month
In summary, NTPC is viewed as a fundamentally sound, dividend-paying stock with moderate growth prospects and reasonable valuation. While the stock is off its recent highs, the outlook remains constructive, supported by positive earnings, stable fundamentals, and favorable long-term forecasts from analysts
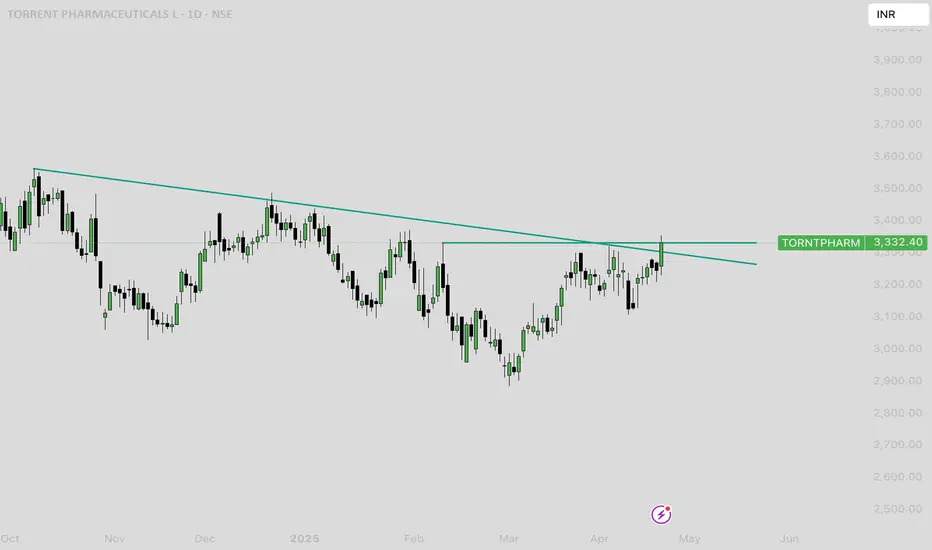
## TORNTPHARM Price AnalysisTorrent Pharmaceuticals (TORNTPHARM) is currently trading near ₹3,254, maintaining a strong uptrend over the past several years. The stock has delivered a return of approximately 165% from July 2020 to November 2024, including a stock split, highlighting its consistent long-term growth.
**Valuation and Fair Value**
TORNTPHARM is trading well above its estimated intrinsic value. Independent valuations suggest a fair value in the range of ₹1,560 to ₹1,940 per share, meaning the current market price is overvalued by about 40%. The price-to-earnings (PE) ratio stands at approximately 59–66, which is significantly higher than the sector average of around 49, indicating a premium valuation. The price-to-book (PB) ratio is also elevated at 16, compared to the sector average of 6.29.
**Recent Performance**
The stock has shown positive momentum in the short term, with returns of 3.5% over the past week and 5.7% over the past month. Over the last year, TORNTPHARM has gained nearly 28%, and over three years, the return is more than 128%. Despite some volatility, the stock has outperformed many of its peers and the broader market.
**Fundamental Trends**
Torrent Pharma’s India business, which constitutes the bulk of its revenue, grew by 12% in Q3 FY25, driven by strong performance in branded generics. However, the company faces challenges in international markets, particularly the US, due to regulatory headwinds and pricing pressures. Revenue growth over the past five years has averaged 7% annually, slightly below the industry average, but net income growth has been robust at over 30% per year, outpacing peers.
**Analyst Outlook**
Analysts have a moderately positive outlook, with a one-year price target averaging around ₹3,600, and a range between ₹2,959 and ₹4,200 . About 68% of analysts currently rate the stock as a buy.
**Dividend and Market Cap**
The dividend yield is 0.86%, which is above the sector average, and the company’s market capitalization is approximately ₹1.1 lakh crore, placing it among the larger players in the Indian pharmaceutical sector.
**Summary**
TORNTPHARM has demonstrated strong long-term price appreciation and profitability, but it is currently trading at a significant premium to its estimated intrinsic value. Short-term technicals are mixed, with some bullish undertones, but caution is warranted due to high valuation multiples. The company’s growth is primarily driven by its domestic business, while international operations face ongoing challenges. Analyst sentiment remains positive, but the upside may be limited unless earnings growth accelerates or valuation multiples contract.
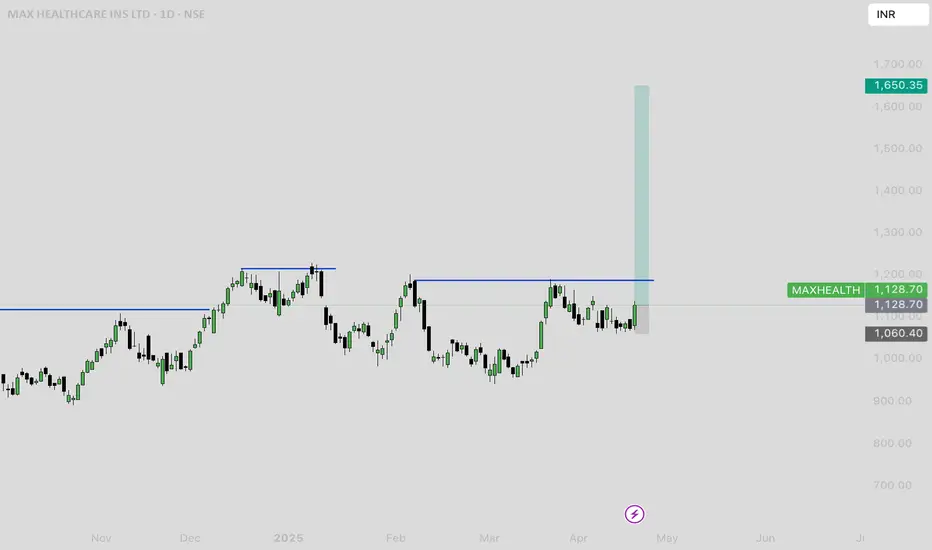
MAXHEALTH Price Chart Analysis**Current Price and Recent Performance**
- As of the latest available data, Max Healthcare Institute Ltd (MAXHEALTH) is trading around ₹1,084.40, showing a 0.64% increase in the past 24 hours
- The stock hit a high of ₹1,095.00 and a low of ₹1,066.50 in the most recent trading session, with an average traded price of ₹1,075.13
- Over the past week, the stock is down by 0.97%, but it has risen 8.23% over the past month and 30.78% over the last year
**Historical Price Levels**
- MAXHEALTH reached its all-time high of ₹1,227.95 on January 8, 2025
- The all-time low was ₹97.15, recorded on November 12, 2020
**Analyst Forecasts and Valuation**
- Analyst price targets range from a minimum of ₹615.00 to a maximum of ₹1,390.00
- The stock is trading at a price-to-earnings (PE) ratio of 100.12 and a price-to-book (PB) ratio of 12.59, which is higher than the sector averages (sector PE: 47.87, sector PB: 6.12)
- Dividend yield is low at 0.14%
**Technical and Volatility Insights**
- MAXHEALTH is 2.61 times as volatile as the Nifty index, indicating higher price swings.
- The 50-day moving average (DMA) is at ₹1,062, suggesting the current price is above this technical support level.
MAXHEALTH's valuation is high compared to peers, reflecting strong investor expectations
**Fundamental Performance**
- Revenue has grown at a compound annual rate of 27.47% over the last five years, outpacing the industry average of 10.01%
- Net profit for FY 2023-24 was ₹687 crore, with a slight decline of 1.02% compared to the previous year, despite a 22.93% rise in revenue.
- Promoter and institutional holdings have remained stable in recent quarters
**Summary**
MAXHEALTH has demonstrated robust long-term price appreciation and revenue growth, with a recent pullback from its all-time high. The stock trades at a premium valuation relative to sector peers, reflecting high growth expectations. Technicals show the stock is above key moving averages, and volatility remains elevated. Analyst targets suggest a broad range of possible outcomes, with the consensus leaning toward further upside, but caution is warranted due to the high valuation and recent profit stagnation