Piramal Pharma (PPLPHARMA) Stock Price Analysis**Piramal Pharma (PPLPHARMA) Indian Stock Price Analysis – April 22, 2025**
- **Current Price:** ₹220.70 (as of April 21, 2025)
- **Short-Term Trend:** Sideways to weak. The stock has been volatile, trading mostly between ₹217 and ₹225 in recent sessions
- **Recent Performance:**
- 1 week: +1.86%
- 1 month: +6.36%
- 3 months: –4.46%
- 1 year: +55.38%
- **Moving Averages:** The stock is above its 50-day moving average but below the 5-day, 20-day, 100-day, and 200-day moving averages, indicating mixed momentum and some weakness in the short term
- **Support:** ₹217
- **Resistance:** ₹225–₹231
- **Volatility:** High; the stock is 3.27x as volatile as the Nifty
- **Sector Comparison:** Underperforming its sector in the short term, but strong annual gains
- **Analyst View:** Mixed; some analysts suggest buying for the long term, but caution is warranted in the short term due to recent weakness
**Summary:**
PPLPHARMA has shown strong gains over the past year but is currently consolidating with a slight bearish bias. The price is range-bound, with support at ₹217 and resistance around ₹225–₹231. Watch for a breakout above resistance for renewed bullish momentum, or a drop below support for further downside risk
Bullishsetup

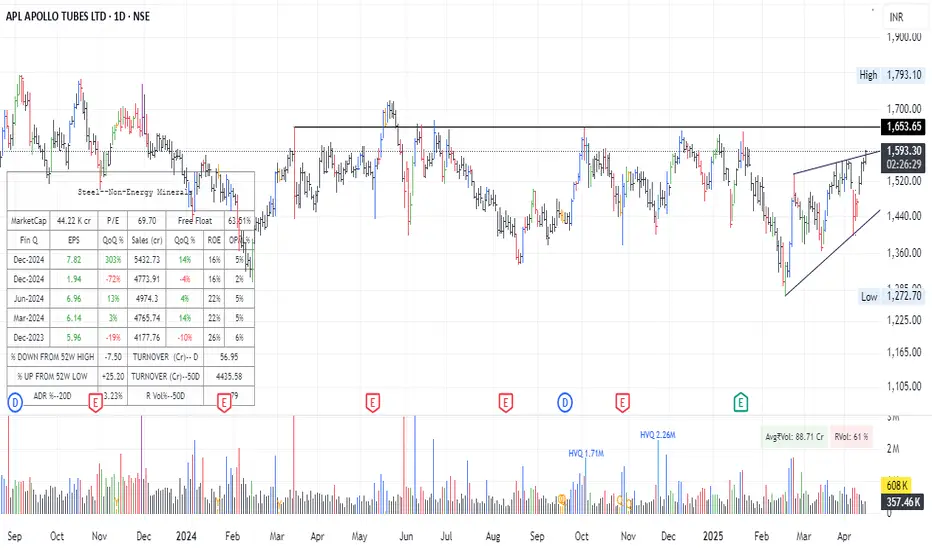
Apl Apollo Tube - ReRating Candidate !!??Stock peaked in Sep 2023.. Has been Range bound since almost 2 yrs now.. Interestingly had the best quarter ever last qtr.. Margins are stable and constant through many months.. If margins expand we are looking at a re-rating candidate.. Over all looking very interesting..
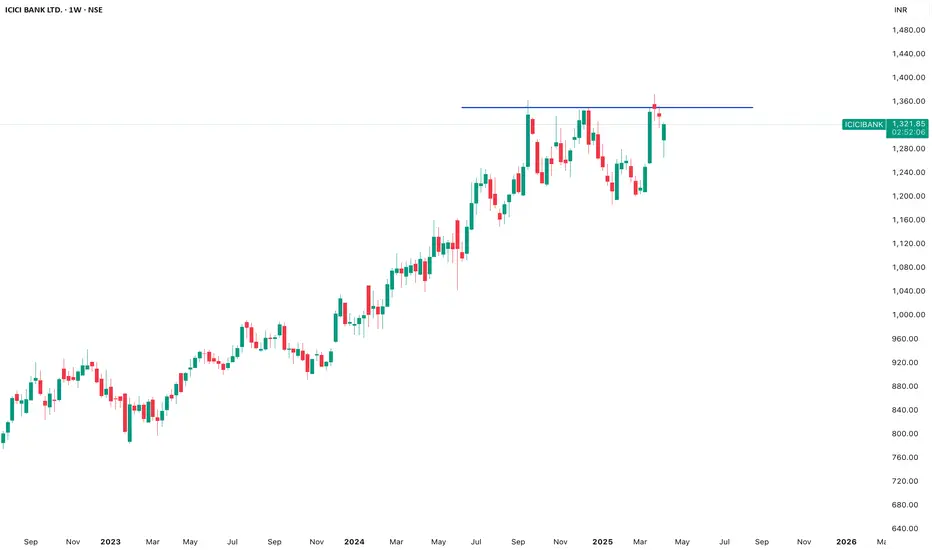
### ICICI Bank Price Analysis (April 11, 2025)### ICICI Bank Price Analysis (April 11, 2025)
#### **Current Price and Recent Trends**
- **Latest Price (April 8, 2025):** ₹1,299.90
- **Intraday Movement (April 8, 2025):**
- **Open:** ₹1,299.85
- **High:** ₹1,310.05
- **Low:** ₹1,287.35
- **Close:** ₹1,299.90 (+0.96% from the previous close).
- **52-Week Range:** ₹1,186.00 – ₹1,373.00
#### **Performance Metrics**
- **Short-Term Trends:**
- April 7, 2025: Declined by -3.58% to ₹1,287.55.
- April 4, 2025: Rose by +0.43% to ₹1,335.30.
- **Medium-Term Trends:**
- March saw fluctuations between ₹1,311 and ₹1,373.
- **Long-Term Trends:**
- ICICI Bank has shown consistent growth over the past year, supported by strong fundamentals.
#### **Fundamental Insights**
- ICICI Bank remains one of the top-performing private sector banks in India:
- **Market Cap:** Over ₹9 lakh crore.
- **P/E Ratio:** Competitive compared to peers in the banking sector.
- **Strong Asset Quality:** Stable NPA ratios and robust loan growth.
#### **Technical Analysis**
- **Support Levels:** ₹1,287 (recent low) and ₹1,265 (strong support from April trends).
- **Resistance Levels:** ₹1,310–₹1,320 (near-term resistance).
- **Moving Averages:**
- Trading slightly below the SMA20 but above SMA50 indicates potential consolidation before further movement.
- **Momentum Indicators:**
- RSI suggests neutral momentum with room for upward movement if market sentiment improves.
#### **Sector Outlook**
The banking sector is expected to benefit from:
- Increased credit growth due to economic recovery.
- Stable interest rate environment supporting profitability.
#### **Strengths**
1. Consistent performance despite market volatility.
2. Strong fundamentals with diversified revenue streams.
3. Resilient asset quality and loan book growth.
#### **Weaknesses**
1. Short-term volatility due to global banking uncertainties.
2. Resistance near ₹1,310 may limit upside in the immediate term.
### Conclusion:
ICICI Bank remains a strong long-term investment option due to its robust fundamentals and leadership in the private banking space. However, short-term traders should monitor resistance levels around ₹1,310 and support near ₹1,287 for trading opportunities.
### Bajaj Finance Price Analysis (April 11, 2025)### Bajaj Finance Price Analysis (April 11, 2025)
#### **Current Price and Recent Trends**
- **Latest Price:** ₹8,727.10 (as of April 9, 2025)
- **Intraday Movement (April 4, 2025):**
- **Open:** ₹8,656.00
- **High:** ₹8,797.00
- **Low:** ₹8,583.80
- **Close:** ₹8,718.85
- **52-Week Range:** ₹6,500 – ₹9,974
#### **Performance Metrics**
- **Short-Term Returns:**
- Past Week: -4.48%
- Past Month: +0.85%
- **Medium-Term Returns:**
- Past 3 Months: +17.71%
- Past 6 Months: +20.90%
- **Long-Term Returns:**
- Past Year: +19.71%
- Past 5 Years: +286.93%
#### **Fundamental Insights**
- **Market Cap:** ₹543,171 crore
- **P/E Ratio:** 33.85 (TTM)
- **Dividend Yield:** 0.42%
- **ROCE (Return on Capital Employed):** 11.14%
- **Assets Under Management (AUM):** Grew by 26% YoY to ₹416,750 crore as of March 31, 2025
#### **Sector and Peer Comparison**
- Bajaj Finance is the top performer in the financial services sector with a robust YTD return of +29% as of April 8, 2025
- Peers like SBI Cards (+27%) and Aavas Financiers (+24%) also showed strong growth due to prudent asset management and loan growth
#### **Technical Indicators**
- **Moving Averages:**
- Price is above the SMA20 (₹8,651), indicating bullish momentum .
- **Bollinger Bands:**
- Upper Band: ₹9,149
- Lower Band: ₹8,153
- The stock is trading near the upper range of Bollinger Bands, suggesting potential resistance at higher levels .
- **Momentum Indicators:**
- RSI: BUY signal with strong momentum.
- MACD: BUY signal for short-term gains.
- **Volume Analysis:** High trading volume indicates strong investor interest but also suggests selling pressure building up in the short term .
#### **Strengths**
1. Strong revenue growth driven by a diversified lending portfolio across retail, SME, and commercial customers.
2. Robust YTD returns (+29%), outperforming peers and sector indices .
3. Consistent growth in AUM (+26% YoY) and deposits (+19% YoY) .
#### **Weaknesses**
1. High P/E ratio (33.85) suggests overvaluation compared to historical averages and peers.
2. Short-term price volatility (-4.48% in the past week) indicates potential consolidation or correction.
#### **Outlook and Forecast**
- Analysts expect continued growth driven by strong customer additions (+4.7 million in Q4 FY25) and increased loan disbursements.
- Resistance levels are near ₹9,000–₹9,100; support levels are around ₹8,600–₹8,700.
- Long-term investors may benefit from holding due to consistent performance and robust fundamentals.
### Conclusion:
Bajaj Finance remains a leader in the financial services sector with strong growth metrics and solid fundamentals. However, its high valuation and recent price volatility suggest caution for short-term traders while offering long-term potential for investors focused on consistent returns and sector leadership.

### Bharti Airtel Price Analysis (April 11, 2025)### Bharti Airtel Price Analysis (April 11, 2025)
#### **Current Price and Recent Trends**
- **Latest Price:** ₹1,715.55 (as of April 9, 2025).
- **Intraday Movement (April 9, 2025):**
- **Open:** ₹1,719.65
- **High:** ₹1,726.85
- **Low:** ₹1,711.60
- **Average Price:** ₹1,717.90
- **Previous Close:** ₹1,720.40 (-0.29% change).
#### **Performance Metrics**
- **Short-Term Trends:**
- Last 3 months: Price increased by **6.17%**.
- **Long-Term Trends:**
- Last 12 months: Price grew by **39.54%**.
- Over the last 3 years: Stock delivered a return of **125.11%**, outperforming the BSE Telecommunications index (+37.96%).
#### **Fundamental Insights**
- **Market Cap:** ₹9,80,990 crore.
- **P/E Ratio:** 50.50 (high compared to industry standards).
- **ROCE (Return on Capital Employed):** 11.55%.
- **Revenue Growth:** QoQ revenue growth of **9.28%**, highest in three years.
- **ARPU Growth:** Driven by premiumization and higher tariff plans post-July 2024 hikes.
#### **Technical Analysis**
- The stock is currently moving sideways based on recent intraday trends.
- Resistance levels could be around ₹1,726–₹1,730, while support levels are near ₹1,710.
#### **Sector Outlook**
- Analysts expect moderate growth in Q4FY25 for telecom companies due to stabilizing tariff hike impacts and fewer days in the quarter.
- Airtel is projected to see an increase in India revenue by **8.7% QoQ** and EBITDA growth of **0.1% QoQ**.
#### **Strengths**
1. Strong long-term returns outperforming peers and sector indices.
2. Revenue growth driven by ARPU increases and premiumization.
3. Stable user additions (~3–4 million expected in Q4FY25).
#### **Weaknesses**
1. High P/E ratio suggests overvaluation compared to peers.
2. Sideways price movement indicates limited short-term momentum.
### Conclusion:
Bharti Airtel remains a strong performer with robust long-term growth potential driven by tariff hikes and premiumization strategies. However, its high valuation may limit upside in the short term. Investors should monitor Q4FY25 results for further insights into revenue and subscriber trends.

GOLD - BULLISH STRUCTURE INTACT II Trump's tariff plansFundamental Key points:
⚡Gold hangs near record high on safe-haven flows
⚡Currency market muted ahead of reciprocal tariffs
⚡Investors brace for Trump's levies
🔎 Technical Analysis:
Key Observations:
1. Market Structure:
o The price is in an uptrend overall, following a parallel channel (1H chart).
o Short-term retracement after testing a resistance level (~$3,138 - $3,149).
2. Support & Resistance Levels:
o Resistance Levels (Sell Zone):
$3,138.87 → Previous high/resistance.
$3,149.05 → Major resistance, potential reversal zone.
o Support Levels (Buy Zone):
$3,122.61 - $3,114.86 (Order Block - OB) → Strong demand zone.
$3,100.93 → Strong support level, potential bounce area.
$3,065.23 - $3,058.33 → Major support on the 1H chart.
3. POI (Point of Interest) Level:
o The price is currently at the POI level (~$3,130-$3,132), which is acting as a temporary resistance.
4. Moving Averages & Trend Confirmation:
o 50 EMA (Red Line) on 1H chart is acting as support (~$3,114).
o 200 EMA (Blue Line) below, confirming a strong bullish trend.
________________________________________
Trade Plan:
🔹 Buy (Long) Setups:
1. Entry Zone:
o $3,122 - $3,114 (OB Zone)
o $3,100 - $3,110 (Major Support)
o $3,065 - $3,058 (Strong Support, 1H Chart)
2. ⭐ Confirmation:
o Price showing bullish rejection at support levels.
o 50 EMA Holding Support
3.🎯Target:
🎯TP1: $3,138
🎯TP2: $3,149
4. ❌Stop Loss (SL):
o Below $3,100 (to avoid deeper pullback risks).
________________________________________
🔹 Sell (Short) Setups:
1. ✔Entry Zone:
o $3,138 - $3,149 (Major Resistance Zone)
o If price struggles to break above $3,138 and shows reversal patterns, it’s a potential short.
2. 📌Confirmation:
o Rejection wicks at resistance
o Break below POI Level ($3,130)
3. Target:🎯
🎯 TP1: $3,122
🎯 TP2: $3,114
4. Stop Loss (SL):
o Above $3,150 (to avoid fake breakouts).
________________________________________
📢 Conclusion:
• Bullish Bias: Until price breaks below $3,114.
• Ideal Buy Zone: $3,122 - $3,114
• Sell Only Near Resistance: $3,138 - $3,149

### Maharashtra Seamless Ltd (MAHSEAMLES) Price Analysis
#### **Current Price and Trends**
- **Latest Price:** ₹704.55–₹736.85 (varies by source, reflecting intraday fluctuations)
- **52-Week Range:** ₹562.65 – ₹964.35
- **Market Cap:** ₹9,143–₹9,149 crore
#### **Recent Performance**
- **Q3 FY25 Results:**
- Revenue increased 2% YoY, driven by higher seamless pipe dispatches.
- Profit declined due to lower treasury returns
- **Order Book Stability:** ₹1,500–2,000 crore, supported by demand in oil/gas and manufacturing sectors
#### **Technical Outlook**
- **Risk Profile:** Moderate (2.72x volatility vs Nifty)
- **Entry Point:** Stock appears underpriced with P/B and P/E ratios below sector averages
#### **Strengths**
1. **Undervaluation:** P/E and P/B ratios are significantly lower than sector averages
2. **Dividend Consistency:** 1.47% yield, higher than sector average .
3. **Operational Resilience:** Stable order book and improved dispatches in Q3 FY25
#### **Weaknesses**
1. **Profit Decline:** PAT fell due to treasury returns and margin pressures
2. **Volatility:** Stock has seen significant price swings (52-week range: ~₹400 difference)
### Summary:
Maharashtra Seamless shows **value potential** with attractive valuation ratios and stable demand in core sectors. However, recent profit declines and market volatility warrant caution. Investors should monitor quarterly earnings (next announcement: April 29, 2025) and global commodity trends.

NIVA BUPA HEALTH (NSE: NIVA) – Breakout PotentialRight now, it is completing a descending triangle breakout, which is a bullish pattern.
The stock has been consolidating for the past 4 months in a tight range, building strength for a breakout.
All important levels have been marked on the chart.
Looking at the chart, we can say that if the price breaks to the upside, there is a high probability that the stock will reach the ₹98.63 target.
For the past few days, volume has also been quite good. If we enter the stock at ₹76.66, we can achieve the target with
Risk: Reward :: 1 : 2.49
Support Levels:
🔹 ₹72.44 – Strong support zone
🔹 ₹70.11 – Previous low acting as support
🔹 ₹69.21 – Secondary support in case of a pullback
Resistance Levels:
🔹 ₹76.66 – Immediate breakout level
🔹 ₹85.35 – Previous high acting as resistance
🔹 ₹98.63 – Final target zone
Reasons:
✅ Consolidation for 4 months, leading to a strong breakout setup
✅ Descending Triangle Breakout
✅ Support at ₹72.44 holding strong
✅ Wait for RSI to cross 60 for confirmation
✅ First breakout attempt after listing drop
✅ High volume surge, indicating strong buying interest
✅ Price > 50 EMA and approaching trendline resistance
Verdict:
Bullish
Plan of Action:
Enter once the breakout is confirmed to the upside.
BUY: ₹76.66
Stoploss: ₹72.44
Target: ₹98.63
Trailing SL: ₹5–₹8 once price crosses ₹85

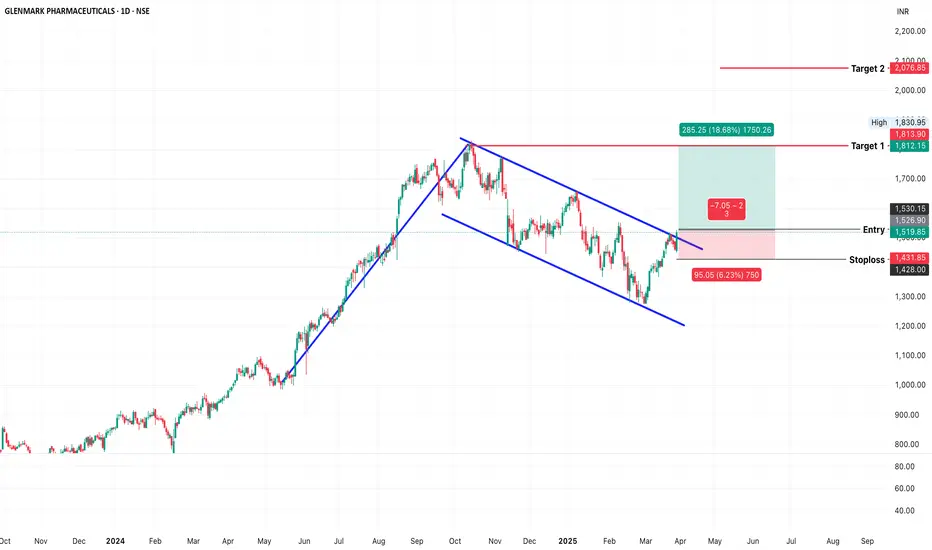
GLENMARK PHARMA (NSE: GLENMARK) – Confirmed Channel BreakoutGlenmark Pharma has confirmed a breakout from a falling wedge and flag & pole pattern , supported by strong volume and a bounce from the 200 EMA . Price structure and momentum suggest bullish continuation.
Key Observations:
Pattern Formation: Falling wedge + flag & pole since September 2024
Breakout Confirmation: Closed above upper trendline at ₹1,519.85 on March 27, 2025
200 EMA Support: Price took support at 200 EMA and reclaimed both key moving averages
Volume Spike: High volume on breakout candle validates the move
Support & Resistance Levels:
Immediate Support: ₹1,432
Breakout Level (Entry): ₹1,520
Target 1: ₹1,813
Target 2: ₹2,076
Major Resistance: ₹2,100
Indicators & Risk-Reward:
✅ RSI: 64.92 – showing strong bullish momentum
✅ Volume: Significant volume surge during breakout
✅ Risk-to-Reward: ~1:3 – ideal for swing setup
Verdict: Bullish
With pattern breakout, volume confirmation, and RSI strength, Glenmark is poised for a potential up-move.
Plan of Action:
BUY: ₹1,520
Stop Loss: ₹1,432
Target 1: ₹1,813
Target 2: ₹2,076
Trailing SL: Start trailing above ₹1,650 to protect profits
GOLD - BULLISH STRUCTURE INTACTSymbol - XAUUSD
CMP - 3018
Gold is currently undergoing a corrective phase, having broken through channel resistance and is now consolidating above the downtrend line. Market participants are awaiting key economic data and potential developments in the ongoing tariff dispute.
President Trump has confirmed plans to implement retaliatory tariffs on April 2, with limited exemptions. These new duties have raised concerns regarding the impact on the US economy, leading to a weakening of the US dollar and increased demand for gold. Additionally, market attention remains focused on ongoing discussions between the US, Ukraine, and Russia. There is also significant focus on US durable goods orders data, as a strong reading could temper expectations of a Federal Reserve rate cut, potentially limiting further gains in gold.
Resistance levels: 3033, 3045, 3056
Support levels: 3013, 3004
Gold may test the support zone before resuming its upward movement. Market attention is concentrated on the current consolidation range of 3033 to 3013. A decisive break of this zone could pave the way for further upward momentum, with key resistance levels at 3045 and 3056.

MAXHEALTH Price actionBased on the current technical analysis of Max Healthcare Institute Ltd (MAXHEALTH), the stock is showing mixed signals with a bullish bias:
## Price and Performance
As of March 19, 2025, MAXHEALTH is trading at ₹1,080.90, up 6.29% from its previous close . The stock has shown significant volatility in recent months:
- Day range: ₹980.35 - ₹1,001.45
- 52-week range: ₹719.45 - ₹1,227.95
- All-time range: ₹97.15 - ₹1,227.95
## Technical Indicators
- **RSI (14)**: 88.367, indicating overbought conditions
- **MACD**: 23.2, suggesting bullish momentum
- **ADX (14)**: 53.972, indicating a strong trend
- **Supertrend**: 1085.84, slightly above the current price
- **Parabolic SAR**: 942.81, well below the current price, suggesting an uptrend
## Moving Averages
All major moving averages (5, 10, 20, 50, 100, and 200-day) are showing buy signals for both simple and exponential calculations . This indicates strong bullish sentiment across different time frames.
## Volume Analysis
The latest trading volume is 152K, which is lower than the 5-period average volume of 455K . This suggests a potential decrease in trading activity.
## Market Sentiment
The overall technical analysis suggests a "Strong Buy" signal:
- Moving Averages: Strong Buy (12 buy signals, 0 sell signals)
- Technical Indicators: Strong Buy (6 buy signals, 0 sell signals)
## Outlook
MAXHEALTH is currently in a strong uptrend, with all major indicators pointing towards bullish momentum. However, the RSI and other oscillators indicate overbought conditions, which may lead to a short-term pullback or consolidation.
Investors should be cautious of potential resistance around the ₹1,085-1,090 levels. The stock has shown significant growth potential, with price targets for 2025 ranging from ₹1,064.46 to ₹1,420.39 . However, as with any investment, it's crucial to consider both technical and fundamental factors before making trading decisions.

Bulls are coming back | Which type of setups to trade ?I make educational content videos for swing / positional trading

SDBL - SOM DIST & BREW BY KRS Charts13th Feb / 10:22 AM
Why SDBL??
1. All over Bullish Stock currently in consolidation.
2. Yesterday shown Fake breakdown and suddenly bounce back means many Sellers orders got Triggered which was below that level.
3. Today moving Upside obviously for SL hunting of those sellers.
4. Stock will move upside more when price reaches green line on as we can see in Chart.
Expecting Upside move due to SL hunting in SDBL.

JINDAL SAW By KRS Charts5th March 2025 / 9:40 AM
Why JINDALSAW??
1. Fundamentals Strong, Technically Bullish Stock .
2. Wave Count is showing 4th Wave might finish with Flag patterns low in JAN 2025.
3. Multiple FVG is marked as we can see in Chart,
Upside Red Zone FVGs are already mitigated partially in case of upside further
targets will full mitigations of those zone. (Red Zones)
Another FVG is visible in Hourly TFs which denotes possible Reversal from current level.
(Blue Zone)
4. Morning Star is also loading if Today Closing near 245 Rs.
5. 2 Possible Ways I am expecting which marked with Dotted Arrows.
6. RSI - Above 40
MACD - Positive Crossover
Initially Target 280 Rs.

SOUTHBANK By KRS Charts2nd Jan 2025 / 1:05 PM
Why SOUTHBANK ❓
1. Fundamentally Stable Company ✅
2. Wave Count seems like 4th Wave is about to Finish. 👍
3. Currently taking support on 100 EMA 1W Timeframe with Bullish Doji candle.
4. Descending Flag Pattern Breakout with Retest with bullish trait 📈
Initial Target - ~34 Rs.
SL 1W Closing below 100 EMA

JUBLFOOD Probable price actionBased on the recent price action for Jubilant FoodWorks Ltd (JUBLFOOD), the stock shows a bullish trend in the short term:
1. The stock closed at ₹670.5 on February 14, 2025, up 1.27% from the previous close.
2. JUBLFOOD has been in an uptrend since late January 2025, rising from ₹638.65 on January 27 to the current price of ₹670.50.
3. The stock has shown strong momentum, breaking above the ₹700 level in early January before a brief pullback.
4. Recent price action indicates a recovery from the pullback, with the stock forming higher lows and higher highs since February 12, 2025.
5. The stock is trading above its 50-day moving average of ₹699.307, suggesting bullish sentiment in the medium term.
6. Volume has been above average in recent sessions, with 4,032,606 shares traded on February 14, compared to the average volume of 2,001,293.
7. The stock is showing strength relative to its 52-week range, currently trading closer to its year high of ₹796.75 than its year low of ₹421.05.
However, traders should note some potential resistance levels:
1. The stock may face resistance near the ₹700 level, which it failed to hold in early February.
2. The year high of ₹796.75 could act as a strong resistance if the uptrend continues.
Overall, the price action suggests a bullish short-term outlook for JUBLFOOD.

SHREECEM Price action analysisBased on the latest available data, the price action analysis for Shree Cement Ltd (SHREECEM) indicates a bullish trend in the short to medium term:
1. The stock is trading above its key moving averages, including the 5, 10, 20, 50, 100, and 200-day moving averages, suggesting strong upward momentum.
2. As of February 14, 2025, the stock was showing bullish signals for short-term, medium-term, and long-term investors.
3. The current price is significantly higher than the 200-day moving average of 26,081.26, indicating a sustained uptrend.
4. Recent price action has formed a cup and handle pattern on the daily chart, which is typically considered a bullish continuation pattern.
5. The stock has been in an uptrend since September 2023, breaking out of a sideways movement that had persisted since August 2022.
However, it's important to note some potential caution signals:
1. As of January 21, 2025, there were indications of a possible short-term downtrend, with the price falling below the important level of 25,422.22.
2. The stock was trading below its short-term Volume Weighted Average Price (VWAP) of 25,264.61, suggesting some selling pressure.
3. Technical indicators like ADX and MACD were showing sell signals in the short term as of January 21, 2025.
Given the conflicting signals between the January and February data, traders should closely monitor the stock for confirmation of the current trend and be aware of potential volatility.

SWING OPPORTUINTY IN FALLING MARKET (REDINGTON)Stock gave strong breakout of all time high and trading above it if it sustains above 230,we can see buying opportunity till 250 ,270.
Entry - Above 230
Target -250 to 273 (According to your risk management)
Stoploss - 211
This is not a buy or sell call, analysis is shared for educational purpose.

Breakout in Angel OneNSE:ANGELONE Breakout in angel one is possible after it crosses & confirms 2600
Put a SL at the swing low at 2300 levels
Aim for the targets of 2900 & 3000 for the 1st & 2nd one.

ONGC: Prepared for a 20% RallyThe chart of ONGC provides delineates critical price thresholds that signify breakout point, along with specific support level that serve as indicators of where buying interest may manifest.
Additionally, the chart highlights regions likely to act as resistance point for future price ascension, allowing for informed decisions on entry and exit strategies.
Disclaimer: The information contained in this technical analysis report is intended solely for informational and educational purposes. It should not be interpreted as financial advice or a recommendation to buy or sell any security. Investors are strongly encouraged to conduct their own research and consult with a qualified financial advisor before making any investment decisions.

PRAJINDPRAJIND has given inverted H&S pattern breakout. It is trading continously higher despite market correction. Market participation is also increased. It is trading nr ATH. Keep it in watchlist.

IRCTC by KRS Charts11 Nov 2024 / 11:11 AM
Why IRCTC ❓❓
1. Fundamentally Good Company. 💪
2. Technically, it was already Entered in Golden Reversal Zone. 🔅
3. Along With that inside that zone now Bulls Counter- Attack is visible ✅ which is formed at the bottom of the Trend for Reversal.
4. At recent Bottom Positive Order Block has formed and showing Bullish Traits from that level.
5. With Bull C. A. green candle RSI is showing Bullish Reversal Divergence.
Targets & SL is in Chart

IOLCP: The Next Big MoveFollowing a prolonged 4 month downtrend, IOLCP has successfully breached the significant resistance level at 417 on daily chart, which now serves as a change of character. The RSI has also crossed above the 60 threshold, further supporting the idea of positive momentum within the stock. Additionally, the daily closing prices are positioned above all EMAs, indicating a strong bullish sentiment.
At this juncture, IOLCP appears poised for upward movement, with the next resistance level identified at 514 . Refer to the accompanying chart for a visual representation of Resistance, Breakout and Stop-Loss.
Disclaimer: This analysis is provided solely for informational and educational purposes and should not be interpreted as financial advice. It is essential to conduct your own research and consult with a qualified financial advisor before making any investment decisions.
