BTCUSD 1H Market Structure and Important Price LevelsBTCUSD on the 1H timeframe is showing a stable price structure after a completed correction. The recent pullback found support near the 86,500 area, where selling pressure reduced and price stabilised. From this level, the market recovered and moved back above 90,000, indicating renewed bullish control.
Price above this level is forming higher highs and higher lows, showing improving short-term structure and trend strength. The 90,000–89,800 zone is acting as an important support, which previously worked as resistance. As long as price holds above this area, the structure remains valid.
On the upside, the 91,000 level is a short-term resistance where reactions may be seen. Acceptance above this zone would indicate continuation, while rejection may keep price moving within the current range. Pullbacks should be assessed within the broader structure.
Market attention remains on price reaction near key levels.
Disclaimer: This analysis is for educational purposes only. It is not financial advice. Trading involves risk and uncertainty.
Market insights

Inverted Cup pattern Possible on BTCThe Inverted Cup and Handle is a bearish continuation pattern used in technical analysis. It is the mirror image of the classic "Cup and Handle" and signals that a stock or asset is likely to resume a downward trend after a brief period of consolidation.
Here is a breakdown of how to identify and trade it.
Structure of the Pattern
The pattern looks like an upside-down "U" followed by a small upward drift. It consists of two main parts:
The Inverted Cup: After a significant price drop, the asset forms a rounded peak. This happens as buyers try to push the price back up, but momentum fades, creating a smooth, curved top.
The Handle: Following the cup, the price makes a small, upward-sloping retracement. This is essentially a "bear flag"—a temporary pause where exhausted buyers make one last stand before the sellers take over again.

Chapter 10 — Exit Intelligence & Trade AgingHow MARAL manages exits when the trade is “right”… but the market is changing.
(Reference: your attached BTCUSD 1H chart, Jan 04, 2026)
10.1 The core idea
Most traders lose profits for only two reasons:
They exit too early (fear) during continuation.
They exit too late (greed) after expansion is already mature.
MARAL Exit Intelligence is designed to solve this by converting “exit emotion” into rule-based states:
Trade Age tells you where the trade is in its lifecycle
Risk State tells you how fragile the trade is right now
Exit Pressure + Obstacle Ahead tells you when the market is starting to push back
Action State tells you the next move: HOLD / REDUCE / PROTECT / EXIT
MARAL does not “predict the top.”
It detects when the trade has shifted from profit potential → risk dominance.
10.2 What MARAL watches for exits
MARAL exits are not one trigger. They are a stack of confirmation.
A) Trade Age (time + distance)
Trade age is not only “how many candles.”
It’s also: how far price has traveled relative to normal movement.
MARAL treats a trade like this:
FRESH → early delivery, best continuation odds
MATURE → mid-delivery, needs management discipline
OVEREXTENDED / LATE → high reward already captured, risk of reversal increases
STALE → market stopped paying you, exit logic becomes aggressive
✅ In your chart, Management Desk shows TRADE AGE: FRESH, but RISK STATE: OVEREXTENDED.
This is an important combination and MARAL handles it cleanly.
Meaning:
The trade may still be structurally healthy (fresh continuation context),
but price has moved far enough that risk is now elevated, so management must tighten.
B) Risk State (profit protection mode)
Risk State is the exit-intelligence backbone.
Common MARAL Risk States (conceptually):
STABLE → normal management
CAUTION → tighten SL, stop adding
OVEREXTENDED → scale out + protect aggressively
NEGATIVE / FRAGILE → exit-ready, do not negotiate
✅ In your chart: RISK STATE = OVEREXTENDED
This is MARAL’s warning that “the move has already paid; don’t let profit turn into regret.”
C) Exit Pressure (market pushback detector)
Exit Pressure rises when the market starts showing:
momentum weakening after expansion
repeated wick rejection near highs
inability to progress (stalls)
divergence behavior (internal weakness)
reaction at premium arrays / obstacles
✅ In your chart: EXIT PRESSURE = LOW and MOMENTUM HEALTH = STRONG
So MARAL does not ask you to panic-exit.
Meaning:
The market is still supporting continuation, but because Risk State is overextended, MARAL says:
“Hold — but protect.”
D) Obstacle Ahead (where exits are likely to trigger)
Obstacle Ahead flips to YES when price is approaching:
a higher timeframe premium array / resistance
a likely sell-side liquidity defense
an unfilled imbalance or supply zone that historically rejects
“stop run zones” where continuation often pauses
✅ In your chart: OBSTACLE AHEAD = NO
So MARAL is not seeing an immediate structural ceiling right in front.
10.3 Reading your attached chart using MARAL Exit Intelligence
What the boards are saying (your screenshot)
Context Board (Right):
Direction: Bullish
Structure: BULL Struct
Momentum: BULL
Trend strength: ADX 42.8 (strong)
Liquidity context: LOW
ECI Score: 58 (B)
LTF Exec: AVOID
EDC / Decision Core (Bottom center):
Setup: WAIT
Entry Permission: WAIT
Liquidity: LOW
Trade Status: VALID
Action State: HOLD
Management Desk (Bottom right):
Market Phase: CONTINUATION
Momentum Health: STRONG
Exit Pressure: LOW
Risk State: OVEREXTENDED
Trade Age: FRESH
Action State: HOLD
MARAL interpretation (clean execution meaning)
This is a textbook “do not add / do not chase” condition.
The trend is strong (ADX high, momentum strong)
Market phase is continuation
Exit pressure is low (so no forced exit)
But liquidity is low + risk is overextended
Therefore the correct action is:
✅ HOLD the position (if already in)
❌ DO NOT open new entries here
✅ Switch into protection mode (Exit Intelligence)
10.4 What MARAL would recommend here (practical playbook)
If you are already in profit (best-case)
MARAL Exit Intelligence = “Hold with protection.”
Do this in order:
Scale-out logic (profit locking)
Take partial profit at the first “overextended” warning
Keep a runner only if momentum remains strong and exit pressure stays low
A premium rule:
If RISK STATE = OVEREXTENDED, you must “pay yourself” at least once.
Move to protected SL
Tighten SL under:
the nearest clean structure low, or
last impulsive base, or
a logical “continuation invalidation” level
Never widen SL during overextended state.
Trail only after confirmation
Trailing should activate only if:
momentum stays strong AND
exit pressure remains low-to-neutral
If exit pressure starts rising → trailing becomes aggressive.
No re-entry / no pyramiding
Your own board says it: Entry Permission WAIT, LTF Exec AVOID, Liquidity LOW.
This is not a “more entries” zone. It’s a “manage the winner” zone.
If you are NOT in a trade (most important)
Your chart is clearly telling:
ECI 58 (B) + Entry Permission WAIT + Liquidity LOW + LTF Exec AVOID
That is MARAL’s way of saying:
“This is not a clean entry location.
Your job is to wait for a better execution window.”
So the correct decision is no trade until permission flips.
10.5 When MARAL would flip from HOLD → EXIT
Your chart is HOLD now, but Exit Intelligence has clear upgrade triggers.
MARAL would push toward EXIT when you see any combination like:
Exit trigger stack (high reliability)
Exit Pressure: LOW → NEUTRAL → HIGH
Momentum Health: STRONG → MIXED → WEAK
Obstacle Ahead: NO → YES
Risk State stays OVEREXTENDED while progress stalls
Trade Age shifts toward MATURE / STALE
Liquidity remains LOW and price starts “wicking” repeatedly
When 2–3 of those align, MARAL’s action state should shift:
HOLD → PROTECT → REDUCE → EXIT
10.6 Trade Aging rules (MARAL discipline)
This is how you keep winners and kill losers fast:
A) Fresh trade
Let it work
Do not micro-manage
Only adjust SL after structure confirms
B) Mature trade
Start paying yourself
Convert SL to protected
Stop re-entries unless liquidity improves
C) Overextended trade (your chart)
Mandatory profit lock
Tight management
No adding
Exit plan prepared in advance
D) Stale trade
If it doesn’t progress, it must exit
Time becomes an enemy when liquidity is low
10.7 The hidden advantage in your screenshot
Your chart shows something very “institutional”:
✅ Continuation + Strong momentum
but also
⚠️ Overextended + Low liquidity
This is exactly where most retail traders give profits back.
MARAL’s solution is precise:
It does not panic-exit (because exit pressure is low)
It does not allow greed entries (because permission is WAIT)
It converts the trade into a protected asset:
“Let it run, but don’t let it reverse.”
That is Exit Intelligence.
Exit when:
Exit Pressure rises + Momentum Health degrades
OR Obstacle Ahead becomes YES and progress stalls
OR Trade becomes stale (time without progress)
#MARAL #ExecutionIntelligence #TradingPsychology #RiskManagement #TradeManagement #SmartMoneyConcepts #ICT #PriceAction #Liquidity #Bitcoin #BTCUSD #TradingView

Weekly Analysis with buy/Sell scenarios in BTCAnother week and price is moved as expected in same range. No view change since last prediction.
Refer previous details below…
We analyzed three weeks back that BTC would be in range for some time before taking any further move, And BTC is following same analysis and trapped within a small range since then. BTC prediction of last week also worked perfectly well and market kept in consolidation mode itself. BTC is still in consolidation zone and may spend some more days. It may develop ABC pattern or reversal at identified daily FVG level, if price has to change its delivery and take turn from here. This zone is kind of make or break. If price is not able to sustain and breakdown, then it may witness ~65-70K levels as well.
We hope for reversal from this level as price is developing the pattern at higher time frame.
1. Price has taken liquidity or 82K and almost touched 80K.
2. It has inversed 1Day FVG and now price is consolidating in the range between EMAs.
3. We may expect price retracement till 1D iFVG and then reversal.
4. Before to that we may see sweep of 92900 (1D CISD) level and then a retracement short trade till 1D FVG
5. Most probably price will take liquidity of FVG/RDRB level and create MSS/CISD/TS/iFVG in LTF.
6. Price should show rejection/reversal in respective LTF (5m/15m) at FVG zone.
7. Take the trade only once clear entry model i.e. turtle soup. iFVG break, CDS or MSS happens on LTF
All these combinations are signalling a high probability trade scenario.
Note – if you liked this analysis, please boost the idea so that other can also get benefit of it.
Also follow me for notification for incoming ideas.
Also Feel free to comment if you have any input to share.
Disclaimer: This analysis is for educational purposes only and does not constitute investment advice. Please do your own research (DYOR) and check with your financial advisor before making any trading decisions.

BTCUSD 1H Structure Shift Signals Bullish Continuation AheadBTCUSD 1H displays a clear intraday trend transition based on price action. Initially, price respected a bearish structure with lower highs and lower lows. A strong bullish displacement above prior structure confirmed a Change of Character , indicating a shift in order flow.
After the CHoCH, the market formed higher highs and higher lows, confirming an emerging uptrend. A clear Break of Structure near 92,000 reinforced buyer strength. The impulsive rally left a Fair Value Gap between roughly 91,200–91,800, now acting as a high-probability demand zone and potential buy area on pullbacks.
Key support is located at 92,000–91,800, followed by deeper support near 90,400. Holding above these levels maintains bullish bias. Resistance is seen around 93,800–94,200, with upside liquidity resting near 95,000–95,200.
Overall price behavior suggests corrective pullbacks within a healthy uptrend. Bias remains bullish while above demand. This view is educational and based purely on structure and price behavior on trading.

Bitcoin Bybit chart analysis JENUARY 8Hello
It's a Bitcoin Guide.
If you "follow"
You can receive real-time movement paths and comment notifications on major sections.
If my analysis was helpful,
Please click the booster button at the bottom.
This is Bitcoin's 30-minute chart.
The Nasdaq indicator will be released shortly at 10:30 AM.
*When the red finger moves,
this is a one-way long position strategy.
1. $89,346.8 is the entry point for a long position.
Stop-loss price is set when the green support line is broken.
(It must be touched before 9 PM,
to complete the 6+12 pattern and trigger an uptrend.)
2. I've marked the wave path with the finger in the middle.
The short-term target price is $90,546 -> $91,516.9.
After re-entering the long position at $90,880,
the target price is in order from Top -> Good -> Great.
If it touches the bottom today,
the mid-term pattern will be broken again,
creating the possibility of further declines. Please be careful.
The bottom section is connected to the uptrend line, so it's best to maintain a long position.
The bottom section is open up to section 1.
Please note that my analysis up to this point is for reference only.
I hope you operate safely, with a clear focus on principled trading and stop-loss orders.
Thank you.

BTC at Major Resistance | Short Opportunity Near 90K ZoneBitcoin (BTCUSD) is approaching a key resistance zone between 89,900 – 90,600, an area where price has a higher probability of facing selling pressure.
📌 Trade Idea (Short Setup):
Instrument: BTCUSD
Sell Zone: 89,900 – 90,600
Target Area: 88,500 – 88,000
This zone may act as a supply area, where bears could step in to defend higher prices. Rejection signals or weakness near resistance could offer a favorable risk-to-reward short opportunity.
⚠️ Always wait for confirmation and manage risk wisely.
📌 Disclaimer:
This analysis is for educational purposes only and is not financial advice. Always manage risk and follow your trading plan.
Your feedback drives our content and keeps everyone trading smarter. Let’s make those pips together! 🚀
Happy Trading,
– The InvestPro Team

buy bitcoin for short term swingEntry Price (BUY): 90,330
This level indicates bullish intent. Price holding above this zone suggests buyers are in control and momentum is shifting upward.
⸻
🔻 Stop Loss: 89,670
• Placed 660 points below entry
• This level protects capital if the market moves against the trade
• A breakdown below 89,670 would invalidate the bullish setup, so exiting here is disciplined risk management
⸻
🎯 Target Price: 93,700
• Potential upside of 3,370 points
• This target is based on expected continuation of bullish momentum and breakout follow-through
• Strong reward zone where partial or full profit booking is advised
⸻
⚖️ RISK–REWARD ANALYSIS
• Risk: 660 points
• Reward: 3,370 points
👉 Risk–Reward Ratio ≈ 1 : 5.1
This is an excellent risk–reward trade, meaning even if only a few such trades work, overall profitability remains strong.
⸻
🧠 TRADE LOGIC (WHY THIS TRADE MAKES SENSE)
• Price is positioned for an upward breakout / continuation
• Stop loss is tight and logical, not emotional
• Target allows the trend to fully develop
• High reward compared to limited risk makes this trade strategically sound
⸻
✅ FINAL TRADE SUMMARY
BUY @ 90,330
STOP LOSS @ 89,670
TARGET @ 93,700
📌 Trend-following | High R:R | Disciplined setup

Why Bitcoin Broke Out After Weeks of Boring Price Action?Hello guy's let's analyse Bitcoin because for weeks, Bitcoin stayed inside a tight compression range while most traders lost interest. Price looked slow, directionless, and boring, exactly the phase where liquidity gets built quietly.
This breakout matters because it didn’t come after a spike.
It came after patience.
What the chart is really showing
A macro descending resistance was respected for months, keeping sellers confident.
Price compressed inside a clear accumulation zone, forming higher lows while absorbing supply.
Multiple rejections failed to push price lower, a classic sign of seller exhaustion.
Once liquidity was built and weak hands were positioned wrong, price expanded cleanly
Why this breakout is different from random moves
Most breakouts fail because they happen too early.
This one happened after time did the hard work.
No emotional spike before the move.
No vertical candles inside the range.
Compression + absorption first, expansion later.
That’s how sustainable moves begin.
When everyone gets bored, structure is usually being prepared.
And when structure completes, the move looks “sudden” only to those who weren’t watching.
Final thought
As long as price holds above the broken structure, this breakout remains valid.
Failure only comes if price accepts back inside the range, until then, momentum favors continuation.
If this helped you see the market differently, like, follow, or share your view below.
Analysis By @TraderRahulPal | More analysis & educational content on my profile.

BTC PredictionI’ll analyze what your BTCUSD (Daily) chart is showing and what to expect next, based strictly on the structure you marked (A-B-C-D + wedge/triangle).
🔍 What the chart is telling
1️⃣ Market structure
Strong downtrend from ~115k → 90k (below 50 & 200 EMA).
Price is now consolidating inside a descending / contracting triangle (wedge).
You’ve marked a harmonic-like ABCD corrective structure after the impulse drop.
This is not accumulation yet — it’s a bearish continuation setup unless proven otherwise.
2️⃣ EMA & Trend context
Price below 50 EMA (yellow) & 200 EMA (black) → bearish bias
EMAs are sloping down, acting as dynamic resistance
Repeated rejection near 92k–93k zone
➡️ Trend is still DOWN.
3️⃣ Triangle / Wedge interpretation
Lower highs + slightly higher lows
Volume contraction (implied)
This pattern usually resolves in the direction of the prior trend
📌 Prior trend = DOWN, so breakdown probability is higher
🎯 Key Levels to Watch
Resistance (very important)
92,800 – 93,200 → strong supply + EMA resistance
99,900 – 100,000 → major trendline resistance (unlikely without breakout)
Support
90,500 – 91,000 → current support (make-or-break zone)
85,000
78,000 – 76,000
71,600 (major weekly support)
📉 Most Probable Scenarios
🔴 Scenario 1: Bearish Breakdown (HIGH probability)
If daily candle closes below 90,500:
Target 1: 85,000
Target 2: 78,000
Target 3: 71,600
This matches your green downside projection box ✔️
🟢 Scenario 2: Bullish Invalidity (LOW probability)
Only if:
Daily close above 93,500
Then reclaim 95,000
And finally break 100,000 with volume
Until then → all upside is just a pullback
🧠 Smart Trading Advice (very important)
❌ Avoid long positions inside the triangle
✅ Trade breakout or breakdown only
For investors: wait near 78k–72k zone for accumulation
Risk is still high
🧾 Summary
Structure: Bearish continuation
Pattern: Descending triangle / corrective ABCD
Bias: Down
Expectation: Breakdown before any major rally

BTCUSD 1H Trend Shift Highlights Key Support and Recovery ZoneBitcoin on the 1H timeframe shows a complete cycle of trend development and correction based on clean price action. The market initially respected a bullish structure, forming higher highs and higher lows along an ascending trendline. Strong buying pressure pushed price above previous resistance, confirming bullish continuation and a clear Break of Structure . This impulsive move created a Fair Value Gap in the 91,200–91,700 area, which acted as a demand zone and supported further upside.
As price approached the 94,000–94,500 region, bullish momentum weakened and selling pressure increased. A lower high formed, followed by a decisive break below the rising trendline, signaling a short-term trend reversal. Price then respected a descending trendline, confirming a bearish intraday structure with lower highs and lower lows.
Current price is reacting near the 90,000–89,800 zone, which acts as key support. This area also represents a potential demand zone where buyers may attempt a recovery. A sustained hold above this level can lead to a corrective rebound toward 91,200 and 92,000. Resistance remains at 92,800–93,200, followed by major resistance near 94,000.
Overall, the market is in a corrective bearish phase after a strong rally. Bullish continuation is possible only if support holds and structure shifts again. This analysis is educational and based solely on technical price behavior.

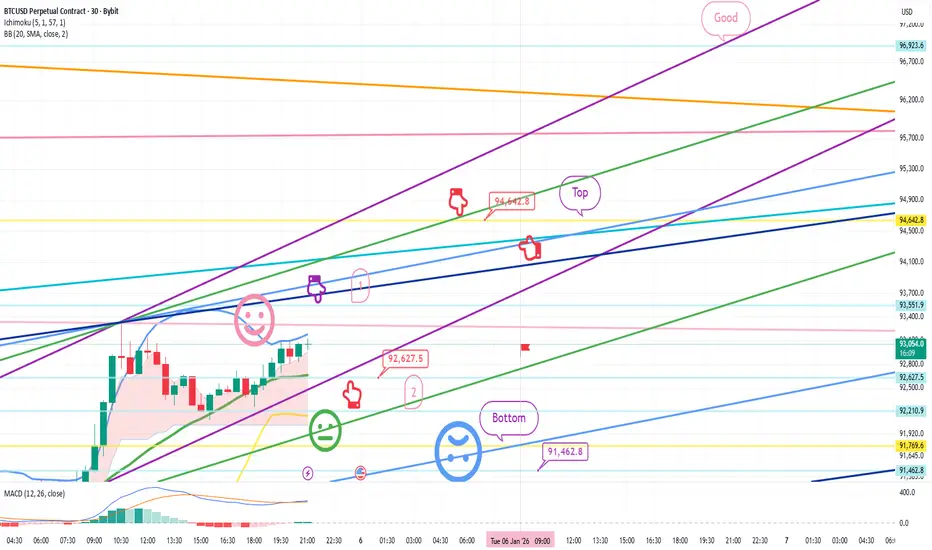
Bitcoin Bybit chart analysis JENUARY 5Hello
It's a Bitcoin Guide.
If you "follow"
You can receive real-time movement paths and comment notifications on major sections.
If my analysis was helpful,
Please click the booster button at the bottom.
This is a Bitcoin 30-minute chart.
There will be a Nasdaq indicator release at 12:00 PM shortly.
*If the red finger moves,
this is a conditional long position strategy.
1. After touching the first purple finger at the top,
switch to a long position at $92,627.5 / stop-loss if the green support line is broken.
2. At the top, $94,642.8 is the first target price at the top -> Good. Second target price.
(If the Good level is reached, there is a high possibility of a short-term rise to 104.7K.)
Also, if the first target price at the top is touched,
a vertical rise may occur immediately.
If it fails to touch the first target and immediately falls,
wait for a final long position at the second target price at $92,210.9. (If the green support line is broken, the stop-loss price remains the same.)
I've also marked a bottom level of $91,462.8.
If the price falls below this level, the weekly and daily candlestick lows will be broken, so it may take time for the uptrend to resume.
It would be advantageous for a long position to hold until the light blue support line is reached, right?
Please use my analysis as a reference only.
I hope you operate safely, following the rules and maintaining a stop-loss price.
Thank you.
Impact on Global TradeEconomic Growth and Development
One of the most significant impacts of global trade is its contribution to economic growth. Trade allows countries to specialize in the production of goods and services in which they have a comparative advantage. This specialization increases efficiency, productivity, and overall output. Developing countries, in particular, benefit from access to larger international markets, enabling them to grow industries, attract foreign investment, and integrate into global value chains. For many emerging economies, export-led growth has been a key driver of poverty reduction and improved living standards.
At the same time, advanced economies benefit from global trade by gaining access to cheaper raw materials, intermediate goods, and consumer products. This helps control costs, increase competitiveness, and enhance consumer welfare through lower prices and greater product variety.
Employment and Labor Markets
Global trade has a mixed impact on employment. On one hand, it creates millions of jobs worldwide in manufacturing, services, logistics, finance, and technology. Export-oriented industries often experience job growth as demand from international markets increases. Service sectors such as IT, finance, consulting, and outsourcing have expanded rapidly due to globalization and digital trade.
On the other hand, global trade can lead to job displacement, especially in industries that face strong foreign competition. Workers in less competitive sectors may experience job losses or wage pressure. This has increased the need for reskilling, upskilling, and stronger social safety nets. The overall impact on employment depends on how well countries manage trade transitions through education, labor reforms, and inclusive economic policies.
Global Supply Chains and Efficiency
Modern global trade is deeply interconnected through global supply chains. A single product may involve raw materials from one country, manufacturing in another, and assembly and distribution across multiple regions. This system has significantly increased efficiency, reduced production costs, and accelerated innovation.
However, recent global disruptions—such as pandemics, geopolitical conflicts, and trade restrictions—have highlighted the vulnerabilities of highly integrated supply chains. As a result, many countries and companies are rethinking trade strategies, focusing on supply chain diversification, regional trade, near-shoring, and resilience rather than purely cost-based efficiency.
Impact of Technology and Digital Trade
Technology has transformed global trade more than any other factor in recent decades. Digital platforms, e-commerce, artificial intelligence, blockchain, and advanced logistics have reduced trade barriers and transaction costs. Small and medium-sized enterprises (SMEs) can now access global markets that were once dominated by large multinational corporations.
Digital trade has expanded services exports, including software, digital content, online education, and financial services. At the same time, it has raised new challenges related to data privacy, cybersecurity, digital taxation, and regulatory harmonization. Countries that invest in digital infrastructure and skills are better positioned to benefit from this transformation.
Trade Policies and Protectionism
Trade policies play a crucial role in shaping global trade flows. Free trade agreements, regional trade blocs, and multilateral institutions have historically promoted trade liberalization, reducing tariffs and non-tariff barriers. This has encouraged cross-border investment and economic integration.
However, rising protectionism, trade wars, and economic nationalism have altered the global trade landscape. Tariffs, sanctions, export controls, and regulatory barriers can disrupt trade flows, increase costs, and create uncertainty for businesses. While some protectionist measures aim to protect domestic industries or national security, excessive restrictions can slow global economic growth and strain international relationships.
Geopolitical and Strategic Impacts
Global trade is increasingly influenced by geopolitics. Strategic competition between major economies affects trade policies, technology transfer, energy markets, and supply chains. Trade is no longer purely an economic activity; it is also a strategic tool used to gain influence and reduce dependency on rivals.
This shift has led to the fragmentation of global trade into regional and strategic blocs. Countries are prioritizing trade partnerships based on political alignment and strategic interests, which may reshape long-term global trade patterns and reduce the efficiency of the global trading system.
Impact on Inflation and Consumer Prices
Trade has a direct impact on inflation and consumer prices. Open trade generally lowers prices by increasing competition and allowing access to cheaper imports. Consumers benefit from a wider range of affordable products, improving purchasing power and living standards.
Conversely, trade disruptions, tariffs, and supply chain shocks can increase costs and contribute to inflation. Rising transportation costs, energy prices, and trade restrictions can quickly translate into higher consumer prices, affecting households and businesses alike.
Environmental and Sustainability Considerations
Global trade has both positive and negative environmental impacts. On one side, it enables the global diffusion of green technologies, renewable energy equipment, and sustainable practices. International cooperation through trade can support climate goals and environmental innovation.
On the other side, increased trade can lead to higher carbon emissions, resource depletion, and environmental degradation if not properly regulated. As a result, sustainability is becoming a central theme in global trade, with growing emphasis on carbon pricing, green trade policies, ESG standards, and sustainable supply chains.
Future Outlook of Global Trade
The future of global trade will be shaped by a balance between globalization and localization. While complete de-globalization is unlikely, trade patterns are expected to become more diversified, digital, and sustainability-focused. Regional trade agreements, technological innovation, and resilient supply chains will play a larger role.
Countries that adapt to these changes by investing in technology, skills, infrastructure, and inclusive trade policies will benefit the most. Global trade will continue to be a critical driver of economic progress, but its impact will depend on how well the world manages risks, inequalities, and global cooperation.
Conclusion
The impact on global trade is profound and far-reaching, influencing economic growth, employment, innovation, geopolitics, and sustainability. While global trade has delivered immense benefits, it also presents challenges that require careful policy management. In an increasingly interconnected yet uncertain world, the future success of global trade will depend on resilience, adaptability, and international collaboration.

BTCUSD Price Structure & Key LevelsBTCUSD is showing a clear recovery after an earlier corrective decline. Price found strong buying interest around the 86,000–86,500 zone, where selling pressure weakened and the market began forming higher lows. This behaviour signalled a shift in control from sellers to buyers.
The bullish shift was validated once price achieved a Break of Structure above previous resistance. Following this move, BTCUSD continued to build a sequence of higher highs and higher lows, confirming an active bullish trend. The upward movement is supported by impulsive candles, while pullbacks remain shallow, indicating stable momentum rather than distribution.
During the rally, multiple Fair Value Gaps were left behind, created by strong directional movement. Key demand areas are visible around 91,200–90,800 and further below near 89,200–88,800. These zones may attract buyers again if price retraces, as they represent areas of price imbalance.
On the upside, price is reacting near the 94,200–94,400 resistance band, which aligns with prior highs and short-term liquidity. A sustained hold above this zone may allow continuation toward the 96,000 region, while rejection here could lead to a healthy pullback into previous demand without changing the overall trend.
In summary, the market structure remains bullish as long as price holds above the most recent higher low, with attention on reactions at highlighted support and resistance levels.
Disclaimer: This analysis is for educational purposes only. It is not financial advice. Trading involves risk and uncertainty.

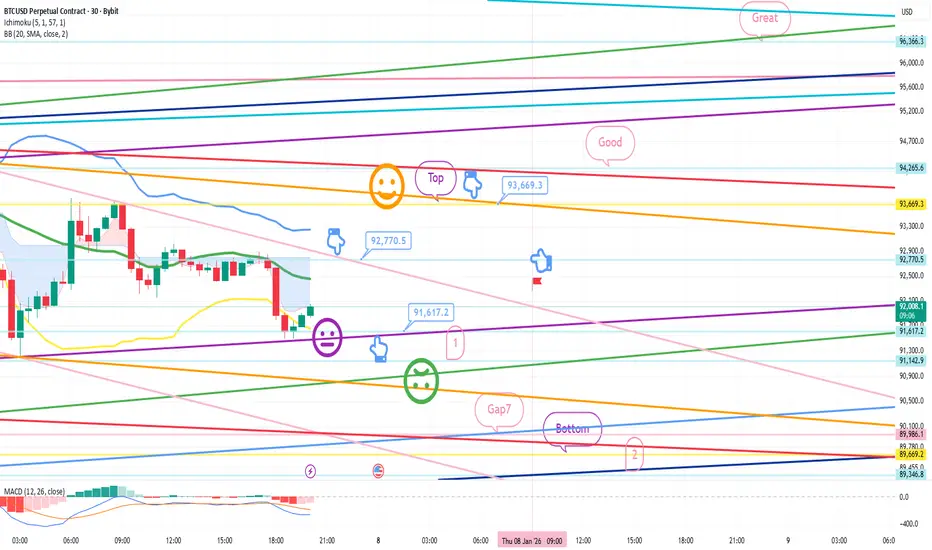
Bitcoin Bybit chart analysis JENUARY 7 Hello
It's a Bitcoin Guide.
If you "follow"
You can receive real-time movement paths and comment notifications on major sections.
If my analysis was helpful,
Please click the booster button at the bottom.
This is Bitcoin's 30-minute chart.
There will be two Nasdaq indicator releases at 12:00 PM.
*If the light blue finger moves in a two-way direction, it indicates a short-to-long switching or long-wait strategy.
1. $92,770.5 is the entry point for a short position at the top. Stop loss is set when the pink resistance line is broken.
2. $91,617.2 is the switch point for a long position. Stop loss is set when the green support line is broken.
3. $93,669.3 is the first target for a long position. Target prices are Good and Great in that order.
If the price immediately declines without touching the short entry point at the top, wait for a long position at the first zone.
The stop loss is the same when the green support line is broken.
If the first section breaks,
from Gap 7 at the bottom, the price remains open up to Section 2,
and this section marks the recovery of the medium-term pattern.
Since the daily and weekly candlestick lows have been broken,
there is a risk of further decline,
but if the price maintains the second section, there should be no major issues within the long-term uptrend.
Please note that my analysis is for reference only.
I hope you operate safely, with a clear focus on principled trading and stop-loss orders.
Thank you.
BTCUSDT – London Session Long (Intraday)BTC is holding above a key intraday demand zone after a sharp sell-off, followed by a strong reaction and higher low. Price is consolidating, and the London session often provides expansion from such structures.
Trade Plan
🔺 Entry Zone: 92,500 – 92,650
🛑 Stop Loss: 91,750 (below demand)
🎯 Targets:
• TP1: 93,200
• TP2: 94,000
Entry Confirmation
15m close above 92,600 (preferred)
OR 5m break & retest holding above the entry zone
Invalidation
15m close below 92,300
📌 Trade management: partials at TP1, trail rest toward TP2.
⚠️ Not financial advice. Trade responsibly.

BTCUSDT Perpetual – Short Idea (FVG + Supply Rejection)BTC price faced rejection from a higher timeframe resistance zone and left a visible Fair Value Gap (FVG) above. Current structure shows consolidation below supply, increasing the probability of a downside continuation if the zone holds.
Trade Plan
🔻 Short Entry Zone: 93,300 – 93,500
🛑 Stop Loss: 94,000 (above resistance)
🎯 Targets:
• TP1: 92,400
• TP2: 90,500,
Confluence
HTF resistance rejection
FVG acting as supply
Weak follow-through after bounce
Range low liquidity resting below
📌 Risk Management :
Wait for confirmation on lower timeframe. Invalidation only above the marked supply.
⚠️ Not financial advice. Trade responsibly.

BTC/USD Daily Chart – Bullish Recovery Above Rising TrendlineOverall Structure
Bitcoin is in a recovery phase following a sharp decline from the previous highs.
Price is forming higher lows, suggesting buyers are regaining control in the short term.
The market remains below all-time highs, so this move is still considered a corrective rally within a larger cycle.
Trendline Behavior
Price is respecting a rising support trendline, which acts as dynamic support.
As long as BTC holds above this trendline, the bullish recovery structure remains valid.
A breakdown below the trendline would weaken the current bullish bias.
Momentum Indicators
RSI (14): ~60
Indicates moderate bullish momentum.
RSI is not overbought, leaving room for further upside.
MACD (12,26,9):
MACD lines are crossing upward.
Momentum is improving but still in an early expansion phase.
Awesome Oscillator (AO):
Histogram has turned green, confirming positive momentum shift.
Key Price Levels
Immediate Support: $90,000
Major Support: $84,000–$86,000
Immediate Resistance: $95,000–$96,000
Next Upside Targets: $100,000 and $104,000
Market Bias
Short-term bias: Bullish while above $90k and trendline support.
Mid-term bias: Neutral-to-bullish, pending a confirmed breakout above $96k.
Volume expansion on a breakout would be critical for confirmation.

BTCUSD (ONDA) IntraSwing Levels For 06th - 07th JAN '26(3.30 am)BTCUSD (ONDA) IntraSwing Levels For 06th - 07th JAN '26(3.30 am)
💥Level Interpretation / description:
L#1: If the candle crossed & stays above the “Buy Gen”, it is treated / considered as Bullish bias.
L#2: Possibility / Probability of REVERSAL near RLB#1 & UBTgt
L#3: If the candle stays above “Sell Gen” but below “Buy Gen”, it is treated / considered as Sidewise. Aggressive Traders can take Long position near “Sell Gen” either retesting or crossed from Below & vice-versa i.e. can take Short position near “Buy Gen” either retesting or crossed downward from Above.
L#4: If the candle crossed & stays below the “Sell Gen”, it is treated / considered a Bearish bias.
L#5: Possibility / Probability of REVERSAL near RLS#1 & USTgt
HZB (Buy side) & HZS (Sell side) => Hurdle Zone,
*** Specialty of “HZB#1, HZB#2 HZS#1 & HZS#2” is Sidewise (behaviour in Nature)
Rest Plotted and Mentioned on Chart
Color code Used:
Green =. Positive bias.
Red =. Negative bias.
RED in Between Green means Trend Finder / Momentum Change
/ CYCLE Change and Vice Versa.
Notice One thing: HOW LEVELS are Working.
Use any Momentum Indicator / Oscillator or as you "USED to" to Take entry.
⚠️ DISCLAIMER:
The information, views, and ideas shared here are purely for educational and informational purposes only. They are not intended as investment advice or a recommendation to buy, sell, or hold any financial instruments. I am not a SEBI-registered financial adviser.
Trading and investing in the stock market involves risk, and you should do your own research and analysis. You are solely responsible for any decisions made based on this research.
"As HARD EARNED MONEY IS YOUR's, So DECISION SHOULD HAVE TO BE YOUR's".
Do comment if Helpful .
Do Comment for In depth Analysis.
❇️ Follow notification about periodical View
💥 Do Comment for Stock WEEKLY Level Analysis.🚀

#BTC.P Up for next super cycle?
BTC is in a corrective downtrend within a defined channel and is currently reacting from a higher-timeframe demand zone. The setup anticipates a potential trend reversal contingent on a confirmed breakout and acceptance above the descending trendline and mid-range resistance. Upside expansion is expected only after structure flip and consolidation; failure to hold demand invalidates the bullish bias. This is a conditional re-accumulation setup, not a blind bottom call.

Bitcoin Bybit chart analysis JENUARY 2Hello
It's a Bitcoin Guide.
If you "follow"
You can receive real-time movement paths and comment notifications on major sections.
If my analysis was helpful,
Please click the booster button at the bottom.
This is a 30-minute Bitcoin chart.
There's no separate Nasdaq indicator release.
I was pressed for time today, so I did this in a hurry.
*Long position strategy based on the red finger movement path
1. $88,721.5 long position entry point / Stop loss if the green support line is broken
2. $90,815 long position primary target -> Good, Great, Miracle
Target prices in that order until the weekend
If the price doesn't fall to the red finger entry point,
but touches the first section in the middle,
and then rebounds within the purple support line,
it's a vertical rise (a strong upward movement).
If the price breaks below the light blue support line,
be careful, as further downtrends or mischief may occur.
The price could fall to approximately $87,840.9 on the screen.
The current price has reached the daily Bollinger Band resistance line,
so if the strategy fails, a strong correction is possible.
If the long position strategy succeeds, a strong upward trend is possible even after tomorrow.
Please pay attention to Nasdaq movements from now on.
Please use my analysis to this point for reference only.
I hope you operate safely, with principled trading and stop-loss orders essential.
Thank you.

Bitcoin Bybit chart analysis JENUARY 6Hello
It's a Bitcoin Guide.
If you "follow"
You can receive real-time movement paths and comment notifications on major sections.
If my analysis was helpful,
Please click the booster button at the bottom.
This is the Bitcoin 30-minute chart.
There are no Nasdaq indicators released today.
With the MACD dead cross in progress on the 4-hour chart,
the current position is divided into upside and downside.
Note the pink resistance line and purple support line at the top.
In this situation,
I boldly developed a strategy.
In the lower left corner, the purple finger connects the strategy to the long position entry point, $92,527.5, which was entered yesterday, January 5th.
*If the red finger moves,
I'm following the chase buying strategy.
1. Chase buying at $93,744.7 / Stop loss if the green support line is broken.
2. Long position 1st target price at $96,366.3 -> Good, 2nd target price.
From the current position, if 1 -> If the orange resistance line is broken first,
or the purple parallel line is maintained without breaking away,
there is a possibility of a vertical uptrend.
(Since the second section at the bottom is a sideways market, I intentionally set a generous stop-loss level.)
Conversely, if the price fails to touch the purple finger at the first section above the current level, there's a possibility of a decline to the bottom.
The bottom is the final long position re-entry and waiting area.
Below that, the third section is open, so please be careful.
Please use my analysis to this point for reference only.
I hope you operate safely, adhering to principled trading and stop-loss levels.
Thank you.

Btc big trade to analysis Here is a breakdown of the key elements and the strategy being described:
1. The Core Strategy: Liquidity Sweep
marked two grey boxes labeled "liquidity grab." * What this means: In trading, "liquidity" often sits just below recent lows where traders place their "Stop Loss" orders.
* The Prediction: The text "Req. This liquidity grab before b/o" the price needs to drop into the $80,500 – $82,000 range first. This "flushes out" sellers and collects buy orders before the price has enough strength to breakout (b/o) to the upside.
2. The Resistance Levels (Targets)
There are two major horizontal lines acting as hurdles for the price:
* Intermediate Resistance ($89,385). if a daily candle closes above this line, it confirms bullish momentum.
* Main Target ($98,981): This is the ultimate "take profit" zone for this specific trade setup.
3. Fair Value Gaps (FVG)
You can see small orange boxes labeled FVG.
* Definition: These are areas on a chart where there was an imbalance in price—usually a very fast move that left a "hole."
* Significance: Price often acts like a magnet to these gaps, returning to fill them before continuing in the original direction. There is a large FVG near the top ($100k+ range) that the analyst expects to be filled eventually.
4. Current Market Position
* Current Price: Approximately $87,516.
* Trend: The price recently had a sharp drop from $107k and is currently consolidating (moving sideways).
* Volume: The bars at the bottom show that trading volume is relatively steady, but the analyst is waiting for a "spring" move (the dip to $80k) to trigger a high-conviction buy.
Summary of the "Trade Plan"
If you were following this chart's logic, the steps would be:
* Wait for the price to dip into the $80k-$82k zone (the liquidity grab).
* Look for a reversal and a daily candle close above $89,385.
* Target the move up to $98,981.
Would you like me to explain more about how to identify "Liquidity Grabs" or how Fair Value Gaps work in more detail?
